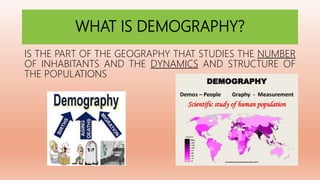
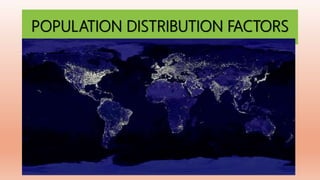
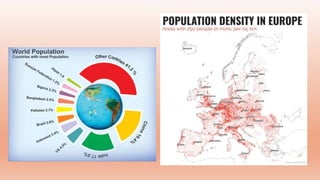
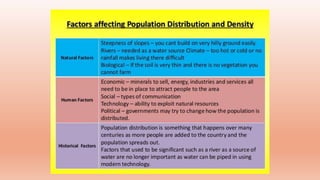
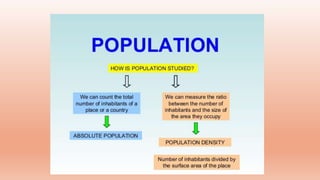
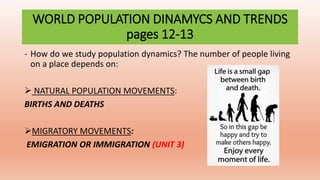
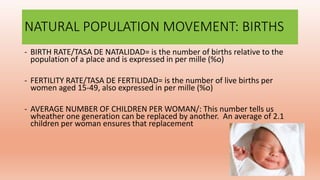
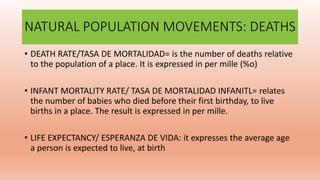
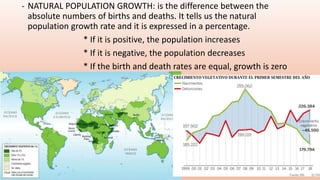
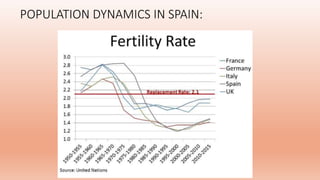
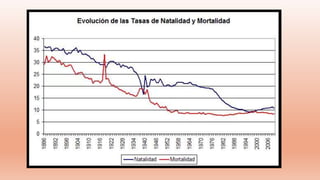
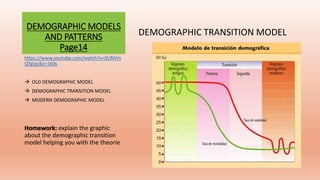
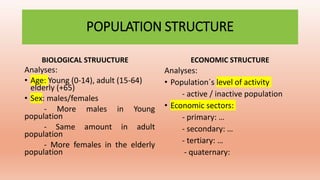
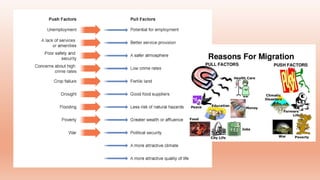
DEMOGRAPHY
“ THE POPULATION OF THE PLANET” 2º ESO
WHAT IS DEMOGRAPHY?
IS THE PART OF THE GEOGRAPHY THAT STUDIES THE NUMBER
OF INHABITANTS AND THE DYNAMICS AND STRUCTURE OF
THE POPULATIONS
HOW MANY PEOPLE ARE THERE IN THE WORLD?
7,7 BILLION
http://www.worldometers.info/world-population/
https://www.youtube.com/watch?time_continue=163&v=PUwmA3
Q0_OE
POPULATION DISTRIBUTION FACTORS
LOOK AT THE MAP IN YOUR BOOK (page 5) AND WITH A PARTNER TALK
ABOUT WHICH AREAS OF TEH WORLD ARE THE MOST DENSELY
POPULATED.
WHY DO YOU THINK SON MANY PEOPLE LIVE IN THESE AREAS?
GO TO PAGE 6 AND 7 AND…
A) SEARCH IN THE MAP THE MOST POPULATED COUNTRIES IN THE
WORLD (YOU MUST LIST ALMOST 10 COUNTRIES IN ORDER)
B) SEARCH IN THE MAP THE MOST POPULATED CITIES IN THE WORLD
(YOU MUST LIST ALMOST 10 CITIES IN ORDER)
C) READ THE TEXT AND ANSWER THE QUESTIONS:
• WHAT IS HAPPENING TO THE POPULATION IN EUROPE? WHY?
• WHAT IS THE NAME FOR THE DOCUMENT THAT COUNTS THE
POPULATION ALONG THE DIFFERENT COUNTRIES?
AND WHAT HAPPENED WITH SPAIN?
DISTRIBUTION OF THE POPULATION IN SPAIN
PAGES 30-31
• APART FROM THE COMMUNITY OF MADRID, THE TWO
ARCHIPIELAGOS (THE BALEARIC AND CANARY ISLANDS) AND THE
TWO AUTONOMOUS CITIES (CEUTA AND MELILLA), THE AREAS WITH
THE HIGHEST POPULATION DENSITIES ARE LOCATED AROUND THE
COASTS.
• GO TO PAGES 30 AND 31 AND MAKE ACTIVIES: A, B, 1, 2.
WHAT HAPPEN IN EUROPE?
GO TO PAGE 16 AND READ THE PART OF THE “AMOUNT AND
DISTRIBUTION”:
- UNDERLINE the key ideas
- How is the population in Europe distributed?
- Look to the map and write in the notebook the countries with more
than 200 inhabitants/km²
THE UNEVEN DISTRIBUTION OF POPULATION
• VERY LOW POPULATION DENSITY:
Below 10 inhabitants/km²
• LOW POPULATION DENSITY:
Between 10-50 inhab./km²
• MODERATE POPULATION DENSITY:
between 50-100 inhab./km²
• HIGH POPULATION DENSITY: over
100 inhab./km²
WORLD POPULATION DINAMYCS AND TRENDS
pages 12-13
- How do we study population dynamics? The number of people living
on a place depends on:
 NATURAL POPULATION MOVEMENTS:
BIRTHS AND DEATHS
MIGRATORY MOVEMENTS:
EMIGRATION OR IMMIGRATION (UNIT 3)
NATURAL POPULATION MOVEMENT: BIRTHS
- BIRTH RATE/TASA DE NATALIDAD= is the number of births relative to the
population of a place and is expressed in per mille (%o)
- FERTILITY RATE/TASA DE FERTILIDAD= is the number of live births per
women aged 15-49, also expressed in per mille (%o)
- AVERAGE NUMBER OF CHILDREN PER WOMAN/: This number tells us
wheather one generation can be replaced by another. An average of 2.1
children per woman ensures that replacement
NATURAL POPULATION MOVEMENTS: DEATHS
• DEATH RATE/TASA DE MORTALIDAD= is the number of deaths relative
to the population of a place. It is expressed in per mille (%o)
• INFANT MORTALITY RATE/ TASA DE MORTALIDAD INFANITL= relates
the number of babies who died before their first birthday, to live
births in a place. The result is expressed in per mille.
• LIFE EXPECTANCY/ ESPERANZA DE VIDA: it expresses the average age
a person is expected to live, at birth
- NATURAL POPULATION GROWTH: is the difference between the
absolute numbers of births and deaths. It tells us the natural
population growth rate and it is expressed in a percentage.
* If it is positive, the population increases
* If it is negative, the population decreases
* If the birth and death rates are equal, growth is zero
SO… IN YOUR NOTEBOOK
• Put the title: WORLD POPULATION DYNAMICS AND TRENDS
• Copy every single formula from your book (page 12-13)
• Think about: What are the differences about the population dynamics between
rich and por countries?
• Look to the map on page 13 and answer: Why do you think fertility rates are so
high in Africa and so low in many more economically developed regions?
• And now… we will focus on Europe and SPAIN
- Read page 16 and write in your notebook the characteristics of
the european population
- Read page 17 and answer: Why are the populations of many European
countries falling?
POPULATION DYNAMICS IN SPAIN:
TO SUMARISE THIS CONCEPTS… GO TO PAGES
34 AND 35
• What are the key ideas related to BIRTHS in Spain? Make a diagram or
a little mind map to explain the reasons about this sentence:
“ THE NUMBER OF BIRTHS IN SPAIN IS VERY LOW”
• What are the key ideas related to DEATHS in Spain? Make a diagram
or a little mind map to explain them
But the population dynamics on Spain depends on
the different regions, so…
Characteristics of Spanish population
• https://www.youtube.com/watch?v=AHWzl3rVF-8
• https://www.youtube.com/watch?v=K4NfjdhnAdQ&t=40s
RURAL AND URBAN SETTLEMENTS IN SPAIN
READ PAGES 36 AND 37 AND MAKE IN THE NOTEBOOK ACTIVITIES A,
B, C, 1,2,3,4
IMPORTANT PROBLEM TO SOLVE IN SPAIN: THE
DEPOPULATION OF RURAL AREAS
PAGES 38-39
- Why de people leave rural áreas?
- What are the consequences of
Depopulation?
- What solutions are there?
https://www.youtube.com/watch?time_continue=22&v=EJ9RIQgbvjA
https://www.lasexta.com/programas/salvados/noticias/interactivo-este-mapa-espana-deshabitada-
hay-riesgo-que-pueblo-desaparezca_2017030758bebf6c0cf2894da466a6b9.html
DEMOGRAPHIC MODELS
AND PATTERNS
Page14
DEMOGRAPHIC TRANSITION MODEL
https://www.youtube.com/watch?v=XLWVm
QTglqc&t=160s
 OLD DEMOGRAPHIC MODEL
 DEMOGRAPHIC TRANSITION MODEL
 MODERN DEMOGRAPHIC MODEL
Homework: explain the graphic
about the demographic transition
model helping you with the theorie
POPULATION STRUCTURE
BIOLOGICAL STRUUCTURE
Analyses:
• Age: Young (0-14), adult (15-64)
elderly (+65)
• Sex: males/females
- More males in Young
population
- Same amount in adult
population
- More females in the elderly
population
ECONOMIC STRUCTURE
Analyses:
• Population´s level of activity
- active / inactive population
• Economic sectors:
- primary: …
- secondary: …
- tertiary: …
- quaternary:
POPULATION PYRAMIDS pages 9-10-11: is a chart
of the age and sex of a population at a given place
and time
- Read page 9 and make activity 1,2 and 3
HOW TO EXPLAIN A
POPULATION
PYRAMID?
- Triangular-shaped
- Pointed arch
- Urn or bulb
Can you guess if each pyramid correspond to
a developed or a less developed country?
To finish with this part, let´s practice…
• Put the title and make a mind map with the three types of population
pyramids
• Go to pages 10-11 and do activities A, B , C , 2
• The population structure in Spain pages 32 and 33: read these two
parts, make a mind map about Spain and activity 1.
And now, let´s do the Spanish population pyramid
with the data that appears on page 20
MIGRATION PAGES 54-61
https://www.youtube.com/watch?v=GG4zYsV
0ME0
EFFECTS OF MIGRATIONS: read pages 56 and 57 and complete the table
1. Economic:
2. Social:
3. Cultural:
Spanish emigration during 60´s
• https://www.youtube.com/watch?v=AVuTIJg3KtI

Demography

  • 1.
    DEMOGRAPHY “ THE POPULATIONOF THE PLANET” 2º ESO
  • 2.
    WHAT IS DEMOGRAPHY? ISTHE PART OF THE GEOGRAPHY THAT STUDIES THE NUMBER OF INHABITANTS AND THE DYNAMICS AND STRUCTURE OF THE POPULATIONS
  • 3.
    HOW MANY PEOPLEARE THERE IN THE WORLD? 7,7 BILLION http://www.worldometers.info/world-population/ https://www.youtube.com/watch?time_continue=163&v=PUwmA3 Q0_OE
  • 4.
  • 7.
    LOOK AT THEMAP IN YOUR BOOK (page 5) AND WITH A PARTNER TALK ABOUT WHICH AREAS OF TEH WORLD ARE THE MOST DENSELY POPULATED. WHY DO YOU THINK SON MANY PEOPLE LIVE IN THESE AREAS?
  • 8.
    GO TO PAGE6 AND 7 AND… A) SEARCH IN THE MAP THE MOST POPULATED COUNTRIES IN THE WORLD (YOU MUST LIST ALMOST 10 COUNTRIES IN ORDER) B) SEARCH IN THE MAP THE MOST POPULATED CITIES IN THE WORLD (YOU MUST LIST ALMOST 10 CITIES IN ORDER) C) READ THE TEXT AND ANSWER THE QUESTIONS: • WHAT IS HAPPENING TO THE POPULATION IN EUROPE? WHY? • WHAT IS THE NAME FOR THE DOCUMENT THAT COUNTS THE POPULATION ALONG THE DIFFERENT COUNTRIES?
  • 9.
    AND WHAT HAPPENEDWITH SPAIN?
  • 10.
    DISTRIBUTION OF THEPOPULATION IN SPAIN PAGES 30-31 • APART FROM THE COMMUNITY OF MADRID, THE TWO ARCHIPIELAGOS (THE BALEARIC AND CANARY ISLANDS) AND THE TWO AUTONOMOUS CITIES (CEUTA AND MELILLA), THE AREAS WITH THE HIGHEST POPULATION DENSITIES ARE LOCATED AROUND THE COASTS. • GO TO PAGES 30 AND 31 AND MAKE ACTIVIES: A, B, 1, 2.
  • 11.
  • 12.
    GO TO PAGE16 AND READ THE PART OF THE “AMOUNT AND DISTRIBUTION”: - UNDERLINE the key ideas - How is the population in Europe distributed? - Look to the map and write in the notebook the countries with more than 200 inhabitants/km²
  • 13.
    THE UNEVEN DISTRIBUTIONOF POPULATION • VERY LOW POPULATION DENSITY: Below 10 inhabitants/km² • LOW POPULATION DENSITY: Between 10-50 inhab./km² • MODERATE POPULATION DENSITY: between 50-100 inhab./km² • HIGH POPULATION DENSITY: over 100 inhab./km²
  • 18.
    WORLD POPULATION DINAMYCSAND TRENDS pages 12-13 - How do we study population dynamics? The number of people living on a place depends on:  NATURAL POPULATION MOVEMENTS: BIRTHS AND DEATHS MIGRATORY MOVEMENTS: EMIGRATION OR IMMIGRATION (UNIT 3)
  • 19.
    NATURAL POPULATION MOVEMENT:BIRTHS - BIRTH RATE/TASA DE NATALIDAD= is the number of births relative to the population of a place and is expressed in per mille (%o) - FERTILITY RATE/TASA DE FERTILIDAD= is the number of live births per women aged 15-49, also expressed in per mille (%o) - AVERAGE NUMBER OF CHILDREN PER WOMAN/: This number tells us wheather one generation can be replaced by another. An average of 2.1 children per woman ensures that replacement
  • 20.
    NATURAL POPULATION MOVEMENTS:DEATHS • DEATH RATE/TASA DE MORTALIDAD= is the number of deaths relative to the population of a place. It is expressed in per mille (%o) • INFANT MORTALITY RATE/ TASA DE MORTALIDAD INFANITL= relates the number of babies who died before their first birthday, to live births in a place. The result is expressed in per mille. • LIFE EXPECTANCY/ ESPERANZA DE VIDA: it expresses the average age a person is expected to live, at birth
  • 21.
    - NATURAL POPULATIONGROWTH: is the difference between the absolute numbers of births and deaths. It tells us the natural population growth rate and it is expressed in a percentage. * If it is positive, the population increases * If it is negative, the population decreases * If the birth and death rates are equal, growth is zero
  • 22.
    SO… IN YOURNOTEBOOK • Put the title: WORLD POPULATION DYNAMICS AND TRENDS • Copy every single formula from your book (page 12-13) • Think about: What are the differences about the population dynamics between rich and por countries? • Look to the map on page 13 and answer: Why do you think fertility rates are so high in Africa and so low in many more economically developed regions? • And now… we will focus on Europe and SPAIN - Read page 16 and write in your notebook the characteristics of the european population - Read page 17 and answer: Why are the populations of many European countries falling?
  • 23.
  • 27.
    TO SUMARISE THISCONCEPTS… GO TO PAGES 34 AND 35 • What are the key ideas related to BIRTHS in Spain? Make a diagram or a little mind map to explain the reasons about this sentence: “ THE NUMBER OF BIRTHS IN SPAIN IS VERY LOW” • What are the key ideas related to DEATHS in Spain? Make a diagram or a little mind map to explain them
  • 28.
    But the populationdynamics on Spain depends on the different regions, so…
  • 29.
    Characteristics of Spanishpopulation • https://www.youtube.com/watch?v=AHWzl3rVF-8 • https://www.youtube.com/watch?v=K4NfjdhnAdQ&t=40s RURAL AND URBAN SETTLEMENTS IN SPAIN READ PAGES 36 AND 37 AND MAKE IN THE NOTEBOOK ACTIVITIES A, B, C, 1,2,3,4
  • 30.
    IMPORTANT PROBLEM TOSOLVE IN SPAIN: THE DEPOPULATION OF RURAL AREAS PAGES 38-39 - Why de people leave rural áreas? - What are the consequences of Depopulation? - What solutions are there?
  • 31.
  • 32.
    DEMOGRAPHIC MODELS AND PATTERNS Page14 DEMOGRAPHICTRANSITION MODEL https://www.youtube.com/watch?v=XLWVm QTglqc&t=160s  OLD DEMOGRAPHIC MODEL  DEMOGRAPHIC TRANSITION MODEL  MODERN DEMOGRAPHIC MODEL Homework: explain the graphic about the demographic transition model helping you with the theorie
  • 33.
    POPULATION STRUCTURE BIOLOGICAL STRUUCTURE Analyses: •Age: Young (0-14), adult (15-64) elderly (+65) • Sex: males/females - More males in Young population - Same amount in adult population - More females in the elderly population ECONOMIC STRUCTURE Analyses: • Population´s level of activity - active / inactive population • Economic sectors: - primary: … - secondary: … - tertiary: … - quaternary:
  • 34.
    POPULATION PYRAMIDS pages9-10-11: is a chart of the age and sex of a population at a given place and time - Read page 9 and make activity 1,2 and 3
  • 35.
    HOW TO EXPLAINA POPULATION PYRAMID? - Triangular-shaped - Pointed arch - Urn or bulb
  • 37.
    Can you guessif each pyramid correspond to a developed or a less developed country?
  • 38.
    To finish withthis part, let´s practice… • Put the title and make a mind map with the three types of population pyramids • Go to pages 10-11 and do activities A, B , C , 2 • The population structure in Spain pages 32 and 33: read these two parts, make a mind map about Spain and activity 1.
  • 39.
    And now, let´sdo the Spanish population pyramid with the data that appears on page 20
  • 40.
  • 43.
    https://www.youtube.com/watch?v=GG4zYsV 0ME0 EFFECTS OF MIGRATIONS:read pages 56 and 57 and complete the table 1. Economic: 2. Social: 3. Cultural:
  • 44.
    Spanish emigration during60´s • https://www.youtube.com/watch?v=AVuTIJg3KtI