Ecg interpretation
•
2 likes•205 views

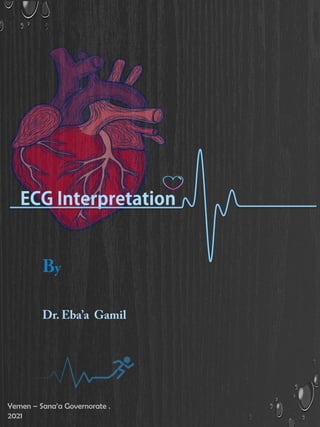
by Dr. Ebaa Gamil ECG interpretation is a vital skill for all medical students and doctors as ECGs are the most commonly used and widely available investigation used to diagnose heart disease.

Recommended
More Related Content
What's hot
What's hot (20)
Similar to Ecg interpretation
Similar to Ecg interpretation (20)
Recently uploaded
Recently uploaded (20)
Ecg interpretation
- 1. Yemen – Sana’a Governorate . 2021
- 2. Copyright © 2021, 2022 by Dr. Eba’a Gamil . This eBook also can be obtained by sending request to Dr.eba’a’s official email at rudus.azeer@yahoo.com
- 4. ECG interpretation is a vital skill for all medical students and doctors as ECGs are the most commonly used and widely available investigation used to diagnose heart disease. The ability to interpret ECGs correctly means that the correct management can be chosen for the patient and avoids otherwise preventable adverse events. Training in ECG interpretation often varies a lot between medical students so I felt that it, for these reasons, was important to produce a guide. To produce a short guide to the interpretation of ECGs (electrocardiograms) aimed at medical students enabling them to: A. determine features of a normal ECG B. assess rate and rhythm C. Identify a clear myocardial infarction To reflect upon what I have learnt from producing this educational material. Both when interpreting ECGs and presenting your findings, it is important to do so in logical and structured manner to avoid misinterpretation. When presenting an ECG, one should first say the patients name, age and the date the recording was done.
- 5. This book contents mainly aimed to out reached the ultimate educational propose and improves the ECG interpolation skills along with avoiding some common misperceptions and mistakes during interacting with ECG reports . I intended to write this book in manner that all health care providers will be able to interact and understand the general concept of this book , The introductory chapters are of mandatory propose to understand the further more details of each chapter , the headlines are intended to be printed on each page along with the sub-headline to simplified the coordination sequence of the topics .
- 10. INDEX • – 1-9 • • • • • – 10-13 • – 14 – 15-21 • – – – • – 22-23 • – 24-31 • • • • • • •
- 11. INDEX • • • • • 32-65 – • – – – – • 66-86 – – – – • • – • 86-203 – • – – • – –
- 13. This page intentionally left blank
- 15. A hollow muscular organ, pyramidal in shape , somewhat larger than a closed fist , consists of four chambers (right and left atria, right and left ventricles) Structure of the Heart The heart is enclosed in a pericardial sac that is lined with the parietal layers of a serous membrane. The visceral layer of the serous membrane forms the pericardium. Layers of the Heart Wall Three layers of tissue form the heart wall: The outer layer of the heart wall is the epicardium . the middle layer is the myocardium . the inner layer is the endocardium . Principles Of Cardiac Anatomy . Figure No ( 1 )
- 16. Chambers of the Heart The internal cavity of the heart is divided into four chambers: The Two Atria: are thin-walled chambers that receive blood from the veins. The Two Ventricles : are thick-walled chambers that forcefully pump blood out of the heart. • Differences in thickness of the heart chamber walls are due to variations in the amount of myocardium present, which reflects the amount of force each chamber is required to generate. The Right Atrium : receives deoxygenated blood from systemic veins . The Left Atrium: receives oxygenated blood from the pulmonary veins. The Heart Principles Of Cardiac Anatomy . Structure of the Heart . Figure No ( 2 )
- 17. Valves Of The Heart : Aortic valve. The aortic valve is located between the left ventricle and the aorta. Mitral valve. This valve is located between the left atrium and the left ventricle. It has only 2 leaflets. Pulmonary valve. The pulmonary valve is located between the right ventricle and the pulmonary artery. Tricuspid valve. This valve is located between the right atrium and the right ventricle. Principles Of Cardiac Anatomy . Structure of the Heart . Figure No ( 3 ) Figure No ( 4 ) Figure No ( 5 )
- 18. Principles Of Cardiac Anatomy . Structure of the Heart . Circulation of blood through the heart . Figure No ( 6 )
- 19. PATHWAY OF BLOOD THROUGH THE HEART Principles Of Cardiac Anatomy . Structure of the Heart . Figure No ( 7 )
- 20. Blood Supply To The Myocardium : The major vessels of the coronary circulation are the Left Main Coronary : that divides into left anterior descending . circumflex branches . Right Main Coronary Artery : The left and right coronary arteries originate at the base of the aorta from openings called the coronary ostia located behind the aortic valve leaflets Principles Of Cardiac Anatomy . Structure of the Heart . Figure No ( 8 ) Figure No ( 9 )
- 21. Nerves To The Heart Include: Vagus nerve Function: reducing the heart rate, reducing the force of contraction of the heart, vasoconstriction of the coronary arteries Parasympathetic Efferent Fibers Cardiac nerves from the lower cervical and upper thoracic ganglia Function: increasing heart rate, increasing the force of contraction of the myocardium Sympathetic Efferent Fibers Vagal cardiac nerves Function: feedback on blood pressure Afferent Parasympathetic Fibers Afferents to upper thoracic and lower cervical ganglia Function: feedback on blood pressure, pain sensation Afferent Sympathetic Fibers Cardiac plexus injury, referred pain Clinical Relations Principles Of Cardiac Anatomy . Structure of the Heart . Innervation Of The Heart : Table No. ( 1 )
- 22. Principles Of Cardiac Anatomy . Structure of the Heart . Innervation Of The Heart : Figure No ( 10 )
- 23. Principles Of Cardiac Anatomy . Structure of the Heart . Figure No ( 11 )
- 24. Conducting System of the Heart : The Cardiac Conduction System Is A Group Of Specialized Cardiac Muscle Cells In The Walls Of The Heart That Send Signals To The Heart Muscle Causing It To Contract Cardiac Muscle Tissue Has Intrinsic Ability To: • Generate and conduct impulses • Signal these cells to contract rhythmically Conducting system : • A series of specialized cardiac muscle cells . • Sino-atrial (SA) node sets the inherent rate of contraction . Conduction System: [ SA AV Bundle Branch / Purkinje fibers.] Anatomy Of Conducting System . Figure No ( 12 )
- 25. Anatomy Of Conducting System . Conducting System of the Heart. Figure No ( 13 )
- 26. Called the pacemaker cell (P cell) Located at the junction of right atrium and superior vena cava, upper part of the sulcus terminalis, under the epicardium . Located in the lower part of inter-atrial septum just above the orifice of coronary sinus, under the endocardium Lower part related to membranous part of inter-ventricular septum Passes forward through right fibrous trigon to reach inferior border of membranous part . Divides into right and left branches at upper border of muscular part of inter-ventricular septum are located in the inner ventricular walls of the heart, just beneath the endocardium in a space called the subendocardium. Anatomy Of Conducting System . Conducting System of the Heart.
- 27. Anatomy Of Conducting System . Conducting System of the Heart. Figure No ( 14 )
- 29. Electrocardiography. Introduction to ECG : An electrocardiogram also termed an ECG or EKG (K means kardia for heart in Greek) or a 12 lead ECG. is a simple non-invasive test that records the heart's electrical activity and the electrical signals that control heart rhythm. The test measures how electrical impulses move through the heart muscle as it contracts and relaxes. Electrocardiogram translates the heart's electrical activity into line tracings on paper. The spikes and dips in the line tracings are called waves. It provides information about the function of the intra-cardiac conducting tissue of the heart and reflects the presence of cardiac disease through its electrical properties. Understanding ECG helps to understand how the heart works. With each heartbeat, an electrical impulse starts from the superior part of the heart to the bottom. The impulse prompts the heart to contract and pumps blood. It was invented by a Dutch physician, William Einthoven in 1902. Figure No ( 15 )
- 30. Parts of an ECG Electrodes and Leads ECG Paper Electrodes and Leads : To measure the heart's electrical activity accurately, proper electrode placement is crucial.in a 12-lead ECG, there are 12 leads calculated using 10 electrodes : Six of the leads are considered ―limb leads‖ because they are placed on the arms and/or legs of the individual. The other six leads are considered ―precordial leads‖ because they are placed on the torso (precordium) . Electrocardiography. ECG Electrode Color Coding : 1. International Electro-technical Commission (IEC) Electrode Color Coding : A. Limb Electrodes : Right arm: red, marked with the letter R. Left arm: yellow, marked with the letter L. Left leg: green, marked with the letter F. Right leg: black, marked with the letter N for neutral. B. Precordial Electrodes : V1: red, marked with letters C1. V2: yellow (C2). V3: green (C3). V4: brown (C4). V5: black (C5). V6: violet (C6).
- 31. Electrocardiography. Parts of an ECG . 2. American Heart Association (AHA) Electrode Color Coding : A. Limb Electrodes: Right arm: white, marked with letters RA. Left arm: black, marked with letters LA. Left leg: red, marked with the letter LL. Right leg: green, marked with the letter RL B. Precordial Electrodes : V1: red, marked with letters V1. V2: yellow (V2). V3: green (V3). V4: blue (V4). V5: orang (V5). V6: purple (V6). Figure No ( 16 )
- 32. Chest (Precordial) Electrodes And Placement : » V1 - Fourth intercostal space on the right sternum . » V2 - Fourth intercostal space at the left sternum . » V3 - Midway between placement of V2 and V4 . » V4 - Fifth intercostal space at the mid-clavicular line . » V5 - Anterior axillary line on the same horizontal level as V4 . » V6 - Mid-axillary line on the same horizontal level as V4 and V5 . Mid-clavicular line Anterior axillary line Mid-axillary line Sternum Manubrium Sternal angel Costal cartilage Costal margin Electrocardiography. Parts of an ECG . Figure No ( 17 )
- 33. Limb (Extremity) Electrodes and Placement : » RA (Right Arm) - Anywhere between the right shoulder and right elbow » RL (Right Leg) - Anywhere below the right torso and above the right ankle » LA(Left Arm) - Anywhere between the left shoulder and the left elbow » LL (Left Leg) - Anywhere below the left torso and above the left ankle Electrocardiography. Parts of an ECG . Figure No ( 18 )
- 34. Figure No ( 19 ) Electrocardiography. Parts of an ECG . The areas of Electrodes represented on the ECG are summarized below : V1, V2 = RV V3, V4 = septum V5, V6 = L side of the heart Lead I = L side of the heart Lead II = inferior territory Lead III = inferior territory aVF = inferior territory (remember ‘F’ for ‘feet’) aVL = L side of the heart aVR = R side of the heart Figure No ( 20 )
- 35. Additional notes on 12-lead ECG Placement: o The limb leads can also be placed on the upper arms and thighs. However, there should be uniformity in your placement. For instance, do not attach an electrode on the right wrist and one on the left upper arm. o For female patients, place leads V3-V6 under the left breast. o Do not use nipples as reference points in placing electrodes for both men and women as nipple locations vary from one person to another. o Always protect the patient‘s privacy and dignity by draping with a sheet to minimize exposure. o Lead placement and patient positioning should be the same for subsequent ECGs on any individual patient. o During the procedure, record any clinical signs (e.g. chest pain) in the notes or on the ECG tracing itself. Electrocardiography. Parts of an ECG .
- 36. ECG Paper : The ECG paper is a strip of graph paper with large and small grids with horizontal axis (Time in seconds) and vertical axis(amplitude in volts). Each 1 mm square (the smallest square) represents 0.04 second and each large square (5 mm) represents 0.20 seconds. On the vertical axis, each large square represents 0.5mV and each small block equals 0.1mV. Electrocardiography. Parts of an ECG . Figure No ( 21 )
- 37. Medical Uses : The overall goal of performing an ECG is to obtain information about the electrical function of the heart. Electrocardiography.
- 40. Normal Components of the ECG . P wave QRS complex T wave ST segment PR interval QT interval U wave Normal Components of the ECG Waveform : Figure No ( 22 )
- 41. The first wave P wave : represents atrial depolarization (ventricular filling) Q wave : representing septal depolarization R wave: representing ventricular depolarization S wave: representing depolarization of the Purkinje fibers QRS complex : is ventricular depolarization T wave : is ventricular repolarization ST segment : is a flat line any change shows myocardial infarction P wave, QRS complex, and T wave show the 3 phase of cardiac cycle in one heart beat. after the PQRST complex a U wave, seen in electrolyte imbalance(potassium) Normal Components of the ECG Waveform . Normal Components of the ECG .
- 42. P wave : • Indicates atrial depolarization, or contraction of the atrium. • Normal duration is not longer than 0.11 seconds (less than 3 small squares) • Amplitude (height) is no more than 3 mm • No notching or peaking QRS complex • Indicates ventricular depolarization, or contraction of the ventricles. • Normally not longer than .10 seconds in duration • Amplitude is not less than 5 mm in lead II or 9 mm in V3 and V4 • R waves are deflected positively and the Q and S waves are negative T wave • Indicates ventricular repolarization • Not more that 5 mm in amplitude in standard leads and 10 mm in precordial leads • Rounded and asymmetrical Normal Components of the ECG Waveform . Normal Components of the ECG .
- 43. ST segment • Indicates early ventricular repolarization • Normally not depressed more than 0.5 mm • May be elevated slightly in some leads (no more than 1 mm) PR interval P wave + PR Segment. • Indicates AV conduction time • Duration time is 0.12 to 0.20 seconds • Duration: 3-5 small squares/120-220 ms Normal Components of the ECG Waveform . Normal Components of the ECG . Figure No ( 23 )
- 44. QT interval • Measured from the Q wave to the end of the T wave . • Represents ventricular depolarization and repolarization (sodium influx and potassium efflux) • V3, V4 or lead II optimize the T-wave. • QT usually less than half the R-R interval • (0.32-0.40 seconds when rate is 65-90/minute) • QT varies with rate. Correct for rate by dividing QT by the square root of the RR interval. o Normal corrected is < 0.46 for women and < 0.45 for men. • Prolonged QT may be inherited or acquired (predisposes to long QT syndrome and torsades de pointe) • Inherited - defective sodium or potassium channels • Acquired - drugs, electrolyte imbalance or MI o Atleast, 50 drugs known to affect QT (including: quinidine, amiodarone and dofetilide) Normal Components of the ECG Waveform . Normal Components of the ECG . Figure No ( 24 )
- 45. Normal Components of the ECG Waveform . Normal Components of the ECG . Figure No ( 25 )
- 46. U wave : • The U wave is a small (0.5 mm) deflection immediately following the T wave • U wave is usually in the same direction as the T wave. • U wave is best seen in leads V2 and V3. Normal Components of the ECG Waveform . Normal Components of the ECG . Figure No ( 26 )
- 47. ST Segment QRS Complex PR Interval P Wave Interval between ventricular depolarization and repolarization Ventricular depolarizatio n atrial depolarization and delay at the AV Node (AV conduction time) Atrial depolarization Represents Measure from end of QRS (J-point) to beginning of T wave 0.06 - 0.11 seconds 0.11 - 0.20 seconds < 0.12 seconds Duration Q- First negative deflection R- First positive deflection S- Negative deflection after R wave Measure start of P wave to start of QRS < 2.5 mm Height In relation to isoelectric line: Depression/Neg ative indicates ischemia Elevation/Positiv e indicates injury Prolonged indicates a conduction block Shortened indicates accelerated conduction or junctional in origin Smooth Shape Positive in Leads I, II, aVF, V4 Negative in aVR Orientation SUMMARY Normal Components of the ECG Waveform . Normal Components of the ECG . Table No. ( 2 )
- 49. 1. Patient Data ID : A. Name B. Age C. Gender D. Date E. Time F. Machine Diagnosis ( not all modalities ) 2. Blood Pressure ( not all modalities ) 3. Parameters Values : A. Standard Calibration And Speed Of Paper B. Heart Rate C. Heart Rhythm D. Electrical Heart Axis 4. 12 lead Waveform Data : • I . II. III • aVR, aVL, and aVF • V1. V2 . V3 . V4 . V5 . V6 Interpretation Of ECG . ECG Paper Data Content
- 50. Patient Data ID : • Patient‘s name, date of birth and hospital number . • Location . • This becomes important as in the ED or acute medical setting doctors are often shown multiple ECGs. You need to know where your patient is in order to ensure that they can be moved to a higher dependency area if appropriate. • When was the ECG done? • The time • The number of the ECG if it is one of a series • If you are concerned that there are dynamic changes in an ECG it is helpful to ask for serial ECGs (usually three ECGs recorded 10 minutes apart) so they can be compared. These should always be labelled 1, 2 and 3. • Did the patient have chest pain at the time? • Or other relevant clinical details. For example, if you are wanted an ECG to look for changes of hyperkalemia, note the patient‘s potassium level on the ECG. ECG paper contents - Patient Data ID . Interpretation Of ECG .
- 51. Figure No ( 27 ) ECG paper contents - Patient Data ID . Interpretation Of ECG .
- 52. ECG paper contents - Patient Data ID . Interpretation Of ECG . Figure No ( 28)
- 53. A. Standard Calibration And Speed Of Paper Standardization: full standard is two large squares (1 mV, 10 mm) and half standard is one large square (0.5mV, 5 mm) Paper speed: The standard paper speed is 25 mm (5 large squares)/sec. This means that if the interval between two beats (R-R) is 5 large squares, the HR is 60 beat/min. Figure No ( 29 ) Figure No ( 30 ) Parameters Values : ECG paper contents - Parameters Values - Standard Calibration And Speed Of Paper . Interpretation Of ECG .
- 54. A. The standard paper speed is 25mm/sec: 1mm (small square) = 0.04 sec (40ms) 5mm (large square) = 0.2 sec (200ms) B. Heart Rate Figure No ( 31 ) ECG paper contents - Parameters Values - Heart Rate . Interpretation Of ECG .
- 55. B. Paper speed: 50mm/sec : 1mm (small square) = 0.02 sec (20ms) 5mm (large square) = 0.1 sec (100ms) ECG paper contents - Parameters Values - Heart Rate . Interpretation Of ECG . Figure No ( 32 )
- 56. HR ( Heart Rate ) • Number of P‘s (atrial) R‘s (ventricular) per minute (6 second [30 squares] X 10 = minute rate). • 1500/No of small squares (or) • 300/No of large squares: The HR may be counted by simply dividing 300 by the number of the large squares between two heart beats (R-R). If the interval between two beats is one large square, the HR is 300 beat/min, 2 squares →150, 3 squares →100, 4 squares → 75, 5 squares → 60, 6 squares → 50 beat/min. ECG paper contents - Parameters Values - Heart Rate . Interpretation Of ECG . Figure No ( 33 )
- 57. Estimate the rate : REGULAR rhythms : Rate = 300 / number of LARGE squares between consecutive R waves. Very FAST rhythms: Rate = 1500 / number of SMALL squares between consecutive R waves. SLOW or IRREGULAR rhythms: Rate = Number of R waves X 6 The number of complexes (count R waves) on the rhythm strip gives the average rate over a ten-second period. This is multiplied by 6 (10 seconds x 6 = 1 minute) to give the average Beats per minute (bpm) ECG paper contents - Parameters Values - Heart Rate . Interpretation Of ECG .
- 58. Estimate the rate : Example of 1500 (small squares) versus 300 (large square) method ECG paper contents - Parameters Values - Heart Rate . Interpretation Of ECG . Figure No ( 34 )
- 59. Estimate the rate : Now adding the R wave (10 second rhythm strip) Note: Calculate atrial and ventricular rates separately if they are different (e.g. complete heart block) . Atrial Rate By ( P ) Wave Ventricular Rate By ( R ) Wave ECG paper contents - Parameters Values - Heart Rate . Interpretation Of ECG . Figure No ( 35 )
- 60. Interpretation (adults) : Normal: 60–100 beats/min Tachycardia: >100 beats/min Bradycardia: <60 beats/min Interpretation ( Children ) : Newborn: 110 – 150 bpm 2 years: 85 – 125 bpm 4 years: 75 – 115 bpm 6 years+: 60 – 100 bpm ECG paper contents - Parameters Values - Heart Rate . Interpretation Of ECG .
- 61. Between R-R ( Must Compare Between 3-4 Cycles) (Big Square) Rhythm = Regular Or Irregular. Map P-P And R-R Intervals. C. Heart Rhythm Rhythm: The cardiac myocytes have an inherent automaticity and can generate an electric impulse. The SA nodal cells have the fastest automaticity (pacemaker) and hence control the heart rate and rhythm. There are 4 levels of conductions and potential pacemakers in the heart from fastest to slowest: SA node → atria → AV node → ventricles. If the rhythm is not sinus, we have to determine the origin of the pacemaker and where the impulse is initiated. ECG paper contents - Parameters Values - Heart Rhythm . Interpretation Of ECG . Figure No ( 36 )
- 62. A. SA nodal rhythm (normal sinus rhythm) : The sinus node is located at the SVC/right atrial junction. Sinus rhythm requires ALL of the following 3 criteria: 1. One P wave preceding each QRS complex 2. All P waves should be uniform in shape 3. Normal P wave axis is in the left lower quadrant (0-90 degrees), i.e. upright in both lead I and aVF (unless there is dextrocardia) The R-R interval in NSR does not have to be identical as it may change with breathing (sinus arrhythmia) The sinus arrhythmia is easier to appreciate with slower heart rates. HR increases during inspiration due to: • Increased venous return • Increased sympathetic tone HR decreases during expiration due to: • Decreased venous return • Increased parasympathetic tone ECG paper contents - Parameters Values - Heart Rhythm . Interpretation Of ECG .
- 63. B. Atrial Rhythm : Characterized by narrow QRS complexes preceded by P waves that do not fulfill one or more of the normal sinus rhythm (NSR) criteria mentioned earlier. If the P wave morphology changes, this may indicate a multifocal origin which is called "wandering pacemaker― C. AV Nodal Or Junctional Rhythm : Characterized by narrow QRS complexes that are not preceded by P waves. An inverted P wave may be seen following the QRS due to retrograde conduction D. Ventricular rhythm : Characterized by wide QRS complexes that are not preceded by P waves. If the sinus node fails to initiate the impulse, an atrial focus will take over as the pacemaker, which is usually slower than the NSR. When the atrial focus fails, the AV node will take over. Subsequently, if the AV node fails, the ventricular focus, which is the slowest, will take over as a pacemaker. Each time the focus is downgraded, the heart rate becomes slower based on the inherent automaticity of the pacemaker. ECG paper contents - Parameters Values - Heart Rhythm . Interpretation Of ECG .
- 64. ECG paper contents - Parameters Values - Heart Rhythm . Interpretation Of ECG . Figure No ( 37 ) Figure No ( 38 ) Figure No ( 39 )
- 65. ECG paper contents - Parameters Values - Heart Rhythm . Interpretation Of ECG . Figure No ( 40 ) Figure No ( 41 )
- 66. ECG Rhythm Evaluation The rhythm is best analyzed by looking at a rhythm strip. On a 12 lead ECG this is usually a 10 second recording from Lead II. 7 step approach to ECG rhythm analysis : 1. Rate • Tachycardia or bradycardia? • Normal rate is 60-100/min. 2. Pattern of QRS complexes • Regular or irregular? • If irregular is it regularly irregular or irregularly irregular? 3. QRS morphology • Narrow complex: sinus, atrial or junctional origin. • Wide complex: ventricular origin, or supraventricular with aberrant conduction. 4. P waves • Absent: sinus arrest, atrial fibrillation • Present: morphology and PR interval may suggest sinus, atrial, junctional or even retrograde from the ventricles. ECG paper contents - Parameters Values - Heart Rhythm . Interpretation Of ECG .
- 67. 5. Relationship between P waves and QRS complexes • AV association (may be difficult to distinguish from isorhythmic dissociation) • complete: atrial and ventricular activity is always independent. • incomplete: intermittent capture. 6. Onset and termination • Abrupt: suggests re-entrant process. • Gradual: suggests increased automaticity. 7. Response to vagal manoeuvres • Sinus tachycardia, ectopic atrial tachydysrhythmia: gradual slowing during the vagal manoeuvre, but resumes on cessation. • AVNRT or AVRT: abrupt termination or no response. • Atrial fibrillation and atrial flutter: gradual slowing during the manoeuvre. • VT: no response. ECG paper contents - Parameters Values - Heart Rhythm . Interpretation Of ECG .
- 68. Differential Diagnosis: Narrow Complex (Supraventricular) Tachycardia . 1. ATRIAL – REGULAR • Sinus tachycardia • Atrial tachycardia • Atrial flutter • Inappropriate sinus tachycardia • Sinus node re-entrant tachycardia 2. ATRIAL – IRREGULAR • Atrial fibrillation • Atrial flutter with variable block • Multifocal atrial tachycardia 3. ATRIOVENTRICULAR • Atrioventricular re-entry tachycardia (AVRT) • AV nodal re-entry tachycardia (AVNRT) • Automatic junctional tachycardia ECG paper contents - Parameters Values - Heart Rhythm . Interpretation Of ECG .
- 69. Broad Complex Tachycardia (BCT) 1. REGULAR BCT • Ventricular tachycardia • Antidromic atrioventricular re-entry tachycardia (AVRT). • Any regular supraventricular tachycardia with aberrant conduction — e.g. due to bundle branch block, rate-related aberrancy. 2. IRREGULAR • Ventricular fibrillation • Polymorphic VT • Torsades de Pointes • AF with Wolff-Parkinson-White syndrome • Any irregular supraventricular tachycardia with aberrant conduction — e.g. due to bundle branch block, rate-related aberrancy. ECG paper contents - Parameters Values - Heart Rhythm . Interpretation Of ECG .
- 70. 2. IRREGULAR : • Bradycardia P Waves Present : I. Every P wave is followed by a QRS complex (= sinus node dysfunction) Sinus bradycardia Sinus node exit block Sinus pause / arrest II. Not every P wave is followed by a QRS complex (= AV node dysfunction) AV block: 2nd degree, Mobitz I (Wenckebach) AV block: 2nd degree, Mobitz II (Hay) AV block: 2nd degree, ―fixed ratio blocks‖ (2:1, 3:1) AV block: 2nd degree, ―high grade AV block‖ AV block: 3rd degree (complete heart block) P Waves Absent : Narrow complex: Junctional escape rhythm Broad complex: Ventricular escape rhythm For escape rhythms to occur there must be a failure of sinus node impulse generation or transmission by the AV node. ECG paper contents - Parameters Values - Heart Rhythm . Interpretation Of ECG .
- 71. Axis Of ECG • Determine both P wave and QRS axes. The net summation of positive and negative deflection is used to determine the axis. Look for two perpendicular leads (usually lead I and aVF) to determine in which quadrant the axis is located. • The axis of the ECG is the major direction of the overall electrical activity of the heart. It can be : Normal (normal axis deviation) leftward (left axis deviation, or LAD) rightward (right axis deviation, or RAD) indeterminate (northwest axis). D. Electrical Heart Axis ECG paper contents - Parameters Values - Heart Axis . Interpretation Of ECG . Figure No ( 42 )
- 72. Method 1 – The Quadrant Method The most efficient way to estimate axis is to look at LEAD I and LEAD aVF. Examine the QRS complex in each lead and determine if it is: Positive Isoelectric (Equiphasic) Negative: As Explained In The Figure ECG paper contents - Parameters Values - Heart Axis . Interpretation Of ECG . Figure No ( 43 ) Figure No ( 45 )
- 73. A positive QRS in Lead I puts the axis in roughly the same direction as lead I. A positive QRS in Lead aVF similarly aligns the axis with lead aVF. Combining both coloured areas – the quadrant of overlap determines the axis. So If Lead I and aVF are both positive, the axis is between 0° and +90° (i.e. normal axis). ECG paper contents - Parameters Values - Heart Axis . Interpretation Of ECG . Figure No ( 46 )
- 74. Method 2: Three Lead Analysis (Lead I, Lead II And Avf) Next we add in Lead II to the analysis of Lead I and aVF A positive QRS in Lead I puts the axis in roughly the same direction as lead I. A positive QRS in Lead II similarly aligns the axis with lead II. We can then combine both coloured areas and the area of overlap determines the axis. So If Lead I and II are both positive, the axis is between -30° and +90° (i.e. normal axis). ECG paper contents - Parameters Values - Heart Axis . Interpretation Of ECG . Figure No ( 47 )
- 75. • The combined evaluation of Lead I, Lead II and aVF – allows rapid and accurate QRS assessment. • The addition of Lead II can help determine pathological LAD from normal axis/physiological LAD ECG paper contents - Parameters Values - Heart Axis . Interpretation Of ECG . Figure No ( 48 )
- 76. Method 3 – The Isoelectric Lead This method allows a more precise estimation of QRS axis, using the axis diagram below. Key Principles : If the QRS is POSITIVE in any given lead, the axis points in roughly the same direction as this lead. If the QRS is NEGATIVE in any given lead, the axis points in roughly the opposite direction to this lead. If the QRS is ISOELECTRIC (equiphasic) in any given lead (positive deflection = negative deflection), the axis is at 90° to this lead ECG paper contents - Parameters Values - Heart Axis . Interpretation Of ECG . Figure No ( 49 )
- 77. Example 1 Answer – Lead I, II, aVF (Three Lead method ) • Lead I = POSITIVE • Lead II = POSITIVE • aVF = POSITIVE • This puts the axis in the quadrant between 0° and +90° – i.e. normal axis Answer – Isoelectric Lead Method • From the diagram above, we can see that aVL is located at -30°. • The QRS axis must be ± 90° from lead aVL, either at +60° or -120° • With leads I (0), II (+60) and aVF (+90) all being positive, we know that the axis must lie somewhere between 0 and +90°. • This puts the QRS axis at +60° – i.e. normal axis ECG paper contents - Parameters Values - Heart Axis . Interpretation Of ECG . Figure No ( 50 )
- 78. Answer – Quadrant Method Lead I = NEGATIVE Lead II = Equiphasic Lead aVF = POSITIVE This puts the axis in the quadrant, between +90° and +180°, i.e. RAD. Answer – Isoelectric Lead Method Lead II (+60°) is the isoelectric lead. The QRS axis must be ± 90° from lead II, at either +150° or -30°. The more rightward-facing leads III (+120°) and aVF (+90°) are positive, while aVL (-30°) is negative. This puts the QRS axis at +150° Example 2 ECG paper contents - Parameters Values - Heart Axis . Interpretation Of ECG . Figure No ( 51 )
- 79. Answer – Quadrant Method • Lead I = POSITIVE • Lead II = Equiphasic • Lead aVF = NEGATIVE • This puts the axis in the quadrant between 0° and -90°, i.e. normal or LAD. • Lead II is neither positive nor negative (isoelectric), indicating physiological LAD Answer – Isoelectric Lead Method • Lead II (+60°) is isoelectric. • The QRS axis must be ± 90° from lead II, at either +150° or -30°. • The more leftward-facing leads I (0°) and aVL (-30°) are positive, while lead III (+120°) is negative. • This confirms that the axis is at -30°. Example 3 ECG paper contents - Parameters Values - Heart Axis . Interpretation Of ECG . Figure No ( 52 )
- 80. Answer – Quadrant Method • Lead I = NEGATIVE • Lead II = NEGATIVE • Lead aVF = NEGATIVE • This puts the axis in the upper right quadrant, between -90° and 180°, i.e. extreme axis deviation. Answer – Isoelectric Lead Method • The most isoelectric lead is aVL (-30°). • The QRS axis must be at ± 90° from aVL at either +60° or -120°. • Lead aVR (-150°) is positive, with lead II (+60°) negative. • This puts the axis at -120°. Example 4 ECG paper contents - Parameters Values - Heart Axis . Interpretation Of ECG . Figure No ( 53 )
- 81. Causes Of Axis Deviation A. Right Axis Deviation Right ventricular hypertrophy Acute right ventricular strain, e.g. due to pulmonary embolism Lateral STEMI Chronic lung disease, e.g. COPD Hyperkalaemia Sodium-channel blockade, e.g. TCA poisoning Wolff-Parkinson-White syndrome Dextrocardia Ventricular ectopy Secundum ASD – rSR‘ pattern Normal paediatric ECG Left posterior fascicular block – diagnosis of exclusion Vertically orientated heart – tall, thin patient ECG paper contents - Parameters Values - Heart Axis . Interpretation Of ECG .
- 82. B. Left Axis Deviation Left ventricular hypertrophy Left bundle branch block Inferior MI Ventricular pacing /ectopy Wolff-Parkinson-White Syndrome Primum ASD – rSR‘ pattern Left anterior fascicular block – diagnosis of exclusion Horizontally orientated heart – short, squat patient C. Extreme Axis Deviation Ventricular rhythms – e.g.VT, AIVR, ventricular ectopy Hyperkalaemia Severe right ventricular hypertrophy ECG paper contents - Parameters Values - Heart Axis . Interpretation Of ECG .
- 84. The ECG is one of the most useful investigations in medicine. Electrodes attached to the chest and/or limbs record small voltage changes as potential difference, which is transposed into a visual tracing Basic landmarks ECG Lead Positioning ECG Lead Positioning. Figure No ( 54 )
- 85. A. 3- Electrode System : Uses 3 electrodes (RA, LA and LL) Monitor displays the bipolar leads (I, II and III) To get best results – Place electrodes on the chest wall equidistant from the heart (rather than the specific limbs) Electrode Systems. ECG Lead Positioning. Figure No ( 55 )
- 86. B. 5- Electrode System : Uses 5 electrodes (RA, RL, LA, LL and Chest) Monitor displays the bipolar leads (I, II and III) AND a single unipolar lead (depending on position of the brown chest lead (positions V1–6)) Electrode Systems. ECG Lead Positioning. Figure No ( 56 )
- 87. D. 12-lead ECG system : 10 electrodes required to produce 12-lead ECG 4 Electrodes on all 4 limbs (RA, LL, LA, RL)6 Electrodes on precordium (V1–6) Monitors 12 leads (V1–6), (I, II, III) and (aVR, aVF, aVL) Allows interpretation of specific areas of the heart Inferior (II, III, aVF)Lateral (I, aVL, V5, V6)Anterior (V1–4) Electrode Systems. ECG Lead Positioning. Figure No ( 57 ) Figure No ( 58 )
- 88. 12-lead Precordial lead placement : as mentioned previously V1: 4th intercostal space (ICS), RIGHT margin of the sternum V2: 4th ICS along the LEFT margin of the sternum V4: 5th ICS, mid-clavicular line V3: midway between V2 and V4 V5: 5th ICS, anterior axillary line (same level as V4) V6: 5th ICS, mid-axillary line (same level as V4) Electrode Systems. ECG Lead Positioning. Figure No ( 59 )
- 89. E. Additional Lead placements 1. Right sided ECG electrode placement ( Dextrocardia ) : There are several approaches to recording a right-sided ECG: A complete set of right-sided leads is obtained by placing leads V1-6 in a mirror-image position on the right side of the chest It can be simpler to leave V1 and V2 in their usual positions and just transfer leads V3-6 to the right side of the chest (i.e. V3R to V6R) The most useful lead is V4R, which is obtained by placing the V4 electrode in the 5th right intercostal space in the mid-clavicular line. ST elevation in V4R has a sensitivity of 88%, specificity of 78% and diagnostic accuracy of 83% in the diagnosis of RV MI. Electrode Systems. ECG Lead Positioning.
- 90. Electrode Systems. ECG Lead Positioning. Figure No ( 60 )
- 91. 2. Posterior leads : Leads V7-9 are placed on the posterior chest wall in the following positions: V7 – Left posterior axillary line, in the same horizontal plane as V6. V8 – Tip of the left scapula, in the same horizontal plane as V6. V9 – Left paraspinal region, in the same horizontal plane as V6. Electrode Systems. ECG Lead Positioning. Figure No ( 61 )
- 92. ECG Artifact: Electrocardiograph (ECG) artifacts are defined as ECG abnormalities, which are a measurement of cardiac potentials on the body surface and are not related to electrical activity of the heart. As a result of artifacts, normal components of the ECG can be distorted. It is very important to recognize these artifacts, otherwise they can lead to unnecessary testing and therapeutic interventions. In this chapter, we will present the common causes and ways to characterize ECG artifacts. Causes of ECG artifact : ECG artifacts can be generated by internal and external causes A. Internal These are physiological causes that could be due to: Patient's motion: Does not allow electronic filtration (large swings, usually by epidermal stretching). • Tremors and shivering cause motion artifacts. • Simple movements such as brushing and combing the hair can produce ECG disturbances during ambulatory ECG monitoring. Muscular activity: Allows electronic filtration (small spikes) ECG Artifact . ECG Lead Positioning.
- 93. B. External These are non-physiological causes associated with other electrical devices attached to or implanted (e.g. deep brain stimulator) in the body and includes the following : Electromagnetic interference: • Power line electrical disturbances/ Light fixtures • Electro-cautery • Electrical devices in the room • Radiofrequency based commercial (e.g. mobile phones) products Cable and electrode malfunction: • Insufficient electrode gel • Misplaced leads • Inappropriate filter settings • Broken wires • Loose connections • Accumulation of static energy Medical equipment's: In operation theatres and intensive care unit various equipment's can affect ECG monitoring system (e.g. electrodes, leads, amplifier, filters) ECG Artifact . ECG Lead Positioning.
- 94. Type of equipment Artifact IVAC intravenous infusion controller Atrial or ventricular extrasystoles, pseudowaves (QRS) Cardiopulmonary bypass pump Uninterpretable tracing, non-specific Pressure-controlled irrigation pump Atrial flutter COBE Prisma System for continuous venovenous hemofiltration Atrial flutter Flexible bronchoscope Atrial fibrillation Deep brain stimulator Uninterpretable tracing Straight shot microdebrider (nasal endoscopy) Ventricular tachycardia Intra-aortic balloon pump Pseudowaves (P), premature atrial contraction Somatosensory evoked potential monitoring units Supraventricular tachycardia High-frequency oscillatory ventilation Atrial flutter, atrial fibrillation, ventricular tachycardia Intraoperative high-field MRI Ventricular tachycardia, ventricular fibrillation, non-specific Transcutaneous electrical nerve stimulator Spikes, runaway pacemaker, ventricular fibrillation, non-specific Peripheral nerve stimulator Spikes, loss of pacemaker spikes Medical equipment related EKG artifacts ECG Artifact . ECG Lead Positioning. Table No. ( 3 - 1)
- 95. Type of equipment Artifact Cardiopulmonary bypass pump Uninterpretable tracing, non-specific COBE Prisma System for continuous venovenous hemofiltration Atrial flutter Deep brain stimulator Uninterpretable tracing Flexible bronchoscope Atrial fibrillation High-frequency oscillatory ventilation Atrial flutter, atrial fibrillation, ventricular tachycardia Intra-aortic balloon pump Pseudowaves (P), premature atrial contraction Intraoperative high-field MRI Ventricular tachycardia, ventricular fibrillation, non-specific IVAC intravenous infusion controller Atrial or ventricular extrasystoles, pseudowaves (QRS) Peripheral nerve stimulator Spikes, loss of pacemaker spikes Pressure-controlled irrigation pump Atrial flutter Somatosensory evoked potential monitoring units Supraventricular tachycardia Straight shot microdebrider (nasal endoscopy) Ventricular tachycardia Transcutaneous electrical nerve stimulator Spikes, runaway pacemaker, ventricular fibrillation, non-specific ECG Artifact . ECG Lead Positioning. Table No. ( 3 – 2 )
- 96. Type of equipment Artifact Straight shot micro-debrider (nasal endoscopy) Ventricular tachycardia Somatosensory evoked potential monitoring units Supraventricular tachycardia Pressure-controlled irrigation pump Atrial flutter Peripheral nerve stimulator Spikes, loss of pacemaker spikes IVAC intravenous infusion controller Atrial or ventricular extrasystoles, pseudowaves (QRS) Intraoperative high-field MRI Ventricular tachycardia, ventricular fibrillation, non-specific Intra-aortic balloon pump Pseudowaves (P), premature atrial contraction High-frequency oscillatory ventilation Atrial flutter, atrial fibrillation, ventricular tachycardia Flexible bronchoscope Atrial fibrillation Deep brain stimulator Uninterpretable tracing ECG Artifact . ECG Lead Positioning. Table No. ( 3 – 3 )
- 97. Differentiating an Artifact from Ventricular tachycardia : Sometimes, ECG changes may mimic specific arrhythmias like ventricular tachycardia and atrial flutter or fibrillation. It is important to differentiate these, as misdiagnosis can lead to inadvertent use of medications and procedures in such a patient . Characteristics that can help in differentiate an artifact from ventricular tachycardia include : Absence of hemodynamic deterioration during the event. Normal QRS complexes within the artifact. An unstable baseline on the ECG before the event, after the event, or both. Association with bodily movement. Presence of any of these signs is suggestive of pseudo-ventricular tachycardia: o "Sinus" sign: One of the frontal leads (I, II and III) may present with sinus rhythm showing normal P, QRS, and T waves. The reason is that one of the upper limbs may be free off tremor. o "Spike" sign: Presence of regular or irregular tiny spikes among wide-QRS complexes. o "Notch" sign: Notches superimposed in the wide-QRS-like complex artifact, coinciding with the cycle length when sinus rhythm was recorded. ECG Artifact . ECG Lead Positioning.
- 98. Electrode misplacement : Electrode misplacements are a common artifact that can mimic life-threatening arrhythmias. Early identification and replacement of electrodes can help in avoiding unnecessary therapies. An algorithm has been described previously , which may help in recognizing these artifacts . ECG findings Explanation R R wave is positive in lead aVR (P wave also positive) Reversal of left arm and right arm electrodes E Extreme axis deviation : QRS axis between -90 and +180 Reversal of left arm and right arm electrodes V Very low (<0.1 mV) voltage in an isolated limb lead Reversal of right leg and left arm or right arm electrodes E Exchanged amplitude of P waves (P wave in lead I > lead II) Reversal of left arm and left leg electrodes R R wave abnormal progression in precordial lead (pre- dominal R in V1 and S in V6) Reversal of precordial electrodes (V1 through V6) S Suspect dextrocardia (negative P waves in lead I) Reversal of left arm and right arm electrodes E Eliminate noise and interference (artifact mimicking tachycardias or ST- T changes ECG Artifact . ECG Lead Positioning. Table No. ( 4 )
- 99. Other Common Artifacts : Electrodes on the torso: Placement of the electrodes on torso may lead to a change in vectors and produce pseudo-Q waves and pseudo-ST segment elevation, mimicking myocardial infarction. Telemetry interference: Superimposition of telemetry electrodes over the ECG electrodes or vice versa may cause ST segment deviation due to electromagnetic interference. Loose wire: Straight line may resemble systole and a wavy line may resemble fibrillation. However, it will be limited to one or two leads only. Tall T wave: A tall T wave may be mistaken for an R wave and the digital heart rate would be higher than the actual pulse rate. Lead placement: Obscuring of P waves may resemble a heart block. Motion artifact: Chest percussions or physiotherapy may mimic ventricular fibrillation. ECG Artifact . ECG Lead Positioning.
- 100. Correction OF ECG Artifact : • Attention to basic principles such as proper electrodes placement and lead connections (as mentioned above) is required during ECG monitoring. • Well designed and maintained ECG measurement devices can withstand routine internal or external electrical and motion-related disturbances. However, it is not always possible to eliminate artifacts completely. • It is essential that physicians keep high vigilance and interpret EKG keeping artifacts in their differential diagnosis list. A slight ECG artifact is not uncommon. However, you can reduce further interference through the following steps: Switch off non-essential electrical devices and equipment within the vicinity if possible. Check for cable loops and avoid running cables adjacent to metallic objects as they can affect the signal. Inspect wires and cables for cracks or breaks. Replace as needed. If possible, use surge suppressors with the power supply. Ensure that filters and preamplifiers are appropriately adjusted. Ensure securely connection between patient cable and the ECG device. Double check for gaps between connectors ECG Artifact . ECG Lead Positioning.
- 101. Examples of Artifacts : Movement artifacts Increasing movement artifacts in a Parkinson patient. ECG Artifact . ECG Lead Positioning. Figure No ( 62 ) Figure No ( 63 )
- 102. Cardio-version from atrial fibrillation to sinus rhythm, with clear baseline drift. Baseline drift. The amplifier in the ECG machine has to re-find the 'mean'. This often occurs right after lead connection and after electric cardio-version. ECG Artifact . ECG Lead Positioning. Figure No ( 64 ) Figure No ( 65 )
- 103. Another example of an artifact caused by an electrical appliance. The patients rhythm is regular. This strip shows 10 QRS complexes. Electrical interference from a nearby electrical appliance. A typical example is a 100 Hz background distortion from fluorescent lights. Not to be confused with atrial fibrillation. ECG Artifact . ECG Lead Positioning. Figure No ( 66 ) Figure No ( 67 )
- 105. A. Waves: 1. P Wave • The P wave is the first positive deflection on the ECG and represents atrial depolarisation • The P wave is the first positive deflection on the ECG • It represents atrial depolarisation-Atrium Depolarization Duration: < 0.12 s (<120ms or 3 small squares) less than 2.5 mm high Normal Vs Abnormal ECG Components . Normal Vs Abnormal ECG Components . Figure No ( 68 )
- 106. Characteristics of the Normal Sinus P Wave : Morphology : Smooth contour Monophasic in lead II Biphasic in V1 Axis : Normal P wave axis is between 0 and +75 P waves should be upright in leads I and II, inverted in aVR Duration : < 0.12 s (<120ms or 3 small squares) Amplitude : < 2.5 mm (0.25mV) in the limb leads < 1.5 mm (0.15mV) in the precordial leads Atrial abnormalities are most easily seen in the inferior leads (II, III and aVF) and lead V1, as the P waves are most prominent in these leads Waves : P Normal Vs Abnormal ECG Components . Normal Figure No ( 69 )
- 107. Normal P-wave Morphology – Lead II : • The right atrial depolarisation wave (brown) precedes that of the left atrium (blue). • The combined depolarisation wave, the P wave, is less than 120 ms wide and less than 2.5 mm high Normal P-wave Morphology – Lead V1 The P wave is typically biphasic in V1, with similar sizes of the positive and negative deflections Waves : P Normal Vs Abnormal ECG Components . Normal Figure No ( 70 )
- 108. Right Atrial Enlargement – Lead V1 Right atrial enlargement causes increased height (> 1.5mm) in V1 of the initial positive deflection of the P wave. Left Atrial Enlargement – Lead V1 Left atrial enlargement causes widening (> 40ms wide) and deepening (> 1mm deep) in V1 of the terminal negative portion of the P wave. Waves : P - Abnormalities of the P wave . Normal Vs Abnormal ECG Components . Abnormal Figure No ( 71 ) Figure No ( 72 ) Figure No ( 73 )
- 109. Right Atrial Enlargement – Lead II In right atrial enlargement, right atrial depolarisation lasts longer than normal and its waveform extends to the end of left atrial depolarisation. Although the amplitude of the right atrial depolarisation current remains unchanged, its peak now falls on top of that of the left atrial depolarisation wave. The combination of these two waveforms produces a P waves that is taller than normal (> 2.5 mm), although the width remains unchanged (< 120 ms). Lead II Lead V1 Waves : P - Abnormalities of the P wave . Normal Vs Abnormal ECG Components . Abnormal Figure No ( 74 )
- 110. Left Atrial Enlargement – Lead II In left atrial enlargement, left atrial depolarisation lasts longer than normal but its amplitude remains unchanged. Therefore, the height of the resultant P wave remains within normal limits but its duration is longer than 120 ms. A notch (broken line) near its peak may or may not be present (‗P mitrale‘) Lead II Lead V1 Waves : P - Abnormalities of the P wave . Normal Vs Abnormal ECG Components . Abnormal Figure No ( 75 ) Figure No ( 76 )
- 111. Biatrial Enlargement Biatrial enlargement is diagnosed when criteria for both right and left atrial enlargement are present on the same ECG. The spectrum of P-wave changes in leads II and V1 with right, left and bi-atrial enlargement is summarised in the following diagram: Waves : P - Abnormalities of the P wave . Normal Vs Abnormal ECG Components . Abnormal Figure No ( 77 )
- 112. Common P Wave Abnormalities P mitrale (bifid P waves), seen with left atrial enlargement. P pulmonale (peaked P waves), seen with right atrial enlargement. P wave inversion, seen with ectopic atrial and junctional rhythms. Variable P wave morphology, seen in multifocal atrial rhythms. 1. P Mitrale The presence of broad, notched (bifid) P waves in lead II is a sign of left atrial enlargement, classically due to mitral stenosis. 2. P Pulmonale The presence of tall, peaked P waves in lead II is a sign of right atrial enlargement, usually due to pulmonary hypertension (e.g. cor pulmonale from chronic respiratory disease). Waves : P - Abnormalities of the P wave . Normal Vs Abnormal ECG Components . Abnormal Figure No ( 78 ) Figure No ( 79 )
- 113. 3. Inverted P Waves P-wave inversion in the inferior leads indicates a non-sinus origin of the P waves. When the PR interval is < 120 ms, the origin is in the AV junction (e.g. accelerated junctional rhythm): 4. Variable P-Wave Morphology The presence of multiple P wave morphologies indicates multiple ectopic pacemakers within the atria and/or AV junction. If ≥ 3 different P wave morphologies are seen, then multifocal atrial rhythm is diagnosed: If ≥ 3 different P wave morphologies are seen and the rate is ≥ 100, then multifocal atrial tachycardia (MAT) is diagnosed: Waves : P - Abnormalities of the P wave . Normal Vs Abnormal ECG Components . Abnormal Figure No ( 80 ) Figure No ( 81 ) Figure No ( 82 )
- 114. Q Wave
- 115. A Q wave is any negative deflection that precedes an R wave The Q wave represents the normal left-to-right depolarisation of the inter- ventricular septum. Small ―septal‖ Q waves are typically seen in the left-sided leads (I, aVL, V5 and V6) . Q waves in different leads : • Small Q waves are normal in most leads . • Deeper Q waves (>2 mm) may be seen in leads III and aVR as a normal variant • Under normal circumstances, Q waves are not seen in the right-sided leads (V1-3) A. Waves: 2. Q Wave Waves : Q Normal Vs Abnormal ECG Components . Normal Figure No ( 83 )
- 116. Pathological Q Waves : Q waves are considered pathological if: > 40 ms (1 mm) wide > 2 mm deep > 25% of depth of QRS complex Seen in leads V1-3 Pathological Q waves usually indicate current or prior myocardial infarction. Loss Of Normal Q Waves : The absence of small septal Q waves in leads V5-6 should be considered abnormal. Absent Q waves in V5-6 is most commonly due to LBBB. Differential Diagnosis : Myocardial infarction Cardiomyopathies — Hypertrophic (HCM), infiltrative myocardial disease Rotation of the heart — Extreme clockwise or counter-clockwise rotation Lead placement errors — e.g. upper limb leads placed on lower limbs Waves : Q - Abnormalities of the Q wave . Normal Vs Abnormal ECG Components . Abnormal
- 117. Inferior Q waves (II, III, aVF) with ST elevation due to acute MI Inferior Q waves (II, III, aVF) with T-wave inversion due to previous MI Example 1 Example 2 Waves : Q - Abnormalities of the Q wave . Normal Vs Abnormal ECG Components . Abnormal Figure No ( 84 ) Figure No ( 85 )
- 118. Lateral Q waves (I, aVL) with ST elevation due to acute MI Anterior Q waves (V1-4) with ST elevation due to acute MI Example 3 Example 4 Waves : Q - Abnormalities of the Q wave . Normal Vs Abnormal ECG Components . Abnormal Figure No ( 87 ) Figure No ( 86 )
- 119. Anterior Q waves (V1-4) with T-wave inversion due to recent MI Example 5 Waves : Q - Abnormalities of the Q wave . Normal Vs Abnormal ECG Components . Abnormal Figure No ( 88 )
- 120. U Wave
- 121. The U wave is a small (0.5 mm) deflection immediately following the T wave . It comes after the T wave of ventricular repolarization and may not always be observed as a result of its small size. U wave is usually in the same direction as the T wave. U wave is best seen in leads V2 and V3 . The normal U wave is best seen at rest in the precordial leads and is more commonly seen during sinus bradycardia. A. Waves: 3. U Wave Waves : U Normal Vs Abnormal ECG Components . Normal Figure No ( 89 ) Figure No ( 90 )
- 122. Source of the U wave : The source of the U wave is unknown. Three common theories regarding its origin are: 1. Delayed repolarisation of Purkinje fibres 2. Prolonged repolarisation of mid-myocardial ‗M-cells‘ 3. After-potentials resulting from mechanical forces in the ventricular wall Features of Normal U waves : The U wave normally goes in the same direction as the T wave U -wave size is inversely proportional to heart rate: the U wave grows bigger as the heart rate slows down U waves generally become visible when the heart rate falls below 65 bpm The voltage of the U wave is normally < 25% of the T-wave voltage: disproportionally large U waves are abnormal Maximum normal amplitude of the U wave is 1-2 mm Waves : U Normal Vs Abnormal ECG Components . Normal Figure No ( 91 )
- 123. Abnormalities of the U wave : A. Prominent U waves B. Inverted U waves Prominent U waves Inverted U waves Normal physiological U waves Waves : U - Abnormalities of the U wave . Normal Vs Abnormal ECG Components . Abnormal Figure No ( 92 ) Figure No ( 93 ) Figure No ( 94 )
- 124. A. Prominent U waves U waves are described as prominent if they are >1-2mm or 25% of the height of the T wave. Prominent U waves may be present with: Hypocalcaemia Hypomagnesaemia Hypothermia Raised intracranial pressure Left ventricular hypertrophy Hypertrophic cardiomyopathy Drugs associated with prominent U waves: • Digoxin • Phenothiazines (thioridazine) • Class Ia antiarrhythmics (quinidine, procainamide) • Class III antiarrhythmics (sotalol, amiodarone) **Note : many of the conditions causing prominent U waves will also cause a long QT. Waves : U - Abnormalities of the U wave . Normal Vs Abnormal ECG Components . Abnormal Figure No ( 95 )
- 125. Prominent U waves due to sinus bradycardia U waves associated with hypokalemia A. Prominent U waves ( Examples ) Example 1 Example 2 Waves : U - Abnormalities of the U wave . Normal Vs Abnormal ECG Components . Abnormal Figure No ( 96 ) Figure No ( 97 )
- 126. U waves associated with left ventricular hypertrophy U waves associated with digoxin use Example 3 Example 4 Waves : U - Abnormalities of the U wave . Normal Vs Abnormal ECG Components . Abnormal Figure No ( 98 ) Figure No ( 99 )
- 127. U waves associated with quinidine use Example 5 Waves : U - Abnormalities of the U wave . Normal Vs Abnormal ECG Components . Abnormal Figure No ( 100 )
- 128. B. Inverted U waves • U-wave inversion is abnormal (in leads with upright T waves) • A negative U wave is highly specific for the presence of heart disease Common causes of inverted U waves : Coronary artery disease Hypertension Valvular heart disease Congenital heart disease Cardiomyopathy Hyperthyroidism Waves : U - Abnormalities of the U wave . Normal Vs Abnormal ECG Components . Abnormal
- 129. Unstable Angina Inverted U Waves In Prinzmetal Angina B. Inverted U waves ( Examples ) Example 1 Example 2 Waves : U - Abnormalities of the U wave . Normal Vs Abnormal ECG Components . Abnormal Figure No ( 101 ) Figure No ( 102 )
- 130. R Wave
- 131. A. Waves: 4. R Wave The R wave is the first upward deflection after the P wave. The R wave represents early ventricular depolarisation . R-wave amplitude in V6 + S-wave amplitude in V1 should be <35 mm. R-wave amplitude in aVL should be ≤ 12 mm. R-wave amplitude in leads I, II and III should all be ≤ 20 mm. If R-wave in V1 is larger than S-wave in V1, the R-wave should be <5 mm Waves : R Normal Vs Abnormal ECG Components . Normal Figure No ( 103 )
- 132. Abnormalities of the R wave There are three key R wave abnormalities: A. Dominant R wave in V1 B. Dominant R wave in aVR C. Poor R wave progression Waves : R - Abnormalities of the R wave . Normal Vs Abnormal ECG Components . Abnormal
- 133. A. Dominant R wave in V1 : Causes of Dominant R wave in V1 Normal in children and young adults Right Ventricular Hypertrophy (RVH) Pulmonary Embolus Persistence of infantile pattern Left to right shunt Right Bundle Branch Block (RBBB) Posterior Myocardial Infarction (ST elevation in Leads V7, V8, V9) Wolff-Parkinson-White (WPW) Type A Incorrect lead placement (e.g. V1 and V3 reversed) Dextrocardia Hypertrophic cardiomyopathy Dystrophies : • Myotonic dystrophy • Duchenne Muscular dystrophy Waves : R - Abnormalities of the R wave . Normal Vs Abnormal ECG Components . Abnormal
- 134. Dominant R wave in V1 : ( Examples ) Normal paediatric ECG (2 yr old) Right Bundle Branch Block Right Ventricular Hypertrophy (RVH) Waves : R - Abnormalities of the R wave . Normal Vs Abnormal ECG Components . Abnormal Figure No ( 104 ) Figure No ( 105 ) Figure No ( 106 )
- 135. Right Bundle Branch Block MoRRoW Posterior MI Wolff-Parkinson-White (WPW) Type A Waves : R - Abnormalities of the R wave . Normal Vs Abnormal ECG Components . Abnormal Figure No ( 107 ) Figure No ( 108 ) Figure No ( 109 )
- 136. Leads V1 and V3 reversed **Note : biphasic P wave (typically seen in only in V1) in lead ―V3‖ Muscular dystrophy Waves : R - Abnormalities of the R wave . Normal Vs Abnormal ECG Components . Abnormal Figure No ( 110 ) Figure No ( 111 )
- 137. B. Dominant R wave in aVR : Poisoning With Sodium-channel Blocking Drugs (E.G. Tcas) Dextrocardia Incorrect Lead Placement (Left/Right Arm Leads Reversed) Commonly Elevated In Ventricular Tachycardia (VT) Dominant R wave in aVR : ( Examples ) Poisoning With Sodium-channel Blocking Drugs : • Causes a characteristic dominant terminal R wave in aVR • Poisoning with sodium-channel blocking agents is suggested if: R wave height > 3mm R/S ratio > 0.7 Waves : R - Abnormalities of the R wave . Normal Vs Abnormal ECG Components . Abnormal Figure No ( 112 )
- 138. Dextrocardia : This ECG shows all the classic features of dextrocardia: Positive QRS complexes (with upright P and T waves) in aVR Negative QRS complexes (with inverted P and T waves) in lead I Marked right axis deviation Absent R-wave progression in the chest leads (dominant S waves throughout) Waves : R - Abnormalities of the R wave . Normal Vs Abnormal ECG Components . Abnormal Figure No ( 113 )
- 139. Left Arm/Right Arm Lead Reversal The most common cause of a dominant R wave in aVR is incorrect limb lead placement, with reversal of the left and right arm electrodes. This produces a similar pattern to dextrocardia in the limb leads but with normal R-wave progression in the chest leads. With LA/RA lead reversal: Lead I becomes inverted Leads aVR and aVL switch places Leads II and III switch places Waves : R - Abnormalities of the R wave . Normal Vs Abnormal ECG Components . Abnormal Figure No ( 114 )
- 140. Ventricular Tachycardia Waves : R - Abnormalities of the R wave . Normal Vs Abnormal ECG Components . Abnormal Figure No ( 115 )
- 141. C. Poor R wave progression : Poor R wave progression is described with an R wave ≤ 3 mm inV3 and is caused by: Prior anteroseptal MI LVH Inaccurate lead placement May be a normal variant ***Note that absent R wave progression is characteristically seen in dextrocardia (see previous ECGs). Waves : R - Abnormalities of the R wave . Normal Vs Abnormal ECG Components . Abnormal Figure No ( 116 )
- 142. Osborn (J Wave )
- 143. J Point In : a normal . b – c J point elevation. d J point depression. e with J wave (Osborn wave) A. Waves: 5. Osborn (J Wave ) : The Osborn wave (J wave) is a positive deflection at the J point (negative in aVR and V1). It is usually most prominent in the precordial leads. Waves : Osborn (J Wave ) . Normal Vs Abnormal ECG Components . Normal Figure No ( 117 )
- 144. Osborn Wave Causes : Characteristically seen in hypothermia (typically T<30C), but they are not pathognomonic. J waves may be seen in a number of other conditions: Normal variant Hypercalcaemia Medications Neurological insults such as intracranial hypertension, severe head injury and subarachnoid haemorrhage Le syndrome d‖Haïssaguerre (idiopathic VF) Waves : Osborn ( J ) Wave - Abnormalities of the Osborn (J) Wave . Normal Vs Abnormal ECG Components . Abnormal
- 145. Osborn Wave ECG : ( examples ) Example 1 Subtle J waves in mild hypothermia [Temp: 32.5°C (90.5°F)] The height of the J wave is roughly proportional to the degree of hypothermia Example 2 J waves in moderate hypothermia. [Temp: 30°C (86°F) Waves : Osborn ( J ) Wave - Abnormalities of the Osborn (J) Wave . Normal Vs Abnormal ECG Components . Abnormal Figure No ( 118 ) Figure No ( 119 )
- 146. Example 3 J waves in moderate hypothermia. [Temp: 28°C (82.4°F)] Example 4 Marked J waves in severe hypothermia [Temp: 26°C (78.8°F)] Waves : Osborn ( J ) Wave - Abnormalities of the Osborn (J) Wave . Normal Vs Abnormal ECG Components . Abnormal Figure No ( 120 ) Figure No ( 121 )
- 147. T Wave
- 148. A. Waves: 6. T Wave The T wave is the positive deflection after each QRS complex.It represents ventricular repolarisation. Characteristics of the normal T wave : Upright in all leads except aVR and V1 Amplitude < 5mm in limb leads, < 10mm in precordial leads (10mm in men, 8mm in women) Duration 0.10 to 0.25 seconds T wave abnormalities : 1. Peaked T waves 2. Hyperacute T waves 3. Inverted T waves 4. Biphasic T waves 5. ―Camel Hump‖ T waves 6. Flattened T waves Waves : T . Normal Vs Abnormal ECG Components . Normal Figure No ( 122 )
- 149. 1. Peaked T waves Tall, narrow, symmetrically peaked T-waves are characteristically seen in hyperkalemia. 2. Hyper-acute T waves Broad, asymmetrically peaked or ―hyper-acute‖ T-waves are seen in the early stages of ST-elevation MI (STEMI) and often precede the appearance of ST elevation and Q waves. They are also seen with Prinzmetal angina. T Wave Abnormalities : Waves : T - Abnormalities of the T Wave . Normal Vs Abnormal ECG Components . Abnormal Figure No ( 123 ) Figure No ( 124 )
- 150. 3. Inverted T waves P-wave inversion in the inferior leads indicates a non-sinus origin of the P waves. When the PR interval is < 120 ms, the origin is in the AV junction (e.g. accelerated junctional rhythm). Inverted T waves are seen in the following conditions: Normal finding in children Persistent juvenile T wave pattern Myocardial ischaemia and infarction Bundle branch block Ventricular hypertrophy (―strain‖ patterns) Pulmonary embolism Hypertrophic cardiomyopathy Raised intracranial pressure **Note : T wave inversion in lead III is a normal variant. New T-wave inversion (compared with prior ECGs) is always abnormal. Pathological T wave inversion is usually symmetrical and deep (>3mm). Waves : T - Abnormalities of the T Wave . Normal Vs Abnormal ECG Components . Abnormal Figure No ( 125 )
- 151. Pediatric T Waves : Inverted T-waves in the right precordial leads (V1-3) are a normal finding in children, representing the dominance of right ventricular forces. Pediatric T Waves Normal T Waves 2 Year Old Boy Persistent Juvenile T-wave Pattern : T-wave inversions in the right precordial leads may persist into adulthood and are most commonly seen in young Afro-Caribbean women. Persistent juvenile T-waves are asymmetric, shallow (<3mm) and usually limited to leads V1-3. Inverted T Waves Conditions : Waves : T - Abnormalities of the T Wave . Normal Vs Abnormal ECG Components . Abnormal Figure No ( 126 ) Figure No ( 127 )
- 152. Myocardial Ischemia and Infarction : T-wave inversions due to myocardial ischemia or infarction occur in contiguous leads based on the anatomical location of the area of ischemia /infarction: Inferior = II, III, aVF Lateral = I, aVL, V5-6 Anterior = V2-6 Inferior T Wave Inversion Due To Acute Ischaemia **NOTE : • Dynamic T-wave inversions are seen with acute myocardial ischemia. • Fixed T-wave inversions are seen following infarction, usually in association with pathological Q waves. Waves : T - Abnormalities of the T Wave . Normal Vs Abnormal ECG Components . Abnormal Figure No ( 128 )
- 153. Inferior T Wave Inversion With Q Waves – Prior Myocardial Infarction T Wave Inversion In The Lateral Leads Due To Acute Ischemia Anterior T Wave Inversion With Q Waves Due To Recent MI Waves : T - Abnormalities of the T Wave . Normal Vs Abnormal ECG Components . Abnormal Figure No ( 129 ) Figure No ( 130 ) Figure No ( 131 )
- 154. Bundle Branch Block : A. Left Bundle Branch Block (with T-wave inversion ) Left bundle branch block produces T-wave inversion in the lateral leads I, aVL and V5-6. B. Right Bundle Branch Block (with T-wave inversion ) Right bundle branch block produces T-wave inversion in the right precordial leads V1-3. Waves : T - Abnormalities of the T Wave . Normal Vs Abnormal ECG Components . Abnormal Figure No ( 132 ) Figure No ( 133 )
- 155. Ventricular Hypertrophy : A. Left Ventricular Hypertrophy (With T-wave Inversion ) Left ventricular hypertrophy (LVH) produces T-wave inversion in the lateral leads I, aVL, V5-6 (left ventricular ―strain‖ pattern), with a similar morphology to that seen in LBBB. B. Right Ventricular Hypertrophy (With T-wave Inversion ) Right ventricular hypertrophy produces T-wave inversion in the right precordial leads V1-3 (right ventricular ―strain‖ pattern) and also the inferior leads (II, III, aVF). Waves : T - Abnormalities of the T Wave . Normal Vs Abnormal ECG Components . Abnormal Figure No ( 134 ) Figure No ( 135 )
- 156. Pulmonary Embolism : T-wave inversions in the right precordial (V1-3) and inferior (II, III, aVF) leads. Hypertrophic Cardiomyopathy (HCM) : Hypertrophic Cardiomyopathy is associated with deep T wave inversions in all the precordial leads. Waves : T - Abnormalities of the T Wave . Normal Vs Abnormal ECG Components . Abnormal Figure No ( 136 ) Figure No ( 137 )
- 157. Raised intracranial pressure (ICP) : Events causing a sudden rise in intracranial pressure (e.g. subarachnoid hemorrhage) produce widespread deep T-wave inversions with a bizarre morphology. Waves : T - Abnormalities of the T Wave . Normal Vs Abnormal ECG Components . Abnormal Figure No ( 138 )
- 158. 4. Biphasic T waves There are two main causes of biphasic T waves: Myocardial ischemia T waves go UP then DOWN Hypokalemia The two waves go in opposite directions: T waves go DOWN then UP Waves : T - Abnormalities of the T Wave . Normal Vs Abnormal ECG Components . Abnormal Figure No ( 139 ) Figure No ( 140 ) Figure No ( 141 )
- 159. 5. ‘Camel hump’ T waves ‗Camel hump‖ T waves is a term used by Amal Mattu to describe T-waves that have a double peak. There are two causes for camel hump T waves: Prominent U waves: Fused To The End Of The T Wave, As Seen In Severe Hypokalemia . Hidden P waves : Embedded In The T Wave, As Seen In Sinus Tachycardia And Various Types Of Heart Block . Waves : T - Abnormalities of the T Wave . Normal Vs Abnormal ECG Components . Abnormal Figure No ( 142 ) Figure No ( 143 )
- 160. 6. Flattened T waves Flattened T waves are a non-specific finding, but may represent : Ischemia (If Dynamic Or In Contiguous Leads) Or Electrolyte Abnormality, E.G. Hypokalemia (If Generalized). Ischemia : Dynamic T-wave flattening due to anterior ischemia . T waves return to normal once the ischemia resolves . Dynamic T wave flattening due to anterior ischemia T waves return to normal as ischemia resolves Waves : T - Abnormalities of the T Wave . Normal Vs Abnormal ECG Components . Abnormal Figure No ( 144 ) Figure No ( 145 )
- 161. Hypokalemia : Note generalized T-wave flattening in hypokalemia associated with prominent U waves in the anterior leads (V2 and V3). Waves : T - Abnormalities of the T Wave . Normal Vs Abnormal ECG Components . Abnormal Figure No ( 146 )
- 162. Epsilon Wave
- 163. A. Waves: 7. Epsilon Wave • The epsilon wave is a small positive deflection (―blip‖ or ―wiggle‖) buried in the end of the QRS complex. Epsilon waves are caused by postexcitation of the myocytes in the right ventricle. Waves : Epsilon Wave - Abnormalities of the Epsilon Wave . Normal Vs Abnormal ECG Components . Abnormal Figure No ( 147 ) Figure No ( 148 )
- 164. Epsilon waves are the most characteristic finding in : Arrhythmo-genic Right Ventricular Dysplasia (ARVD/C). Here myocytes are replaced with fat, producing islands of viable myocytes in a sea of fat. This causes a delay in excitation of some of the myocytes of the right ventricle and causes the little wiggles seen during the ST segment of the ECG. The ECG changes in Arrhythmo-genic Right Ventricular Dysplasia include: • Epsilon wave (most specific finding, seen in 30% of patients) • T wave inversions in V1-3 (85% of patients) • Prolonged S-wave upstroke of 55ms in V1-3 (95% of patients) • Localized QRS widening of 110ms in V1-3 • Paroxysmal episodes of ventricular tachycardia with a LBBB morphology. Waves : Epsilon Wave - Abnormalities of the Epsilon Wave . Normal Vs Abnormal ECG Components . Abnormal Figure No ( 149 )
- 165. Example 1 12-lead ECG is a typical example of ARVD. Arrhythmo-genic Right Ventricular Dysplasia (ARVD) : Examples Example 2 VT with LBBB morphology due to ARVD Waves : Epsilon Wave - Abnormalities of the Epsilon Wave . Normal Vs Abnormal ECG Components . Abnormal Figure No ( 150 ) Figure No ( 151 )
- 166. Delta Wave
- 167. A. Waves: 8. Delta Wave The Delta wave is a slurred upstroke in the QRS complex often associated with a short PR interval. It is most commonly associated with pre-excitation syndrome such as Wolff-Parkinson-White syndrome ( WPW ) . The characteristic ECG findings in the Wolff-Parkinson-White syndrome are: Short PR interval (< 120ms) Broad QRS (> 100ms) A slurred upstroke to the QRS complex (the delta wave) Waves : Delta Wave - Abnormalities of the Delta Wave . Normal Vs Abnormal ECG Components . Abnormal Figure No ( 152 )
- 168. S-T Segment
- 169. B. Segments : 1. ST Segment The ST segment is the flat, isoelectric section of the ECG between the end of the S wave (the J point) and the beginning of the T wave. The ST Segment represents the interval between ventricular depolarization and repolarization. The most important cause of ST segment abnormality (elevation or depression) is myocardial ischemia or infarction. S e gmen ts : ST Segment . Normal Vs Abnormal ECG Components . Normal Figure No ( 153 )
- 170. Causes of ST Segment Elevation : Acute myocardial infarction Coronary vasospasm (Printzmetal‖s angina) Pericarditis Benign early repolarization Left bundle branch block Left ventricular hypertrophy Ventricular aneurysm Brugada syndrome Ventricular paced rhythm Raised intracranial pressure Takotsubo Cardiomyopathy S e gmen ts : ST Segment - Abnormalities of the ST Segment - ST Elevation . Normal Vs Abnormal ECG Components . Abnormal
- 171. Acute ST Elevation Myocardial Infarction (STEMI) : ST segment elevation and Q-wave formation in contiguous leads • Septal (V1-2) • Anterior (V3-4) • Lateral (I + aVL, V5-6) • Inferior (II, III, aVF) • Right ventricular (V1, V4R) • Posterior (V7-9) S e gmen ts : ST Segment - Abnormalities of the ST Segment - ST Elevation . Normal Vs Abnormal ECG Components . Abnormal Figure No ( 154 )
- 172. Pericarditis : Acute Pericarditis causes widespread concave (‗saddleback‘) ST segment elevation with PR segment depression in multiple leads, typically involving I, II, III, aVF, aVL, and V2-6. Concave ‗saddleback‘ ST elevation in leads I, II, III, aVF, V5-6 with depressed PR segments. There is reciprocal ST depression and PR elevation in leads aVR and V1. Spodick‖s sign was first described by David H. Spodick in 1974 as a downward sloping TP segment with specificity for acute pericarditis S e gmen ts : ST Segment - Abnormalities of the ST Segment - ST Elevation . Normal Vs Abnormal ECG Components . Abnormal Figure No ( 155 )
- 173. Benign Early Repolarization : Benign Early Repolarization (BER) causes mild ST elevation with tall T- waves mainly in the precordial leads. BER is a normal variant commonly seen in young, healthy patients. There is often notching of the J-point — the ‗fish- hook‘ pattern. The ST changes may be more prominent at slower heart rates and disappear in the presence of tachycardia. There is slight concave ST elevation in the precordial and inferior leads with notching of the J-point (the ―fish-hook‖ pattern) S e gmen ts : ST Segment - Abnormalities of the ST Segment - ST Elevation . Normal Vs Abnormal ECG Components . Abnormal Figure No ( 156 )
- 174. Left Bundle Branch Block (LBBB) : In Left bundle branch block (LBBB), the ST segments and T waves show ‗appropriate discordance‘ — i.e. they are directed opposite to the main vector of the QRS complex. This produces ST elevation and upright T waves in leads with a negative QRS complex (dominant S wave), while producing ST depression and T wave inversion in leads with a positive QRS complex (dominant R wave). Note : the ST elevation in leads with deep S waves — most apparent in V1-3. Also note the ST depression in leads with tall R waves — most apparent in I and aVL S e gmen ts : ST Segment - Abnormalities of the ST Segment - ST Elevation . Normal Vs Abnormal ECG Components . Abnormal Figure No ( 157 )
- 175. Left Ventricular Hypertrophy (LVH) : Left Ventricular Hypertrophy (LVH) causes a similar pattern of repolarization abnormalities as LBBB, with ST elevation in the leads with deep S-waves (usually V1-3) and ST depression/T-wave inversion in the leads with tall R waves (I, aVL, V5-6). • Deep S waves with ST elevation in V1-3 • ST depression and T-wave inversion in the lateral leads V5-6 • Note in this this case there is also right axis deviation, which is unusual for LVH and may be due to associated left posterior fascicular block. S e gmen ts : ST Segment - Abnormalities of the ST Segment - ST Elevation . Normal Vs Abnormal ECG Components . Abnormal Figure No ( 158 )
- 176. Ventricular Aneurysm : This is an ECG pattern of Ventricular Aneurysm – residual ST elevation and deep Q waves seen in patients with previous myocardial infarction. It is associated with extensive myocardial damage and paradoxical movement of the left ventricular wall during systole. • There is ST elevation with deep Q waves and inverted T waves in V1-3. • This pattern suggests the presence of a left ventricular aneurysm due to a prior anteroseptal MI. S e gmen ts : ST Segment - Abnormalities of the ST Segment - ST Elevation . Normal Vs Abnormal ECG Components . Abnormal Figure No ( 159 )
- 177. Brugada Syndrome : Brugada Syndrome is an inherited channelo-pathy (a disease of myocardial sodium channels) that leads to paroxysmal ventricular arrhythmias and sudden cardiac death in young patients. The tell-tale sign on the resting ECG is the ‗Brugada sign‘ — ST elevation and partial RBBB in V1-2 with a ‗coved‘ morphology. S e gmen ts : ST Segment - Abnormalities of the ST Segment - ST Elevation . Normal Vs Abnormal ECG Components . Abnormal Figure No ( 160 ) Figure No ( 161 )
- 178. There is ST elevation and partial RBBB in V1-2 with a coved morphology - the ‚Brugada sign‛. S e gmen ts : ST Segment - Abnormalities of the ST Segment - ST Elevation . Normal Vs Abnormal ECG Components . Abnormal Figure No ( 162 )
- 179. Brugada Syndrome : Type 1 : • Coved ST segment elevation >2mm in >1 of V1-V3 followed by a negative T wave. • This is the only ECG abnormality that is potentially diagnostic. • It is often referred to as Brugada sign. This ECG abnormality must be associated with one of the following clinical criteria to make the diagnosis: o Documented ventricular fibrillation (VF) or polymorphic ventricular tachycardia (VT). o Family history of sudden cardiac death at <45 years old . o Coved-type ECGs in family members. o Inducibility of VT with programmed electrical stimulation . o Syncope. o Nocturnal agonal respiration S e gmen ts : ST Segment - Abnormalities of the ST Segment - ST Elevation . Normal Vs Abnormal ECG Components . Abnormal Figure No ( 163 )
- 180. Type2: • Brugada Type 2 has >2mm of saddleback shaped ST elevation. S e gmen ts : ST Segment - Abnormalities of the ST Segment - ST Elevation . Normal Vs Abnormal ECG Components . Abnormal Figure No ( 164 )
- 181. Type3: • Brugada type 3: can be the morphology of either type 1 or type 2, but with <2mm of ST segment elevation. S e gmen ts : ST Segment - Abnormalities of the ST Segment - ST Elevation . Normal Vs Abnormal ECG Components . Abnormal Figure No ( 165 )
- 182. Ventricular Paced Rhythm : Ventricular pacing (with a pacing wire in the right ventricle) causes ST segment abnormalities identical to that seen in LBBB. There is appropriate discordance, with the ST segment and T wave directed opposite to the main vector of the QRS complex. S e gmen ts : ST Segment - Abnormalities of the ST Segment - ST Elevation . Normal Vs Abnormal ECG Components . Abnormal Figure No ( 166 )
- 183. Raised Intracranial Pressure : Raised Intracranial Pressure (ICP) (e.g. due to intracranial haemorrhage, traumatic brain injury) may cause ST elevation or depression that simulates myocardial ischaemia or pericarditis. More commonly, raised ICP is associated with widespread, deep T-wave inversions (‗cerebral T waves‗). Widespread ST elevation with concave (pericarditis-like) morphology in a patient with severe traumatic brain injury. S e gmen ts : ST Segment - Abnormalities of the ST Segment - ST Elevation . Normal Vs Abnormal ECG Components . Abnormal Figure No ( 167 )
- 184. Takotsubo Cardiomyopathy : Takotsubo Cardiomyopathy: A STEMI mimic producing ischaemic chest pain, ECG changes +/- elevated cardiac enzymes with characteristic regional wall motion abnormalities on echocardiography. • Typically occurs in the context of severe emotional distress (‗broken heart syndrome‗). • Commonly associated with new ECG changes (ST elevation or T wave inversion) or moderate troponin rise. S e gmen ts : ST Segment - Abnormalities of the ST Segment - ST Elevation . Normal Vs Abnormal ECG Components . Abnormal Figure No ( 168 )
- 185. Less Common Causes of ST segment Elevation : o Pulmonary embolism and acute cor pulmonale (usually in lead III) o Acute aortic dissection (classically causes inferior STEMI due to RCA dissection) o Hyperkalaemia o Sodium-channel blocking drugs (secondary to QRS widening) o J-waves (hypothermia, hypercalcaemia) o Following electrical cardioversion o Others: Cardiac tumour, myocarditis, pancreas or gallbladder disease Transient ST elevation after DC cardioversion from VF . J waves in hypothermia simulating ST elevation S e gmen ts : ST Segment - Abnormalities of the ST Segment - ST Elevation . Normal Vs Abnormal ECG Components . Abnormal Figure No ( 169 ) Figure No ( 170 )
- 186. Causes of ST Depression : Myocardial ischemia / NSTEMI Reciprocal change in STEMI Posterior MI Digoxin effect Hypokalemia Supraventricular tachycardia Right bundle branch block Right ventricular hypertrophy Left bundle branch block Left ventricular hypertrophy Ventricular paced rhythm S e gmen ts : ST Segment - Abnormalities of the ST Segment - ST Depression . Normal Vs Abnormal ECG Components . Abnormal
- 187. Morphology of ST Depression • ST depression can be either up-sloping, down-sloping, or horizontal. • Horizontal or down-sloping ST depression ≥ 0.5 mm at the J-point in ≥ 2 contiguous leads indicates myocardial ischemia (according to the 2007 Task Force Criteria). • Up-sloping ST depression in the precordial leads with prominent De Winter T waves is highly specific for occlusion of the LAD. • Reciprocal change has a morphology that resembles ‗upside down‘ ST elevation and is seen in leads electrically opposite to the site of infarction. • Posterior MI manifests as horizontal ST depression in V1-3 and is associated with upright T waves and tall R waves. S e gmen ts : ST Segment - Abnormalities of the ST Segment - ST Depression . Normal Vs Abnormal ECG Components . Abnormal
- 188. ST segment morphology in myocardial ischemia S e gmen ts : ST Segment - Abnormalities of the ST Segment - ST Depression . Normal Vs Abnormal ECG Components . Abnormal Figure No ( 171) Figure No ( 172 )
- 189. Reciprocal change ST segment morphology in posterior MI S e gmen ts : ST Segment - Abnormalities of the ST Segment - ST Depression . Normal Vs Abnormal ECG Components . Abnormal Figure No ( 173 ) Figure No ( 174 )
- 190. Myocardial Ischemia : ST depression due to sub-endocardial ischemia may be present in a variable number of leads and with variable morphology. It is often most prominent in the left precordial leads V4-6 plus leads I, II and aVL. Widespread ST depression with ST elevation in aVR is seen in left main coronary artery occlusion and severe triple vessel disease. **NOTE : ST depression localized to the inferior or high lateral leads is more likely to represent reciprocal change than sub-endocardial ischemia. The corresponding ST elevation may be subtle and difficult to see, but should be sought. S e gmen ts : ST Segment - Abnormalities of the ST Segment - ST Depression . Normal Vs Abnormal ECG Components . Abnormal Figure No ( 175 )
- 191. Reciprocal Change : ST elevation during acute STEMI is associated with simultaneous ST depression in the electrically opposite leads: • Inferior STEMI produces reciprocal ST depression in aVL (± lead I). • Lateral or anterolateral STEMI produces reciprocal ST depression in III and aVF (± lead II). • Reciprocal ST depression in V1-3 occurs with posterior infarction (see below). Reciprocal ST depression in aVL with inferior STEMI S e gmen ts : ST Segment - Abnormalities of the ST Segment - ST Depression . Normal Vs Abnormal ECG Components . Abnormal Figure No ( 176 )
- 192. Reciprocal ST depression in III and aVF with high lateral STEMI S e gmen ts : ST Segment - Abnormalities of the ST Segment - ST Depression . Normal Vs Abnormal ECG Components . Abnormal Figure No ( 177 )
- 193. Posterior Myocardial Infarction : Acute posterior STEMI causes ST depression in the anterior leads V1-3, along with dominant R waves (‗Q-wave equivalent‘) and upright T waves. There is ST elevation in the posterior leads V7-9. S e gmen ts : ST Segment - Abnormalities of the ST Segment - ST Depression . Normal Vs Abnormal ECG Components . Abnormal Figure No ( 178 )
- 194. De Winter T Waves : De Winter T waves: a pattern of up-sloping ST depression with symmetrically peaked T waves in the precordial leads is considered to be a STEMI equivalent, and is highly specific for an acute occlusion of the LAD. S e gmen ts : ST Segment - Abnormalities of the ST Segment - ST Depression . Normal Vs Abnormal ECG Components . Abnormal Figure No ( 179 )
- 195. Digoxin Effect : Digoxin Effect: Treatment with digoxin causes downsloping ST depression with a ‗sagging‘ morphology, reminiscent of Salvador Dali‖s moustache. S e gmen ts : ST Segment - Abnormalities of the ST Segment - ST Depression . Normal Vs Abnormal ECG Components . Abnormal Figure No ( 180 )
- 196. Hypokalemia : Hypokalemia causes widespread down-sloping ST depression with T-wave flattening/inversion, prominent U waves and a prolonged QU interval. S e gmen ts : ST Segment - Abnormalities of the ST Segment - ST Depression . Normal Vs Abnormal ECG Components . Abnormal Figure No ( 181 )
- 197. Right ventricular hypertrophy (RVH) : Right ventricular hypertrophy (RVH) causes ST depression and T-wave inversion in the right precordial leads V1-3. S e gmen ts : ST Segment - Abnormalities of the ST Segment - ST Depression . Normal Vs Abnormal ECG Components . Abnormal Figure No ( 182 )
- 198. Right Bundle Branch Block (RBBB) : Right Bundle Branch Block (RBBB) may produce a similar pattern of repolarization abnormalities to RVH, with ST depression and T wave inversion in V1-3. S e gmen ts : ST Segment - Abnormalities of the ST Segment - ST Depression . Normal Vs Abnormal ECG Components . Abnormal Figure No ( 183 )
- 199. Supraventricular Tachycardia (SVT) : Supraventricular tachycardia (e.g. AVNRT) typically causes widespread horizontal ST depression, most prominent in the left precordial leads (V4-6). This rate-related ST depression does not necessarily indicate the presence of myocardial ischemia, provided that it resolves with treatment. S e gmen ts : ST Segment - Abnormalities of the ST Segment - ST Depression . Normal Vs Abnormal ECG Components . Abnormal Figure No ( 184 ) Figure No ( 185 )
- 200. PR segment
- 201. B. Segments : 2. PR segment The PR segment is the flat, usually isoelectric segment between the end of the P wave and the start of the QRS complex. PR segment abnormalities : These occur in two main conditions: Pericarditis Atrial Ischemia S e gmen ts : PR Segment . Normal Vs Abnormal ECG Components . Normal Figure No ( 186 )
- 202. Pericarditis : The characteristic changes of acute pericarditis are: PR segment depression. Widespread concave (―saddle-shaped‖) ST elevation. Reciprocal ST depression and PR elevation in aVR and V1 Absence of reciprocal ST depression elsewhere. . **Note : PR segment changes are relative to the baseline formed by the T-P segment S e gmen ts : PR Segment - Abnormalities of the PR Segment . Normal Vs Abnormal ECG Components . Abnormal Figure No ( 187 )
- 203. PR elevation in aVR due to acute pericarditis (note the reciprocal ST depression) PR segment depression in V5 due to acute pericarditis (note also some concave ST elevation) Typical ECG of acute pericarditis. S e gmen ts : PR Segment - Abnormalities of the PR Segment . Normal Vs Abnormal ECG Components . Abnormal Figure No ( 188 ) Figure No ( 189 ) Figure No ( 190 )
- 204. Atrial ischemia : PR segment elevation or depression in patients with myocardial infarction indicates concomitant atrial ischemia or infarction. This finding has been associated with poor outcomes following MI, increased risk for the development of atrio-ventricular block, supraventricular arrhythmias and cardiac free-wall rupture. Liu‖s criteria for diagnosing atrial ischemia / infarction include: PR elevation >0.5 mm in V5 & V6 with reciprocal PR depression in V1 & V2 PR elevation >0.5 mm in lead I with reciprocal PR depression in leads II & III PR depression >1.5 mm in the precordial leads PR depression >1.2 mm in leads I, II, & III Abnormal P wave morphology: M- shaped, W-shaped ,irregular ,or notched (minor criteria) S e gmen ts : PR Segment - Abnormalities of the PR Segment . Normal Vs Abnormal ECG Components . Abnormal
- 205. PR depression in inferior STEMI indicating concomitant atrial infarction Profound PR-segment depression in inferior leads: (A) with clear-cut TP segment; (B) without clear-cut TP segment; in acute inferior myocardial infarction. (A) (B) **Note : Also St-segment Elevation In Inferior Leads. (Reproduced From Jim Et Al.) S e gmen ts : PR Segment - Abnormalities of the PR Segment . Normal Vs Abnormal ECG Components . Abnormal Figure No ( 191 )
- 206. Measurement of PR-segment depression: (A) with clear-cut TP segment; (B) without clear-cut TP segment. (Reproduced from Jim et al.) S e gmen ts : PR Segment - Abnormalities of the PR Segment . Normal Vs Abnormal ECG Components . Abnormal Figure No ( 192 )
- 207. PR Interval
- 208. C. Intervals : 1. PR Interval The PR interval is the time from the onset of the P wave to the start of the QRS complex. It reflects conduction through the AV node. • The normal PR interval is between 120 – 200 ms (0.12-0.20s) in duration (three to five small squares). • If the PR interval is > 200 ms, first degree heart block is said to be present. • PR interval < 120 ms suggests pre-excitation (the presence of an accessory pathway between the atria and ventricles) or AV nodal (junctional) rhythm. In ter vals : PR Interval . Normal Vs Abnormal ECG Components . Normal Figure No ( 193 )
- 209. A. Prolonged PR Interval – AV block (PR >200ms) : Delayed conduction through the AV node May occur in isolation or co-exist with other blocks (e.g., second-degree AV block, trifascicular block) First degree AV block : Sinus rhythm with marked 1st degree heart block (PR interval 340ms) Second degree AV block (Mobitz I) with prolonged PR interval : • Second degree heart block, Mobitz type I (Wenckebach phenomenon). • Note how the baseline PR interval is prolonged, and then further prolongs with each successive beat, until a QRS complex is dropped. • The PR interval before the dropped beat is the longest (340ms), while the PR interval after the dropped beat is the shortest (280ms). In ter vals : PR Interval -Abnormalities of the PR Interval . Normal Vs Abnormal ECG Components . Abnormal Figure No ( 194 ) Figure No ( 195 )
- 210. A. Short PR interval (<120ms) : A short PR interval is seen with: 1. Pre-excitation syndromes . 2. AV nodal (junctional) rhythm . . 1. Pre-excitation syndromes : • Wolff-Parkinson-White (WPW) • Lown-Ganong-Levine (LGL) syndromes. These involve the presence of an accessory pathway connecting the atria and ventricles. The accessory pathway conducts impulses faster than normal, producing a short PR interval. The accessory pathway also acts as an anatomical re-entry circuit, making patients susceptible to re-entry tachyarrhythmias. Patients present with episodes of paroxsymal supraventricular tachycardia (SVT), specifically atrioventricular re-entry tachycardia (AVRT), and characteristic features on the resting 12-lead ECG In ter vals : PR Interval -Abnormalities of the PR Interval . Normal Vs Abnormal ECG Components . Abnormal
- 211. • Wolff-Parkinson-White syndrome : The characteristic features of Wolff-Parkinson-White syndrome are a short PR interval (<120ms), broad QRS and a slurred upstroke to the QRS complex, the delta wave. • Lown-Ganong-Levine syndrome : The features of Lown-Ganong-Levine syndrome LGL syndrome are a very short PR interval with normal P waves and QRS complexes and absent delta waves. In ter vals : PR Interval -Abnormalities of the PR Interval . Normal Vs Abnormal ECG Components . Abnormal Figure No ( 196 ) Figure No ( 197 )
- 212. 2. AV nodal (junctional) rhythm : Junctional rhythms are narrow complex, regular rhythms arising from the AV node. P waves are either absent or abnormal (e.g. inverted) with a short PR interval (=retrograde P waves). ECG: Accelerated junctional rhythm demonstrating inverted P waves with a short PR interval (retrograde P waves) In ter vals : PR Interval -Abnormalities of the PR Interval . Normal Vs Abnormal ECG Components . Abnormal Figure No ( 198 )
- 213. QT Interval