
Recommended
More Related Content
What's hot
What's hot (20)
Similar to Skill39 intro to functions
Similar to Skill39 intro to functions (20)
More from dware655
More from dware655 (20)
Recently uploaded
Recently uploaded (20)
Skill39 intro to functions
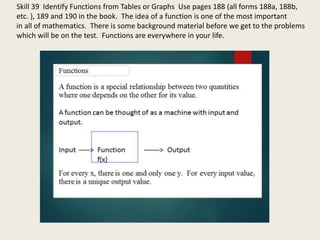
- 1. Skill 39 Identify Functions from Tables or Graphs Use pages 188 (all forms 188a, 188b, etc. ), 189 and 190 in the book. The idea of a function is one of the most important in all of mathematics. There is some background material before we get to the problems which will be on the test. Functions are everywhere in your life.
- 2. To begin with, think of a pairing of numbers from two sets (like x and y) shown in the circles below. Think of the left oval as the x (the input) and the right oval as the y (output). To be a function, the arrows connecting the values in the left oval can only be paired with one and only one number in the right oval. In the first example, see how the one is paired only with 4, the 2 is paired only with 5, and the 3 is paired only with 5. That makes it a function. In the second example, see how the 1 is paired with 4 and also with 5. That makes it not a function. On the test, the questions will NOT be in this format (mapping), but it can help you understand functions at first.
- 3. The question below IS like question on the test. The idea is to drag the numbers in the boxes to the x and y columns. How do we know what to do? We will come back to this question after some instruction on the next slides.
- 4. The charts shown below are great for learning to recognize a function from a table. Look at the x column. If any x value is repeated, the chart does NOT represent a function. If there is no repeated x, the chart represents a function. This is page 189 in your book. Answers. 5. Yes 6. No 7. Yes 8. Yes 9. Yes 10. . No (2-17s) 11. No (2-1s) 12. No (2 -1s) 13. Yes 14. No 15. Yes 16. No (2-2s)
- 5. The items listed in the test skills also require that we be able to recognize a function from its graph. We can tell if a graph is a function by imagining a vertical line (like the one at the left of the screen below) passing through the graph from left to right.
- 6. Try these problems from page 190 in your book.
- 7. Look at page 188a to see some vocabulary about functions. The x’s and y’s are just the same as in ordered pairs that you have seen in the equation of lines and (x,y) . Also look at page 188g to practice recognizing a function from a table or graph. In the next lesson, we will look at function notation, evaluating functions, and using functions in word problems. To finish the lesson, we will return to the problem given earlier. We know that the 1, 2, and 3 cannot go in the x column because those numbers have already been used as x numbers. So, that means that in the x column we must have 5 or 8. To decide, we need to look at the relationship between the X numbers and the y numbers. In this problem, the y values are all bigger than the x numbers. So, we put 5 in x and 8 in y. The relationships between x and y are different for every problem. Just look and think. The y’s might all be smaller etc.