microgravity REPORT@CSL LRT STN edited II_MMC-GAMUDA-signed.pdf
•
0 likes•3 views

miceogravity reading material

Recommended
Recommended
More Related Content
Similar to microgravity REPORT@CSL LRT STN edited II_MMC-GAMUDA-signed.pdf
Similar to microgravity REPORT@CSL LRT STN edited II_MMC-GAMUDA-signed.pdf (20)
More from divyapriya balasubramani
More from divyapriya balasubramani (11)
Recently uploaded
Recently uploaded (20)
microgravity REPORT@CSL LRT STN edited II_MMC-GAMUDA-signed.pdf
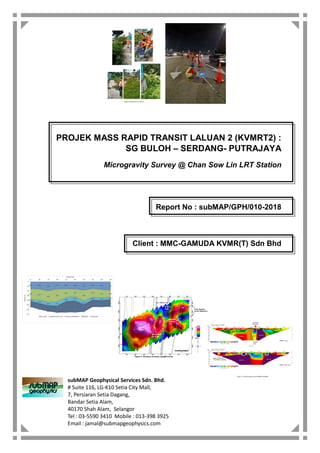
- 1. PROJEK MASS RAPID TRANSIT LALUAN 2 (KVMRT2) : SG BULOH – SERDANG- PUTRAJAYA Microgravity Survey @ Chan Sow Lin LRT Station Report No : subMAP/GPH/010-2018 Client : MMC-GAMUDA KVMR(T) Sdn Bhd subMAP Geophysical Services Sdn. Bhd. # Suite 116, LG-K10 Setia City Mall, 7, Persiaran Setia Dagang, Bandar Setia Alam, 40170 Shah Alam, Selangor Tel : 03-5590 3410 Mobile : 013-398 3925 Email : jamal@submapgeophysics.com
- 2. PROJEK MASS RAPID TRANSIT LALUAN 2 (KVMRT2) : SUNGAI BULOH – SERDANG – PUTRAJAYA - Microgravity Survey @ Chan Sow Lin LRT Station- Authorized Signature Name Jamaludin Othman, P.Geol. MIGM Designation Principal Geophysicist, BOG Registration No PG 1259 IGM Membership No 666 Date of Issue – Final Draft Report 24/11/2018 Date of Issue – Final Report 29/11/2018 Report No subMAP/GPH/010-2018 subMAP Geophysical Services Sdn. Bhd. # Suite 116, LG-K10 Setia City Mall, 7, Persiaran Setia Dagang, Bandar Setia Alam, 40170 Shah Alam, Selangor Tel : 03-5590 3410 Mobile : 013-398 3925 Email : jamal@submapgeophysics.com
- 3. CONTENTS Page Abstract 1 INTRODUCTION 1 FIELD PROCEDURES 2 Survey grid preparation 2 Microgravity survey 2 DATA REDUCTION AND PROCESSING 3 2D GRAVITY MODELLING 3 RESULTS AND DISCUSSIONS 4 Steep gravity gradient 4 Undulating bedrock 4 Sinkhole occurrences 5 CONCLUSIONS 5 LIST OF FIGURES Figure 1 Microgravity stations distribution 6 Figure 2 Bouguer anomaly map 7 Figure 3 Residual anomaly map 8 Figure 4 2D-gravity model of Profile DD’ 9 Figure 5 2D-gravity model of Profile EE’ 10 IMAGES Image 1 Night view of the LRT railway tracks 11 Image 2 Measurement at the base station 11 Image 3 The SCINTREX CG-5 Autograv gravity meter 12 Image 4 The survey team 12
- 4. Abstract A microgravity survey was carried out at Chan Sow Lin light rail transit (LRT) station, Kuala Lumpur on behalf of MMC Gamuda KVMRT (T) Sdn Bhd. The primary objective of the survey was to map karst features within the limestone bedrock on the railway track area of the LRT station. The survey was conducted in the wee hours of the morning from @01:00 to @03:30 deploying two gravity meters. The survey commenced on 25 October, 2018 and was completed on 30 October, 2018. A total 265 stations was established. The microgravity survey generally shows lower gravity values (~-7.6 to -8.0 mgals) in the track area and flanked in the north and south by higher gravity values. The gravity anomalies are consistent with undulating deeper bedrock in the track area. INTRODUCTION Microgravity survey was carried out at the Chan Sow Lin LRT station as partial requirement for the uplift of SPAD’s stop work order. The purpose of the microgravity survey was to map the subsurface karst geology underlying the LRT station. This LRT station is located opposite the Chan Sow Lin Mass Rapid Transit Station Line 2 (MRT2) which is currently under construction. MMC-GAMUDA KVMRT appointed subMAP Geophysical Services Sdn Bhd (subMAP) to carry out the microgravity survey. Due to railway operations, the gravity survey was carried out within limited working hours from 1am to 3.30 am. To ensure timely completion of data acquisition due to limited working hours, two gravimeters were deployed. The field data acquisition took five days to complete, commencing on 25 October, 2018 and completed on the 30 October, 2018. The microgravity survey was tied to the earlier microgravity survey carried out within the proposed Chan Sow Lin MRT station. FIELD PROCEDURES The survey was carried out at an approximate 5m x 5m grid interval. A further 265 stations were acquired and added to the two (2) microgravity surveys conducted earlier, reaching a total of just over 1,000 stations for the whole site (Figure 1). The distribution and layout of all the microgravity stations was pre-determined by the Client. 1
- 5. The gravity stations were located on sleepers along the track and on ballast on the track area. The gravity stations were located in a manner where minimum or no terrain correction was necessary. Survey grid preparation The Client provided a survey team to precisely locate the positions (in local Cassini projection) and determined the reduced level of all the gravity stations. Locating and marking of the gravity stations on the ground was supervised by a Field Geophysicist. To facilitate the microgravity measurements, the site investigated was divided into four blocks, each with about 60 to 70 stations. As two gravity meters were used for the survey, splitting into different blocks would allow cross-measurements between the two gravity meters to be made in a more systematic manner to ensure data integrity. Microgravity Survey The field data acquisition was carried out using two (2) SCINTREX CG-5 Autograv gravity meters. Both the gravity meters were calibrated and tested in the University of Science of Malaysia (USM) campus in Penang prior to the commencement of the survey. This procedure was crucial to ensure that the data acquired using both gravity meters met the stringent standard operating procedures required for a microgravity survey. As the data from current microgravity survey would be merged with the previously acquired data, it was mandatory to select one microgravity station from the earlier surveys as the base station. For this purpose, station number MG163 from the earlier survey was selected and established as the base station. The survey team precisely re-located this station on the ground which was then used as the base station to monitor the drift of both the gravity meters and was occupied at an interval of between 2 to 2.5 hours. Measurements were repeated twice with a 30 seconds cycle and a 15 seconds delay was set as the measurement parameters for the gravity meters. Measurements were repeated at least twice each time the base station was occupied. Additional measurements were made if the two earlier consecutive measurements were not within the allowable error of ± 0.005 mgals and acceptable standard deviations (SD) of ≤ 0.06. The tilt of the gravity meters should also be ≤ ± 10 arc radians before measurements were accepted. 2
- 6. Measurements at all other stations were made following similar procedure at the base station. Each gravity meter was assigned to a specific block to be covered. To ensure data integrity, quality and consistency, repeat measurements were randomly made at previously occupied stations within the same block. Measurements across blocks (where the gravity meter was not assigned to cover) were also made at a few selected stations as a performance check for both gravity meters to ensure only reliable high quality data were acquired. As with measurements at the base station, the instrument tilts and the standard deviations (SD) of all the gravity measurements were recorded to ensure that only good quality data were accepted. The gravity data were both recorded manually and stored in the equipment’s system memory. The data were then dumped to a laptop for validation and verification before further processing. DATA REDUCTION AND PROCESSING The raw microgravity data (tide and drift corrected) were validated for errors before inputting into an MS Excel spreadsheet and reduced to bouguer anomalies using standard reduction gravity formulae. To facilitate data reduction, the local coordinates of each station were also converted to WGS84 (longitude and latitude) coordinate system. Bouguer anomaly map was generated after all the data were reduced. This was the primary map used for interpretation and to identify anomalies. The bouguer anomaly map was further subjected to regional trend removal to produce residual map. A second degree polynomial fit was generated to represent the regional trend which was then subtracted from the bouguer anomalies. The resultant values were then plotted as residual anomaly map. The reduced bouguer and residual anomalies were then contoured and plotted using the GEOSOFT Oasis Montaj Mapping and Processing system. 2D GRAVITY MODELLING 2D gravity modelling was carried out on anomalies of interest identified by the survey to determine the dimensions (shape, depth, thickness & dip) of the causative (source) bodies. The modelling was done using the PotentQ software, which is available as an extension to the GEOSOFT Oasis Montaj Mapping and Processing system. 3
- 7. RESULTS AND DISCUSSIONS The results of the survey are presented as bouguer and residual anomaly maps (Figures 2 and 3). The bouguer anomaly map is the primary basic map produced as output in any gravity survey and indicates gravity variations due to both shallow and deep geological features. The residual map is a derivative map (generated from the bouguer anomaly map) which focuses on shallower geological features of interest which are relevant to this investigation. A residual map enhances and better defines subtle anomalies which are sometimes hardly recognizable on the bouguer anomaly map. The following will discuss significant features detected and observed on all the maps generated. However, the discussion will only focus on the findings of the current survey. Steep gravity gradient On the bouguer anomaly map (Figure 2) a steep gravity gradient to a rapid change in gravity values is observed at the north-western corner of the site. This prominent feature is commonly attributed either to a steep drop in bedrock profile or a contact between different rock types. As the site is underlain by limestone, this feature is interpreted as as the steep edge of the limestone bedrock Undulating bedrock The northern and southern end of the of the current survey site are dominated by gravity highs (Figures 2 and 3) which indicate shallow limestone bedrock. Sandwiched between these gravity highs, is an almost east-west trending gravity low indicating a significant drop in the limestone bedrock level. 2D-gravity modeling were carried out over two profiles (DD’ and EE’ in Figure 3) crossing the gravity lows to determine the drop in limestone bedrock level. Both the profiles selected are running along the railway tracks. The results of the 2D-gravity modeling exercise are shown in Figures 4 and 5. The densities used for the modeling were essentially similar to the ones used for the previous modeling exercise. A density of 2.35 gm/cc and 1.80 gm/cc was assigned to the limestone and in-filled sediment respectively. 4
- 8. Profile DD’ is located at the extreme western edge of the current survey site. An almost wedge- shaped trough was deduced from the model (Figure 5) with a maximum thickness of about 5m and a width opening of about 48m. Profile EE’ is at the eastern edge of the current survey site. The 2D-gravity model is shown in Figure 6. The width opening of the trough is about 60m with a maximum thickness reaching to about 8m. This shows the trough is thinning towards the western edge of the survey site. Two boreholes (SP1 and SP2) were drilled at the current survey site (Figure 3). Borehole SP1 hit limestone at 4.2m whereas SP2 encountered limestone at 10m. Both of these boreholes are sited on the residual anomaly map having almost similar gravity values and should have encountered limestone at about the same depths. Unfortunately, this was not the case. On closer examination, borehole SP2 is also located on the steep side of the limestone bedrock. It could be very likely that SP2 was sited on the down side of the steep sided limestone bedrock, thus explaining the deeper (10m) limestone bedrock encountered in this borehole as compared to SP1. Sinkhole occurrences. The microgravity survey did not detect the present cavity in any part of the current survey site which could be attributed to the sinkhole occurrence. CONCLUSIONS The microgravity survey carried out identified significant features which are of interest to the objective of the present investigation. A steep gravity gradient has been identified which is attributed to steep sided limestone bedrock. Shallow limestone are bedrock are observed to the north and south of the current survey site indicated high gravity lows. Sandwiched between these gravity highs and crossing the railway tracks No anomaly which can be attributed to the presence of cavity in the limestone has been detected. 5
- 9. 6
- 10. 7
- 11. 8
- 12. 9
- 13. 10
- 14. Image 1. Night view of the LRT railway tracks Image 2. Measurement at the base station 11
- 15. Image 3. The SCINTREX CG-5 Autograv gravity meter Image 4. The survey team 12