Downloaded 44 times


![Two
possible
approaches
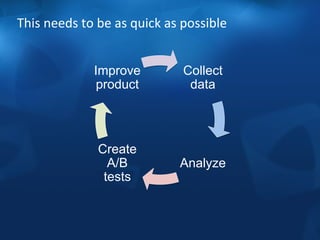
Separate events
Example of video sharing:
openVideoEditor
trimButtonPressed
undoTrimPressed
activateFacecamRecording
finishFacecamRecording
shareButtonPressed
• More flexible with a schema-based
database
• Requires much more
data processing
• Combining events can be
a hassle
Conversions with properties
Example of video sharing:
{event: “videoShareComplete”,
{properties:
[ {didTrimVideo: true},
{isVideoTrimmed: false},
{didUseFacecam: true},
{isFacecamEnabled: true},
{totalDuration: 1241}
]
}
}
• Problematic with a schema-based
database
• Easier and faster to process
• All relevant data is pre-aggregated](https://image.slidesharecdn.com/2c6everyplaybigdata-140930020825-phpapp01/85/2C6-Everyplay_Big_Data-15-320.jpg)


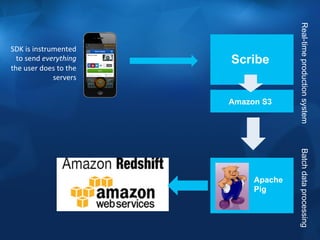
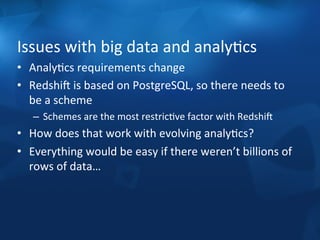
This document discusses how Everyplay uses big data analytics to improve their mobile game recording service. It describes the large amount of data they collect daily from user sessions and events. The challenges of evolving analytics requirements on their schema-based database are discussed. They settled on storing basic event data and additional details in JSON fields to balance flexibility and query speed. JavaScript is used to process and visualize the data to gain insights and optimize the product based on metrics. The keys to success are planning for analytics, making metrics easily accessible, and building A/B testing and data-driven improvements directly into the product.


![[214]베이지안토픽모형 강병엽](https://cdn.slidesharecdn.com/ss_thumbnails/214-161025025057-thumbnail.jpg?width=640&height=640&fit=bounds)
![[D2대학생세미나]140분의 파이썬(실습)](https://cdn.slidesharecdn.com/ss_thumbnails/d2140-140827015147-phpapp01-thumbnail.jpg?width=640&height=640&fit=bounds)
![[2D4]Python에서의 동시성_병렬성](https://cdn.slidesharecdn.com/ss_thumbnails/2d4pythondeview2014-140929211011-phpapp01-thumbnail.jpg?width=640&height=640&fit=bounds)
![[2A1]Line은 어떻게 글로벌 메신저 플랫폼이 되었는가](https://cdn.slidesharecdn.com/ss_thumbnails/2a1line-140929191515-phpapp02-thumbnail.jpg?width=640&height=640&fit=bounds)

![[2A4]DeepLearningAtNAVER](https://cdn.slidesharecdn.com/ss_thumbnails/2a4deeplearningatnaver-140929210707-phpapp01-thumbnail.jpg?width=640&height=640&fit=bounds)


![[NDC 2010] 그럴듯한 랜덤 생성 컨텐츠 만들기](https://cdn.slidesharecdn.com/ss_thumbnails/hsf4fdvtjgcprbeczm9r-signature-8b01151cfddd883a338efa8a6603d585034336564338d911ab6e95aca4592fa0-poli-150122014503-conversion-gate02-thumbnail.jpg?width=640&height=640&fit=bounds)
![[세미나] 특이점이 온다](https://cdn.slidesharecdn.com/ss_thumbnails/2015-160310041803-thumbnail.jpg?width=640&height=640&fit=bounds)
![[NDC 2014] 모에론](https://cdn.slidesharecdn.com/ss_thumbnails/2014-140529033254-phpapp01-thumbnail.jpg?width=640&height=640&fit=bounds)
![[NDC 2009] 행동 트리로 구현하는 인공지능](https://cdn.slidesharecdn.com/ss_thumbnails/sozq6jekqxsztuufax7q-signature-36c67eff9cc876072bc7cbb8cc904a6ded5de90832dee56b9f72b022c381012d-poli-150121233510-conversion-gate02-thumbnail.jpg?width=640&height=640&fit=bounds)


![[211] 인공지능이 인공지능 챗봇을 만든다](https://cdn.slidesharecdn.com/ss_thumbnails/211chatbot-181106094835-thumbnail.jpg?width=640&height=640&fit=bounds)
![[233] 대형 컨테이너 클러스터에서의 고가용성 Network Load Balancing: Maglev Hashing Scheduler i...](https://cdn.slidesharecdn.com/ss_thumbnails/233networkloadbalancing-181018151852-thumbnail.jpg?width=640&height=640&fit=bounds)
![[215] Druid로 쉽고 빠르게 데이터 분석하기](https://cdn.slidesharecdn.com/ss_thumbnails/215druid-181012071910-thumbnail.jpg?width=640&height=640&fit=bounds)
![[245]Papago Internals: 모델분석과 응용기술 개발](https://cdn.slidesharecdn.com/ss_thumbnails/245papagointernals1-181012045005-thumbnail.jpg?width=640&height=640&fit=bounds)
![[236] 스트림 저장소 최적화 이야기: 아파치 드루이드로부터 얻은 교훈](https://cdn.slidesharecdn.com/ss_thumbnails/236deview2018jihoonson-final-181012031726-thumbnail.jpg?width=640&height=640&fit=bounds)
![[235]Wikipedia-scale Q&A](https://cdn.slidesharecdn.com/ss_thumbnails/235deview2018julienperezwikipediaqa12oct2018-181012030613-thumbnail.jpg?width=640&height=640&fit=bounds)
![[244]로봇이 현실 세계에 대해 학습하도록 만들기](https://cdn.slidesharecdn.com/ss_thumbnails/244deview2018tomisilanderrobotsrealworldfinal11oct2018-181012024720-thumbnail.jpg?width=640&height=640&fit=bounds)
![[243] Deep Learning to help student’s Deep Learning](https://cdn.slidesharecdn.com/ss_thumbnails/243deeplearningtohelpstudentsdeeplearning-181012024530-thumbnail.jpg?width=640&height=640&fit=bounds)
![[234]Fast & Accurate Data Annotation Pipeline for AI applications](https://cdn.slidesharecdn.com/ss_thumbnails/234fastaccuratedataannotationpipelineforaiapplications1-181012024230-thumbnail.jpg?width=640&height=640&fit=bounds)
![Old version: [233]대형 컨테이너 클러스터에서의 고가용성 Network Load Balancing](https://cdn.slidesharecdn.com/ss_thumbnails/233largecontainerclusternetworkloadbalancing-181012024225-thumbnail.jpg?width=640&height=640&fit=bounds)
![[226]NAVER 광고 deep click prediction: 모델링부터 서빙까지](https://cdn.slidesharecdn.com/ss_thumbnails/226naveraddeepclickprediction-181012024116-thumbnail.jpg?width=640&height=640&fit=bounds)
![[225]NSML: 머신러닝 플랫폼 서비스하기 & 모델 튜닝 자동화하기](https://cdn.slidesharecdn.com/ss_thumbnails/225nsmlmachinelearningntuningautomize-181012023407-thumbnail.jpg?width=640&height=640&fit=bounds)
![[224]네이버 검색과 개인화](https://cdn.slidesharecdn.com/ss_thumbnails/224naversearchnpersonalizationfinal-181012022631-thumbnail.jpg?width=640&height=640&fit=bounds)
![[216]Search Reliability Engineering (부제: 지진에도 흔들리지 않는 네이버 검색시스템)](https://cdn.slidesharecdn.com/ss_thumbnails/216sresearchreliabilityengineering-181012022623-thumbnail.jpg?width=640&height=640&fit=bounds)
![[214] Ai Serving Platform: 하루 수 억 건의 인퍼런스를 처리하기 위한 고군분투기](https://cdn.slidesharecdn.com/ss_thumbnails/214aiservingplatforminference-181012022603-thumbnail.jpg?width=640&height=640&fit=bounds)
![[213] Fashion Visual Search](https://cdn.slidesharecdn.com/ss_thumbnails/213fashionvisualsearchreduced-181012022540-thumbnail.jpg?width=640&height=640&fit=bounds)
![[232] TensorRT를 활용한 딥러닝 Inference 최적화](https://cdn.slidesharecdn.com/ss_thumbnails/232dlinferenceoptimizationusingtensorrt1-181012014455-thumbnail.jpg?width=640&height=640&fit=bounds)
![[242]컴퓨터 비전을 이용한 실내 지도 자동 업데이트 방법: 딥러닝을 통한 POI 변화 탐지](https://cdn.slidesharecdn.com/ss_thumbnails/242pcdpublic-181012011734-thumbnail.jpg?width=640&height=640&fit=bounds)
![[212]C3, 데이터 처리에서 서빙까지 가능한 하둡 클러스터](https://cdn.slidesharecdn.com/ss_thumbnails/212c3-181012011644-thumbnail.jpg?width=640&height=640&fit=bounds)
![[223]기계독해 QA: 검색인가, NLP인가?](https://cdn.slidesharecdn.com/ss_thumbnails/2232018-181012010149-thumbnail.jpg?width=640&height=640&fit=bounds)


