SlideShare a Scribd company logo
1 of 93
The Analytic Network Process (ANP)
for Decision Making and Forecasting
with Dependence and Feedback
• With feedback the alternatives depend on the criteria as
in a hierarchy but may also depend on each other.
• The criteria themselves can depend on the alternatives
and on each other as well.
• Feedback improves the priorities derived from judgments
and makes prediction much more accurate.

1
Linear Hierarchy
Goal
Criteria

component,
cluster
(Level)

Subcriteria
element
Alternatives
A loop indicates that each
element depends only on itself.

2
Feedback Network with components having
Inner and Outer Dependence among Their Elements

C4
C1
Feedback

Arc from component
C4 to C2 indicates the
outer dependence of the
elements in C2 on the
elements in C4 with respect
to a common property.

C2

C3
Loop in a component indicates inner dependence of the elements in that component
with respect to a common property.

3
Inner and Outer Dependence
and the Control Hierarchy
In a network, the elements in a component may be people (e.g., individuals in the
White House) and those in another component may also be people (e.g., individuals
in Congress).
The elements in a component may influence other elements in the same component
(inner dependence) and those in other components (outer dependence) with respect
to each of several properties. We want to determine the overall influence of all the
elements.
In that case we must organize the properties or criteria and prioritize them in the
framework of a control hierarchy (or a network), perform comparisons and
synthesize to obtain the priorities of these properties. We then derive the influence
of elements in the feedback system with respect to each of these properties. Finally,
we weight the resulting influences by the importance of the properties and add to
obtain the overall influence of each element.

4
Main Operations of the ANP
• Relative measurement: Reciprocal relation
• Judgments: Homogeneity
• Hierarchy or Network: Structure of problem; the control hierarchy
• Priorities, Dominance and Consistency: Eigenvector
• Composition, Additive to also handle dependence through the supermatrix
• Supermatrix: Dependence
• Neural Firing: Fredholm Kernel and Eigenfunctions

5
Inner and Outer Dependence
and the Control Hierarchy cont.
Control hierarchies fall in four groups:
• Benefits, Costs, Risks, & Opportunities.
Benefits and costs measure the positive and negative contributions or importance
of the alternatives if they happen, but will they happen?
Risks and opportunities measure the likelihood that the alternatives will happen
and make positive and respectively negative contributions.
Each one is a hierarchy (or a network) by itself. The overall priorities of the
alternatives with respect to each of these are then combined by forming the ratios:
Benefits x Opportunities
Costs x Risks
to obtain their final overall priorities for a decision.

6
Weighting The Components
In the ANP one often needs to prioritize the influence of the components
themselves on each other component to which the elements belong. This
influence is assessed through paired comparisons with respect to
a control criterion.
The priority of each component is used to weight the priorities of all the
elements in that component. The reason for doing this is to enable us to
perform feedback multiplication of priorities by other priorities in a cycle, an
infinite number of times. The process would not converge unless the resulting
matrix of priorities is column stochastic (each of its columns adds to one).
To see that one must compare clusters in real life, we note that if a person is
introduced as the president it makes much difference, for example, whether he
or she is the President of the United States or the president of a local labor
group.

7
Functional - Structural Criteria
Independence - Dependence
1--Criteria completely independent from alternatives - Absolute
Measurement, Intensities and Standards.
2--Criteria quasi dependent on alternatives - Relative
Measurement: Rescale the weight of a criterion by the number of
alternatives and their measurement (normalization).
3--Criteria completely dependent on alternatives - Feedback
network - the Supermatrix.

8
Why ANP?

• The power of the Analytic Network Process (ANP) lies in its use of
ratio scales to capture all kinds of interactions and make accurate
predictions, and, even further, to make better decisions. So far, it has
proven itself to be a success when expert knowledge is used with it to
predict sports outcomes, economic turns, business, social and political
decision outcomes.
• The ANP is a mathematical theory that makes it possible for one to
deal systematically with all kinds of dependence and feedback. The
reason for its success is the way it elicits judgments and uses
measurement to derive ratio scales. Priorities as ratio scales are a
fundamental kind of number amenable to performing the basic
arithmetic operations of adding within the same scale and multiplying
different scales meaningfully as required by the ANP.

9
Mutual Influence Among Several Elements
In order to distinguish among the influence of several homogeneous elements that is exerted on a single
element, the number of influencing elements cannot be more than a few. The reason is that the element
that is influenced must be able to distinguish between the various influences and respond to them in
relatives terms. If their number is large, the relative influence of each would be a small part of the total.
On the other hand, if the number of elements is small, the relative influence of each one on any other
single element would be large and distinguishable. A small change in the influence of any of these
elements would not alter the receiving elements estimation of its overall influence. When the number of
elements is large, they need to be put in different clusters.

Unidirectional Influence
A single powerful element may influence numerous other elements that do not influence it in return or
influence each other. If many elements influence a single element without feedback, their number can
be arbitrarily large.

10
The Questions to Answer About the
Dominance of Influence
Two kinds of questions encountered in the ANP:
1. Given a criterion, which element has greater influence (is more dominant) with
respect to that criterion?
Use one of the following two questions throughout an exercise.
2. Given a criterion and given an element X in any cluster, which element in the
same cluster or a different cluster has greater influence on X with respect to that
criterion?
2’. Given a criterion and given an element X in any cluster, which element in the
same or in a different cluster is influenced more by X with respect to that criterion.

11
Example of Control Hierarchy
Optimum Function of A System

Environmental

Economic

Social

Influence is too general a concept and must be specified in
terms of particular criteria. It is analyzed according to each
criterion and then synthesized by weighting with these priorities
of the “control” criteria belonging to a hierarchy or to a system.

12
The Supermatrix
Take a control criterion. The priorities of the elements derived from paired comparisons with
respect to that control criterion are arranged both vertically and horizontally according to
components. The elements in each component are listed for that component in a matrix known
as the Supermatrix. Each vector taken from a paired comparison matrix is part of the column of
the supermatrix representing the impact with respect to the control criterion of the elements of
that component on a single element of the same or another component listed at the top.

The Weighted Supermatrix

All the clusters are pairwise compared according to their influence on a given cluster X with
respect to the control criterion. This yields a vector of priorities of the impact of all the clusters
on a given criterion. Each component of a vector is used to weight all the elements in the block
of column priorities of the supermatrix corresponding to the impact of the elements of that
cluster on X. The process is repeated for all the clusters resulting in a weighted supermatrix.
In each block of the supermatrix, a column is either a normalized eigenvector with possibly
some zero entries, or all of its elements are equal to zero. In either case it is weighted by the
priority of the corresponding cluster on the left. If it is zero, that column of the supermatrix
must be normalized after weighting by the cluster’s weights. This operation is equivalent to
assigning a zero value to the cluster on the left when weighting a column of a block with zero
entries and then re-normalizing the weights of the remaining clusters.

13
The Limiting Supermatrix
The weighted supermatrix is now column stochastic from which one then derives the
limiting supermatrix. There are four major cases to consider in deriving the limiting
supermatrix depending on the simplicity or multiplicity of the principle eigenvalue and on
the reducibility and irreducibility of the matrix.

How to Read Off the Answer
The desired priorities of the criteria and alternatives with respect to the corresponding
control criterion can be read off the supermatrix as given or they may be structurally
adjusted according to the number of elements in each cluster and appropriately re-weighted.

How to Combine Benefits, Costs, Opportunities, Risks
One must first combine the supermatrices for the benefits, then for the costs, then for the
opportunities and then for the risks by using the weights of the control criteria for each.
One then takes the ratio
benefits x opportunities / costs x risks
for the alternatives and selects the alternative with the largest ratio.

14
Networks and the Supermatrix
c1
c1

W=

e11
e12

c2

e1n1
21
e22

cN

e2n2
N1
eN2

e11e12

c2
e1n1

e21e22

cN
e2n2

eN1eN2

eNnN

W11

W12

W1N

W21

W22

W2N

WN1

WN2

WNN

eNuN

15
where
(j1)

Wi1
Wij =

(j1)

Wi2

(j1)

Wini

(j2)

Wi1

(j2)

Wi2

(j2)

Wini

(jnj)

Wi1

(jnj)

Wi2

(jnj)

Wini
16
Supermatrix of a Hierarchy
0
W=

0

0

0

0

W21 0 0

0

0

0

0

0

0

0

0
0

0

W32 0
0
0

0
0

Wn-1, n-2 0
0
0 Wn, n-1 I
17
0
0

0
0

0
0

0
0

0
0

0

0

0

0

0

W k=
Wn,n-1 Wn-1,n-2

W
… 32 W21 Wn,n-1 Wn-1,n-2

W
... 32

Wn,n-1 Wn-1,n-2 Wn,n-1 I

for k>n-1

18
The School Hierarchy as Supermatrix
Goal
Learning
Friends
School life
Vocational training
College preparation
Music classes
Alternative A
Alternative B
Alternative C

Goal
0
0.32
0.14
0.03
0.13
0.24
0.14
0
0
0

Learning
0
0
0
0
0
0
0
0.16
0.59
0.25

Friends
0
0
0
0
0
0
0
0.33
0.33
0.34

School life Vocational training College preparation Music classes
0
0
0
0
0
0
0
0
0
0
0
0
0
0
0
0
0
0
0
0
0
0
0
0
0
0
0
0
0.45
0.77
0.25
0.69
0.09
0.06
0.5
0.09
0.46
0.17
0.25
0.22

A
0
0
0
0
0
0
0
1
0
0

B
0
0
0
0
0
0
0
0
1
0

C
0
0
0
0
0
0
0
0
0
1

Limiting Supermatrix & Hierarchic Composition
Goal
Learning
Friends
School life
Vocational training
College preparation
Music classes
Alternative A
Alternative B
Alternative C

Goal
0
0
0
0
0
0
0
0.3676
0.3781
0.2543

Learning
0
0
0
0
0
0
0
0.16
0.59
0.25

Friends
0
0
0
0
0
0
0
0.33
0.33
0.34

School life Vocational training College preparation Music classes
0
0
0
0
0
0
0
0
0
0
0
0
0
0
0
0
0
0
0
0
0
0
0
0
0
0
0
0
0.45
0.77
0.25
0.69
0.09
0.06
0.5
0.09
0.46
0.17
0.25
0.22

19

A
0
0
0
0
0
0
0
1
0
0

B
0
0
0
0
0
0
0
0
1
0

C
0
0
0
0
0
0
0
0
0
1
Criteria Independent from Alternatives
When the criteria do not depend on the alternatives, the
latter are kept out of the supermatrix and are evaluated in
the usual hierarchic way by the distributive or ideal
modes to make possible rank preservation or reversal as
desired. The priorities of the criteria in terms of which
the alternatives are evaluated hierarchically are taken
from the limiting supermatrix. Here again benefit, cost,
opportunity, and risk evaluation can be made to
determine the ranks of the alternatives.

20
Structural Adjust
After & Before the Final Results
After computing the limiting results, if it is desired to group
together elements from two or more clusters to determine their
relative influence, the priorities of each cluster may be multiplied
by the relative number of elements in that cluster to the total
number in the set of clusters and then the entire set is normalized.
One may think to do such structural adjustment in the weighting
process of the original supermatrix. There may be occasions
where that is what should be done.

21
The Management of a Water Reservoir
Here we are faced with the decision to choose
one of the possibilities of maintaining the water
level in a dam at: Low (L), Medium (M) or High
(H) depending on the relative importance of Flood
Control (F), Recreation (R) and the generation of
Hydroelectric Power (E) respectively for the three
levels. The first set of three matrices gives the
prioritization of the alternatives with respect to the
criteria and the second set, those of the criteria in
terms of the alternatives.

22
A Feedback System with Two Components
Flood
Control

Low
Level

Recreation

Intermediate
Level

HydroElectric
Power

High
Level

23
1) Which level is best for flood control?

Flood Control
Low
Low
1
Medium 1/5
High
1/7

Med
5
1
1/4

High Eigenvector
7
.722
4
.205
1
.073

Consistency Ratio = .107
3) Which level is best for power generation?

Power Generation
Low
Low
1
Medium 5
High
9

Med
1/5
1
5

High Eigenvector
1/9
.058
1/5
.207
1
.735

2) Which level is best for recreation?

Recreation
Low
Low
1
Medium 7
High
5

Med
1/7
1
1/3

High Eigenvector
1/5
.072
3
.649
1
.279

Consistency Ratio = .056

Consistency Ratio = .101

24
Flood Control
Recreation
Hydro-Electric
Power
2) At
Intermediate
Level, which
attribute is
satisfied best?

Flood Control
Recreation
Hydro-Electric
Power

F
1
1/3
1/5

Low Level Dam
R
E
3
5
1
3
1/3
1

Eigenvector
.637
.258
.105

1) At Low
Level, which
attribute is
satisfied best?

Consistency Ratio = .033

Flood Control
Recreation
Hydro-Electric
Power
F
1
5
9

Intermediate Level Dam
F
R
E
1
1/3
1
3
1
3
1
1/3
1

Eigenvector
.200
.600
.200

Consistency Ratio = .000

High Level Dam
R
E
1/5
1/9
1
1/4
4
1

Eigenvector
.060
.231
.709

3) At High
Level, which
attribute is
satisfied best?

Consistency Ratio = .061

25
The six eigenvectors were then introduced as
columns of the following stochastic supermatrix.
F
F
R
E
L
M
H

0
0
0
.722
.205
.073

R

E

L

M

H

0
0
0
.072
.649
.279

0
0
0
.058
.207
.735

.637
.258
.105
0
0
0

.200
.600
.200
0
0
0

.060
.231
.709
0
0
0

One must ensure that all columns sum to unity exactly.

26
The final priorities for both, the height of the dam and for the criteria were
obtained from the limiting power of the supermatrix. The components were
not weighted here because the matrix is already column stochastic and
would give the same limiting result for the ratios even if multiplied by the
weighting constants.
Its powers stabilize after a few iterations. We have

F
F
R
E
L
M
H

R

E

L

M

H

0
0
0
.223
.372
.405

0
0
0
.223
.372
.405

0
0
0
.223
.372
.405

.241
.374
.385
0
0
0

.241
.374
.385
0
0
0

.241
.374
.385
0
0
0

27
The columns of each block of this matrix are
identical, so that in the top right block we can
read off the overall priority of each of the three
criteria from any column, and read off the overall
priorities of the three alternatives from any
column of the bottom left block. It is clear from
this analysis that for the kind of judgments
provided, there is preference for a high dam with
priority .405 for hydroelectric power generation
with priority .385.

28
Choosing a Car: Foreign or Domestic?
Cost
A
E
J

A

E

J

1
1/5
1/3

5
1
3

3
1/3
1

Eigenvector
.637
.105
.258

American
C
R
D

C
1
1/3
1/4

R

D

3
1
1

4
1
1

Consistency Ratio = .033

Repair Cost
A
E
J

A

E

1
1/5
1/2

J
5
1
3

Eigenvector

2
1/3
1

.582
.109
.309

A
E
J

A

E

J

1
5
3

1/5
1
1/3

1/3
3
1

Eigenvector
.105
.637
.258

Consistency Ratio = .033

.634
.192
.174

Consistency Ratio = .008

European
C
R
D

C

R

D

1
1
2

1
1
2

1/2
1/2
1

Consistency Ratio = .003
Durability

Eigenvector

Eigenvector
.250
.250
.500

Consistency Ratio = .008
Japanese
C
R
D

C

R

D

1
1/2
1

2
1
2

1
1/2
1

Eigenvector
.400
.200
.400

Consistency Ratio = .000

29
Original Supermatrix
C
R
D
A
E
J

C
0
0
0
.637
.105
.258

R
0
0
0
.582
.109
.309

D
0
0
0
.105
.637
.258

A
.634
.192
.174
0
0
0

E
.250
.250
.500
0
0
0

J
.400
.200
.400
0
0
0

Limiting Supermatrix
C
R
D
A
E
J

C
0
0
0
.452
.279
.269

R
0
0
0
.452
.279
.269

D
0
0
0
.452
.279
.269

A
.464
.210
.326
0
0
0

E
.464
.210
.326
0
0
0

J
.464
.210
.326
0
0
0

Choose an American car. Cost is the dominant criterion.

30
Date and Strength of Recovery of U.S. Economy
Primary Factors

Subfactors

Adjustment Period
Required for
Turnaround

Conventional
adjustment

Economic
Restructuring

Consumption (C)
Exports (X)
Investment (I)
Fiscal Policy (F)
Monetary Policy (M)
Confidence (K)

Financial Sector (FS)
Defense Posture (DP)
Global Competition (GC)

3 months

6 months

12 months

24 months

The U.S. Holarchy of Factors for Forecasting Turnaround in Economic Stagnation

31
Table 1: Matrices for subfactor importance relative to primary factors influencing the Timing of Recovery
Panel A: Which subfactor has the greater potential to influence Conventional Adjustment and how strongly?

C
Consumption
(C)
Exports
(E)
Investment
(I)
Confidence
(K)
Fiscal Policy
(F)
Monetary Policy (M)

E

I

K

F

M

Vector
Weights

1
1/7
1/5
5
2
5

7
1
5
5
5
7

5
1/5
1
5
3
5

1/5
1/5
1/5
1
1/5
1

1/2
1/5
1/3
5
1
5

1/5
1/7
1/5
1
1/5
1

0.118
0.029
0.058
0.334
0.118
0.343

Panel B: Which subfactor has the greater potential to influence Economic Restructuring and how strongly?

FS
Financial
Sector
(FS)
Defense
Posture
(DS)
Global
Competition (GC)

DP

GC

Vector
Weights

1

3

3

0.584

1/3

1

3

0.281

1/3

1/3

1

0.135

32
Table 2: Matrices for relative influence of subfactors on periods of adjustment (months) (Conventional Adjustment)
For each panel below, which time period is more likely to indicate a turnaround if the relevant factor is the sole driving force?
Panel A: Relative importance of targeted time periods for
consumption to drive a turnaround
3
6
12
24
Vec. Wts.
3 months
6 months
12 months
24 months

1
5
7
7

1/5
1
5
5

1/7
1/5
1
3

1/7
1/5
1/3
1

.043
.113
.310
.534

Panel C: Relative importance of targeted time periods for
investment to drive a turnaround
3
6
12
24
Vec. Wts.
3 months
6 months
12 months
24 months

1
1
5
5

1
1
5
5

1/5
1/5
1
3

1/5
1/5
1/3
1

.078
.078
.305
.538

Panel E: Relative importance of targeted time periods for
monetary policy to drive a turnaround
3
3 months
6 months
12 months
24 months

1
1/5
1/7
1/7

6

12

24

5
1
1/5
1/7

7
5
1
5

7
7
1/5
1

Vec. Wts.
.605
.262
.042
.091

Panel B: Relative importance of targeted time periods for
exports to drive a turnaround
3
3 months
6 months
12 months
24 months

1
1
5
5

6
1
1
5
5

12

24

1/5
1/5
1
1

1/5
1/5
1
1

Vec. Wts.
.083
.083
.417
.417

Panel D: Relative importance of targeted time periods for
fiscal policy to drive a turnaround
3
6
12
24
Vec. Wts.
3 months
6 months
12 months
24 months

1
1
3
5

1
1
5
5

1/3
1/5
1
1

1/5
1/5
1
1

.099
.087
.382
.432

Panel F: Expected time for a change of confidence
indicators of consumer and investor activity to support a
turnaround in the economy
3
6
12
24
Vec. Wts.
3 months
6 months
12 months
24 months

1
1/3
1/5
1/5

3
1
1/5
1/5

5
5
1
1/5

33

5
5
5
1

.517
.305
.124
.054
Table 3: Matrices for relative influence of subfactors on periods of adjustment (months) (Economic Restructuring)
For each panel below, which time period is more likely to indicate a turnaround if the relevant factor is the sole driving force?

Panel A: Financial system restructuring time
3
6
12
24
Vec. Wts.
3 months
6 months
12 months
24 months

1
3
5
7

1/3
1
5
7

1/5
1/5
1
5

1/7
1/7
1/5
1

Panel B: Defense readjustment time
3
6
12
24

.049
.085
.236
.630

3 months
6 months
12 months
24 months

1
3
5
7

1/3
1
5
7

1/5
1/5
1
5

1/7
1/7
1/5
1

Vec. Wts.
.049
.085
.236
.630

Panel C: Global competition adjustment time
3
6
12
24
Vec. Wts.
3 months
6 months
12 months
24 months

1
1
5
5

1
1
5
5

1/5
1/5
1
3

1/5
1/5
1/3
1

.078
.078
.305
.538

Table 4: Most likely factor to dominate during a specified time period
Which factor is more likely to produce a turnaround during the specified time period?
Panel A: 3 Months
CA
R

CA
1
1/5

R
5
1

Vec. Wts.
.833
.167

Panel B: 6 Months
CA
CA 1
R 1/5

R
5
1

Vec. Wts.
.833
.167

Conventional Adjustment
Restructuring

Panel C: 1 Year
CA
CA 1
R
1

R
1
1

CA
R

Panel D: 2 Years

Vec. Wts.
.500
.500

CA R
CA 1 1/5
R
5
1

34

Vec. Wts.
.167
.833
Table 5: The Completed Supermatrix
Conven. Economic. Consum.
Adjust Restruc.
Conven.
Adjust
Economic.
Restru.

Exports

Invest.

Confid.

Fiscal
Policy

Monet.
Policy

Financ.
Sector

Defense
Posture

Global
Compet.

3 mo.

0.0

0.0

0.0

0.0

0.0

0.0

0.0

0.0

0.0

0.0

0.0

0.0

0.0

0.0

0.0

0.0

0.0

0.0

0.0

0.0

0.0

0.0

0.500
0.167
¦ 0.833 0.833
¦
0.500
0.833
¦ 0.167 0.167
+--------------------------

------+
0.118 ¦ 0.0
0.0
0.0
0.0
0.0
0.0
0.0
0.0
0.0
0.0
0.0
¦
Exports
0.029 ¦ 0.0
0.0
0.0
0.0
0.0
0.0
0.0
0.0
0.0
0.0
0.0
¦
Invest.
0.0
0.0
0.0
0.0
0.0
0.0
0.0
0.0
0.0
0.0
0.058 ¦0.0
¦
Confid.
0.0
0.0
0.0
0.0
0.0
0.0
0.0
0.0
0.0
0.0
0.334 ¦0.0
¦
Fiscal
0.118 ¦0.0
0.0
0.0
0.0
0.0
0.0
0.0
0.0
0.0
0.0
0.0
Policy
¦
Monetary 0.343 ¦0.0
0.0
0.0
0.0
0.0
0.0
0.0
0.0
0.0
0.0
0.0
Policy ------+
+----+
Financ.
0.0
0.0
0.0
0.0
0.0
0.0
0.0
0.0
0.0
0.0
¦0.584¦ 0.0
Sector
¦
¦
¦
¦
Defense
0.0
0.0
0.0
0.0
0.0
0.0
0.0
0.0
0.0
0.0
¦0.281¦ 0.0
Posture
¦
¦
¦
¦
Global
0.0
0.0
0.0
0.0
0.0
0.0
0.0
0.0
0.0
0.0
¦0.135¦ 0.0
Compet.
+----+
+------------------------------------------------------------------+
3 months 0.0
0.0 ¦
0.043
0.083
0.078
0.517
0.099
0.605
0.049
0.049
0.089 ¦ 0.0
¦
¦
6 months 0.0
0.0 ¦
0.113
0.083
0.078
0.305
0.086
0.262
0.085
0.085
0.089 ¦ 0.0
¦
¦
1 year
0.0
0.0 ¦
0.310
0.417
0.305
0.124
0.383
0.042
0.236
0.236
0.209 ¦ 0.0
¦
¦
2
0.0 ¦
0.534
0.417
0.539
0.054
0.432
0.091
0.630
0.630
0.613 ¦ 0.0
≥ years 0.0
Consum.

6 mo.

1 yr.

2
≥ years

0.0

0.0

0.0

0.0

0.0

0.0

0.0

0.0

0.0

0.0

0.0

0.0

0.0

0.0

0.0

0.0

0.0

0.0

0.0

0.0

0.0

0.0

0.0

0.0

0.0

0.0

0.0

0.0

0.0

0.0

0.0

0.0

0.0

0.0

0.0

0.0

0.0

0.0

0.0

35
Table 6: The Limiting Supermatrix

Conven. Economic. Consum.
Adjust Restruc.

Exports

Invest.

Confid.

Fiscal
Policy

Monet.
Policy

Financ.
Sector

Defense
Posture

Global
Compet.

6 mo.

1 yr.

≥ 2 years

0.0

0.0

0.0

0.0

0.0

0.0

0.0

0.0

Conven.
Adjust
Economic
Restru.

0.0

Consum.

0.0

0.0

0.0

0.0

0.0

0.0

0.0

0.0

0.0

0.0

0.0

Exports

0.0

0.0

0.0

0.0

0.0

0.0

0.0

0.0

0.0

0.0

0.0

Invest.

0.0

0.0

0.0

0.0

0.0

0.0

0.0

0.0

0.0

0.0

0.0

Confid.

0.0

0.0

0.0

0.0

0.0

0.0

0.0

0.0

0.0

0.0

0.0

Fiscal
Policy
Monetary
Policy
Financ.
Sector
Defense
Posture
Global
Compet.

0.0

0.0

0.0

0.0

0.0

0.0

0.0

0.0

0.0

0.0

0.0

0.0

0.0

0.0

0.0

0.0

0.0

0.0

0.0

0.0

0.0

0.0

0.0

0.0

0.0

0.0

0.0

0.0

0.0

0.0

0.0

0.0

0.0

0.0

0.0

0.0

0.0

0.0

0.0

0.0

0.0

0.0

0.0

0.0

0.0

0.0

0.0

0.0

0.0

0.0

0.0

0.0

0.0

0.0

0.0

0.0

0.0

0.0

0.0

0.0

0.0

0.0

0.0

0.0

0.0

0.0

0.0

0.0

0.0

0.0

0.0

0.0

0.0

0.0

0.0

0.0

0.0

0.0

0.0

0.0

0.0

0.0

0.0

0.0

0.0

0.0

0.0

0.0

0.0

0.0

0.0

0.0

0.0

0.0

0.0

0.0

0.0

0.0

0.0

0.0

0.0

0.0

0.0

0.0

0.0 
0.484
0.484
0.484
0.484
0.484
0.484
0.484
0.484
0.484 


0.0 
0.516
0.516
0.516
0.516
0.516
0.516
0.516
0.516
0.516 


3 mo.


0.224
0.224  0.0

6 months
0.151
0.151 0.0

1 year
0.201
0.201  0.0

0.424
0.424  0.0
≥ 2 years
3 months


0.057
0.057
0.057
0.057

0.014
0.014
0.014
0.014

0.028
0.028
0.028
0.028

0.162
0.162
0.162
0.162

0.057
0.057
0.057
0.057

0.166
0.166
0.166
0.166

0.301
0.301
0.301
0.301

0.145
0.145
0.145
0.145

0.070
0.070
0.070
0.070


36
Synthesis/Results
When the judgments were made, the AHP framework was
used to perform a synthesis which produced the following
results. First a meaningful turnaround in the economy
would likely require an additional ten to eleven months,
occurring during the fourth quarter of 1992. This forecast is
derived from weights generated in the first column of the
limiting matrix in Table 6, coupled with the mid-points of
the alternate time periods (so as to provide unbiased
estimates:
.224 x 1.5 + .151 x 4.5 + .201 x 9 + .424 x 18 =
10.45 months from late December 1991/early January 1992
37
The Strength of Recovery
Primary Factors

Conventional
Adjustment

Subfactors

Consumption (C)
Exports (X)
Investment (I)
Fiscal Policy (F)
Monetary Policy (M)
Confidence (K)
Very Strong
(5.5-6.5% GNP)

Strong
(4.5-5.5% GNP)

Economic
Restructuring

Financial Sector (FS)
Defense Posture (DP)
Global Competition (GC)

Moderate
(3-4.5% GNP)

Weak
(2-3% GNP)

38
Table 7: Matrices for Primary and Subfactors for Strength of Recovery
Panel A: Which primary factor will be more influential in determining the Strength of Recovery?
Vector
CA
R
Weights
Conventional
Adjustment (CA)
Restructuring (R)

1
5

1/5
1

.167
.833

Panel B: Which subfactor is more important in influencing Conventional Adjustment?

C
Consumption
(C)
Exports
(E)
Investment
(I)
Confidence
(K)
Fiscal Policy
(F)
Monetary Policy (M)

E

I

K

F

M

Vector
Weights

1
1/7
1/3
1
1/7
1/3

7
1
5
5
1
7

3
1/5
1
3
3
5

1
1/5
1/3
1
1/7
1/3

7
1
1/3
7
1
7

3
1/5
1/5
3
1/7
1

0.317
0.037
0.099
0.305
0.035
0.207

Panel C: Which subfactor is more important in influencing Economic Restructuring?

FS
Financial
Sector
(FS)
Defense
Posture
(DS)
Global
Competition (GC)

DP

GC

Vector
Weights

1

1/5

1/3

0.105

5

1

3

0.637

3

1/3

1

0.258

CI = 0.037

39
Table 8: Matrices for relative influence of subfactors on Strength of Recovery (Conventional Adjustment)
For each panel below, which intensity is more likely to obtain if the designated factor drives the recovery?
Panel A: Relative likelihood of the strength of recovery if
consumption drives the expansion
V
S
M
W
Vec. Wts.
Very Strong (V) 1
Strong (S)
1
1/5
Moderate (M)
1/7
Weak (W)

1
1
1/5
1/7

5
5
1
1/3

7
7
3
1

.423
.423
.104
.051

CI = 0.028

Panel B: Relative likelihood of the strength of recovery if
exports drives the expansion
V
Very Strong (V) 1
Strong (S)
1
3
Moderate (M)
5
Weak (W)

S

M

1
1
3
5

1/3
1/3
1
3

W
1/5
1/5
1/3
1

Vec. Wts.
.095
.095
.249
.560

CI = 0.016

Panel C: Relative likelihood of the strength of recovery if
investment drives the expansion
V
S
M
W
Vec. Wts.

Panel D: Relative likelihood of the strength of recovery if
confidence drives the expansion
V
S
M
W
Vec. Wts.

Very Strong (V) 1
Strong (S)
1
3
Moderate (M)
1/2
Weak (W)

Very Strong (V) 1
Strong (S)
1
1/3
Moderate (M)
1/5
Weak (W)

1
1
3
1/2

1/3
1/3
1
1/6

2
2
6
1

.182
.182
.545
.091

CI = 0.0

1
1
1/3
1/5

3
3
1/3
1/7

5
5
7
1

.376
.376
.193
.054

CI = 0.101

Panel E: Relative likelihood of the strength of recovery if
fiscal policy drive the expansion
V
S
M
W
Vec. Wts.

Panel F: Relative likelihood of the strength of recovery if
monetary policy drives the expansion
V
S
M
W
Vec. Wts.

Very Strong (V)
Strong (S)

Very Strong (V) 1
Strong (S)
1
5
Moderate (M)
3
Weak (W)

Moderate (M)
Weak (W)

1
1
5
1

1
1
5
1

1/5
1/5
1
1/5
CI = 0.0

1
1
5
1

.125
.125
.625
.125

1
1
5
3

1/5
1/5
1
1/7
CI = 0.101

40

1/3
1/3
7
1

.084
.084
.649
.183
Table 9: Matrices for relative influence of subfactors on Strength of Recovery (Restructuring)
For each panel below, which intensity is more likely to obtain if the designated factor drives the recovery?
Panel A: Relative likelihood of the strength of recovery if
financial sector drives the expansion
V
S
M
W
Vec. Wts.
Very Strong (V) 1
Strong (S)
1
3
Moderate (M)
5
Weak (W)

1
1
3
5

1/3
1/3
1
1/3

1/5
1/5
1/3
1

Panel B: Relative likelihood of the strength of recovery if
defense posture drives the expansion
V
S
M
W
Vec. Wts.

.095
.095
.249
.560

Very Strong (V) 1
Strong (S)
3
5
Moderate (M)
7
Weak (W)

CI = 0.016

1/3
1
3
5

1/5
1/3
1
3

1/7
1/5
1/3
1

.055
.118
.262
.565

CI = 0.044

Panel C: Relative likelihood of the strength of recovery if
global competition drives the expansion
V
S
M
W
Vec. Wts.
Very Strong (V) 1
Strong (S)
1
3
Moderate (M)
5
Weak (W)

1
1
3
5

1/3
1/3
1
1

1/5
1/5
1
1

.101
.101
.348
.449

CI = 0.012

Table 10: Overall Results for Strength of Recovery
% GNP Growth
Very Strong
(5.56.5) Strong
(4.5-.5) Moderate
(3-4.5)
Weak
(2-3)

0.108
0.141
0.290
0.461

% GNP Recovery Rate*

3.6

*% GNP Recovery rate calculated using the relative strength of conventional adjustment and restructuring in Table 5 Panel A
each used to multiply midpoints of % GNP Growth and then summed.

41
Hamburger Model
Estimating Market Share of Wendy’s, Burger King and McDonald’s
with respect to the single economic control criterion

42
How to Pose the Question to
Make Paired Comparisons
• One must answer questions of the following kind: given
McDonald’s (in the Alternatives cluster) is its economic
strength derived more from Creativity or from Frequency
(both in the Advertising cluster)? Conversely, given
Creativity in the Advertising cluster who is more
dominant, McDonald’s or Burger King?
• Then, again, by comparing the dominance impact of the
clusters of Advertising and Quality of Food on the
economic success of McDonald by weighting and
normalizing we can relate the relative effect of elements in
these different clusters.

43
Hamburger Model Supermatrix
Other

Quality

Advertising

Competition

Local:

O
t
h
e
r

Q
Ad
C
o
m
p

Menu

Cleanli
ness

Speed

Service

Location

Price

Reputa
tion

Take
Out

Portion

Taste

Nutri
tion

Freq
uency

Promo
tion

Creativ
ity

Wendy’s

Burger
King

McDonald’s

Menu Item
Cleanliness
Speed
Service
Location
Price
Reputation
Take-Out
Portion
Taste
Nutrition
Frequency
Promotion
Creativity
Wendy's
Burger King
McDonald’s

0.0000
0.6370
0.1940
0.0000
0.0530
0.1170
0.0000
0.0000
0.2290
0.6960
0.0750
0.7500
0.1710
0.0780
0.3110
0.1960
0.4930

0.0000
0.0000
0.7500
0.0780
0.1710
0.0000
0.0000
0.0000
0.0000
0.0000
0.0000
0.0000
0.0000
0.0000
0.5000
0.2500
0.2500

0.0000
0.0000
0.0000
0.1880
0.0000
0.0000
0.0810
0.7310
0.0000
0.0000
0.0000
0.0000
0.0000
0.0000
0.0990
0.3640
0.5370

0.0000
0.5190
0.2850
0.0000
0.0980
0.0000
0.0980
0.0000
0.0000
0.0000
0.0000
0.0000
0.0000
0.0000
0.5280
0.1400
0.3330

0.0000
0.0000
0.0000
0.0000
0.0000
0.0000
0.0000
0.0000
0.0000
0.0000
0.0000
0.0000
0.0000
0.0000
0.0950
0.2500
0.6550

0.0000
0.0000
0.0000
0.0000
0.5000
0.0000
0.0000
0.5000
0.8330
0.0000
0.1670
0.1670
0.8330
0.0000
0.0950
0.2500
0.6550

0.1930
0.2390
0.0830
0.0450
0.2640
0.0620
0.0570
0.0570
0.2800
0.6270
0.0940
0.5500
0.3680
0.0820
0.1010
0.2260
0.6740

0.0000
0.0000
0.2900
0.0550
0.6550
0.0000
0.0000
0.0000
0.0000
0.0000
0.0000
0.0000
0.0000
0.0000
0.1960
0.3110
0.4940

0.0000
0.0000
0.0000
0.0000
0.0000
0.8570
0.0000
0.1430
0.0000
0.0000
0.0000
0.0000
0.0000
0.0000
0.2760
0.1280
0.5950

0.0000
0.0000
0.0000
0.0000
0.0000
0.0000
0.0000
0.0000
0.0000
0.0000
0.0000
0.0000
0.0000
0.0000
0.6050
0.1050
0.2910

0.0000
0.0000
0.0000
0.0000
0.0000
0.0000
0.0000
0.0000
0.0000
0.0000
0.0000
0.0000
0.0000
0.0000
0.5940
0.1570
0.2490

0.3110
0.0000
0.0000
0.0000
0.1960
0.0000
0.4930
0.0000
0.0000
0.0000
0.0000
0.0000
0.5000
0.5000
0.0880
0.1950
0.7170

0.1670
0.0000
0.0000
0.0000
0.0000
0.8330
0.0000
0.0000
0.0000
0.0000
0.0000
0.6670
0.0000
0.3330
0.0880
0.1950
0.7170

0.1350
0.0000
0.0000
0.0000
0.7100
0.0000
0.1550
0.0000
0.0000
0.0000
0.0000
0.8750
0.1250
0.0000
0.1170
0.2680
0.6140

0.1570
0.2760
0.0640
0.0650
0.1420
0.0300
0.2070
0.0590
0.0940
0.2800
0.6270
0.6490
0.0720
0.2790
0.0000
0.2500
0.7500

0.0510
0.1100
0.1400
0.1430
0.2240
0.2390
0.0420
0.0510
0.6490
0.0720
0.2790
0.7090
0.1130
0.1790
0.1670
0.0000
0.8330

0.1590
0.3330
0.0480
0.0240
0.1070
0.0330
0.2230
0.0740
0.5280
0.1400
0.3320
0.6610
0.1310
0.2080
0.2000
0.8000
0.0000

Cluster Priorities Matrix
Cluster:
Other
Quality
Advertising
Competition

Other
0.198
0.066
0.607
0.129

Quality
0.500
0.000
0.000
0.500

Advertising
0.131
0.000
0.622
0.247

Competition
0.187
0.066
0.533
0.215

44
Weighted Supermatrix
Weighted:

Menu

Cleanli
ness

Speed

Service

Location

Price

Reputa
tion

Take
Out

Portion

Taste

Nutri
tion

Freq
uency

Promo
tion

Creativ
ity

Wendy’s

Burger
King

McDonald’s

Menu Item
Cleanliness
Speed
Service
Location
Price
Reputation
Take-Out
Portion
Taste
Nutrition
Frequency
Promotion
Creativity
Wendy's
Burger King
McDonald ‘s

0.0000
0.1262
0.0384
0.0000
0.0105
0.0232
0.0000
0.0000
0.0151
0.0460
0.0050
0.4554
0.1038
0.0474
0.0401
0.0253
0.0636

0.0000
0.0000
0.4544
0.0473
0.1036
0.0000
0.0000
0.0000
0.0000
0.0000
0.0000
0.0000
0.0000
0.0000
0.1974
0.0987
0.0987

0.0000
0.0000
0.0000
0.1138
0.0000
0.0000
0.0490
0.4426
0.0000
0.0000
0.0000
0.0000
0.0000
0.0000
0.0391
0.1436
0.2118

0.0000
0.3141
0.1725
0.0000
0.0593
0.0000
0.0593
0.0000
0.0000
0.0000
0.0000
0.0000
0.0000
0.0000
0.2082
0.0552
0.1313

0.0000
0.0000
0.0000
0.0000
0.0000
0.0000
0.0000
0.0000
0.0000
0.0000
0.0000
0.0000
0.0000
0.0000
0.0950
0.2500
0.6550

0.0000
0.0000
0.0000
0.0000
0.0990
0.0000
0.0000
0.0990
0.0550
0.0000
0.0110
0.1014
0.5056
0.0000
0.0123
0.0323
0.0845

0.0382
0.0473
0.0164
0.0089
0.0523
0.0123
0.0113
0.0113
0.0185
0.0414
0.0062
0.3338
0.2233
0.0498
0.0130
0.0291
0.0869

0.0000
0.0000
0.1755
0.0333
0.3964
0.0000
0.0000
0.0000
0.0000
0.0000
0.0000
0.0000
0.0000
0.0000
0.0773
0.1226
0.1948

0.0000
0.0000
0.0000
0.0000
0.0000
0.4287
0.0000
0.0715
0.0000
0.0000
0.0000
0.0000
0.0000
0.0000
0.1381
0.0640
0.2976

0.0000
0.0000
0.0000
0.0000
0.0000
0.0000
0.0000
0.0000
0.0000
0.0000
0.0000
0.0000
0.0000
0.0000
0.6044
0.1049
0.2907

0.0000
0.0000
0.0000
0.0000
0.0000
0.0000
0.0000
0.0000
0.0000
0.0000
0.0000
0.0000
0.0000
0.0000
0.5940
0.1570
0.2490

0.0407
0.0000
0.0000
0.0000
0.0257
0.0000
0.0646
0.0000
0.0000
0.0000
0.0000
0.0000
0.3110
0.3110
0.0217
0.0482
0.1771

0.0219
0.0000
0.0000
0.0000
0.0000
0.1091
0.0000
0.0000
0.0000
0.0000
0.0000
0.4149
0.0000
0.2071
0.0217
0.0482
0.1771

0.0177
0.0000
0.0000
0.0000
0.0930
0.0000
0.0203
0.0000
0.0000
0.0000
0.0000
0.5444
0.0778
0.0000
0.0289
0.0662
0.1517

0.0293
0.0516
0.0120
0.0121
0.0265
0.0056
0.0387
0.0110
0.0062
0.0185
0.0413
0.3455
0.0383
0.1485
0.0000
0.0537
0.1611

0.0095
0.0205
0.0261
0.0267
0.0418
0.0446
0.0078
0.0095
0.0428
0.0047
0.0184
0.3773
0.0601
0.0953
0.0359
0.0000
0.1788

0.0297
0.0622
0.0090
0.0045
0.0200
0.0062
0.0417
0.0138
0.0348
0.0092
0.0219
0.3519
0.0697
0.1107
0.0429
0.1718
0.0000

Synthesized:
Global

Menu

Cleanli
ness

Speed

Service

Location

Price

Reputa
tion

Take
Out

Portion

Taste

Nutri
tion

Freq
uency

Promo
tion

Creativ
ity

Wendy’s

Burger
King

McDonald’s

Menu Item
Cleanliness
Speed
Service
Location
Price
Reputation
Take-Out
Portion
Taste
Nutrition
Frequency
Promotion
Creativity
Wendy's
Burger King
McDonald’s

0.0234
0.0203
0.0185
0.0072
0.0397
0.0244
0.0296
0.0152
0.0114
0.0049
0.0073
0.2518
0.1279
0.1388
0.0435
0.0784
0.1579

0.0234
0.0203
0.0185
0.0072
0.0397
0.0244
0.0296
0.0152
0.0114
0.0049
0.0073
0.2518
0.1279
0.1388
0.0435
0.0784
0.1579

0.0234
0.0203
0.0185
0.0072
0.0397
0.0244
0.0296
0.0152
0.0114
0.0049
0.0073
0.2518
0.1279
0.1388
0.0435
0.0784
0.1579

0.0234
0.0203
0.0185
0.0072
0.0397
0.0244
0.0296
0.0152
0.0114
0.0049
0.0073
0.2518
0.1279
0.1388
0.0435
0.0784
0.1579

0.0234
0.0203
0.0185
0.0072
0.0397
0.0244
0.0296
0.0152
0.0114
0.0049
0.0073
0.2518
0.1279
0.1388
0.0435
0.0784
0.1579

0.0234
0.0203
0.0185
0.0072
0.0397
0.0244
0.0296
0.0152
0.0114
0.0049
0.0073
0.2518
0.1279
0.1388
0.0435
0.0784
0.1579

0.0234
0.0203
0.0185
0.0072
0.0397
0.0244
0.0296
0.0152
0.0114
0.0049
0.0073
0.2518
0.1279
0.1388
0.0435
0.0784
0.1579

0.0234
0.0203
0.0185
0.0072
0.0397
0.0244
0.0296
0.0152
0.0114
0.0049
0.0073
0.2518
0.1279
0.1388
0.0435
0.0784
0.1579

0.0234
0.0203
0.0185
0.0072
0.0397
0.0244
0.0296
0.0152
0.0114
0.0049
0.0073
0.2518
0.1279
0.1388
0.0435
0.0784
0.1579

0.0234
0.0203
0.0185
0.0072
0.0397
0.0244
0.0296
0.0152
0.0114
0.0049
0.0073
0.2518
0.1279
0.1388
0.0435
0.0784
0.1579

0.0234
0.0203
0.0185
0.0072
0.0397
0.0244
0.0296
0.0152
0.0114
0.0049
0.0073
0.2518
0.1279
0.1388
0.0435
0.0784
0.1579

0.0234
0.0203
0.0185
0.0072
0.0397
0.0244
0.0296
0.0152
0.0114
0.0049
0.0073
0.2518
0.1279
0.1388
0.0435
0.0784
0.1579

0.0234
0.0203
0.0185
0.0072
0.0397
0.0244
0.0296
0.0152
0.0114
0.0049
0.0073
0.2518
0.1279
0.1388
0.0435
0.0784
0.1579

0.0234
0.0203
0.0185
0.0072
0.0397
0.0244
0.0296
0.0152
0.0114
0.0049
0.0073
0.2518
0.1279
0.1388
0.0435
0.0784
0.1579

0.0234
0.0203
0.0185
0.0072
0.0397
0.0244
0.0296
0.0152
0.0114
0.0049
0.0073
0.2518
0.1279
0.1388
0.0435
0.0784
0.1579

0.0234
0.0203
0.0185
0.0072
0.0397
0.0244
0.0296
0.0152
0.0114
0.0049
0.0073
0.2518
0.1279
0.1388
0.0435
0.0784
0.1579

0.0234
0.0203
0.0185
0.0072
0.0397
0.0244
0.0296
0.0152
0.0114
0.0049
0.0073
0.2518
0.1279
0.1388
0.0435
0.0784
0.1579

Limiting Supermatrix

{

Relative local weights: Wendy’s= 0.156, Burger King =0.281, and McDonald’s=0.566

45
Validation

The same problem worked as a simple and
a complex hierarchy and as a feedback network.

46
Hamburger Model
Synthesized Local:
Other

Quality

Synthesized Local Cont’d:
Menu Item
Cleanliness
Speed
Service
Location
Price
Reputation
Take-Out
Portion
Taste
Nutrition

Simple Hierarchy
(Three Level)
Wendy’s
Burger King
McDonald’s

0.3055
0.2305
0.4640

0.132
0.115
0.104
0.040
0.224
0.138
0.167
0.086
0.494
0.214
0.316

Advertising
Competition

Complex Hierarchy
(Several Levels)
0.1884
0.2689
0.5427

Frequency
Promotion
Creativity
Wendy’s
Burger King
McDonald’s

Feedback
Network
0.156
0.281
0.566

47

0.485
0.246
0.267
0.156
0.281
0.566

Actual
Market
Share
0.1320
0.2857
0.5823
48
Strategic Planning
for the Future of the
University of Pittsburgh Medical Center
Using the Analytic Network Process(ANP)

49
Evaluate Strategies for the University Health Network to Compete in a Managed Care Environment

Benefits Control Model

Costs Control Model

B e n e f it s
S o c ia l

Social
Benefits
Network
Submodel

Risks Control Model

C o s ts

E c o n o m ic

P o lit ic a l

S o c ia l

Economic
Benefits
Network
Submodel

Political
Benefits
Network
Submodel

Social
Costs
Network
Submodel

E c o n o m ic

Economic
Costs
Network
Submodel

R is k s
P o lit ic a l

Political
Costs
Network
Submodel

S o c ia l

E c o n o m ic

Social
Risks
Network
Submodel

50

Economic
Risks
Network
Submodel

P o lit ic a l

Political
Risks
Network
Submodel
List of Clusters and Elements (Not all the Clusters appear in all 9 of the sub-models.)
Cluster Names

Cluster Elements

Clients

Businesses- businesses that offer employees health care plans
Consumers- individuals who purchase their own health coverage
Insurers- companies who sell health insurance
Competition
Competitors- other hospitals in Pittsburgh that compete w/ UPMC
Convenience
Time- expended by customer scheduling, traveling, and actual waiting room
Safety- safety of location
Internal Stakeholders
Physicians- working for UPMC
Administrators- planners, managers, decision makers of UPMC
Alliances- outside organizations, involved: isurers, hospitals, physician networks
Staff- non-physician, non-administrative personel
Public Relations
Public Relations- UPMC’s public image: TV, Newspaper, Radio
Quality
Specialty quality non-general health services,
Diversity- range of health services offered by UPMC
Care- quality of general health services
Research- quality of research at UPMC
*Strategies
Improve and Measure Outcomes- measure effectiveness to improve service
Capitalization- negotiated insurance contracts with fixed payments
Develop a Primary Network- increase number of primary care physicians
Internal Cost Reduction- cut facilities, employees, and high cost procedures
Teach Primary Care- shift focus from curative care to preventive care
Variety of Services
Internal Medicine and Surgery- Curative specialty services and hospitalization
Cancer Treatment- cancer treatment cure
Outpatient Care- preventive care and short term medical treatments
*Strategies apperar in every sub-moadel as alternatives of choice

51
Clusters and Elements in the Economic Benefits Sub-model

52
Benefits & Costs
Predicting the Superbowl Winner ‘96 & ‘97

53
Pre-start (early December 1995)
Wild Card Games

Benefits

Costs

B/C

Miami vs.
Buffalo

1996 Playoffs

Team

0.701
0.745

0.612
0.590

1.145
1.263

Indianapolis vs.
San Diego

0.687
0.660

0.622
0.650

1.105
1.015

Detroit vs.
Philadelphia

0.625
0.695

0.636
0.580

0.983
1.198

Atlanta vs.
Green Bay

0.590
0.785

0.612
0.515

All predictions correct except for two games below.

0.964
1.524

Second Round
Pittsburgh vs.
Buffalo

0.740
0.704

0.581
0.605

1.274
1.164

Indianapolis vs.
Kansas City

0.695
0.750

0.590
0.575

1.178
1.304

Kansas kicker missed 3 field goals & ruined them.
No way to know his ailments that day.

Green Bay vs.
San Francisco

0.755
0.751

0.590
0.585

1.280
1.284

Was too close to determine the winner.
Green Bay won.

Philadelphia vs.
Dallas

0.732
0.759

0.641
0.576

1.142
1.318

Divisional Playoffs
Dallas vs.
Green Bay

0.742
0.756

0.540
0.561

1.370
1.350

Pittsburgh vs.
Indianapolis

0.699
0.741

0.555
0.598

1.260
1.240

The Super Bowl
Dallas vs.
Pittsburgh

0.761
0.748

0.728
0.735

1.045
1.018

54
Pre-start (early December 1996)
The first predictions were wrong
on three games which then
required revision.

Playoff Predictions
Pre-Start

Predicted Outcomes
AFC

1997 Playoffs

Team

Benefits

Costs

B/C

Winner

Las Vegas

Wild Cards
Indianapolis
Pittsburgh

0.588
0.592

0.489
0.477

1.2
1.24

Pittsburgh

Jacksonville
Buffalo

0.601
0.594

0.501
0.487

1.2
1.22

Buffalo

Wrong prediction.

Pittsburgh
New England

0.609
0.516

0.479
0.419

1.27
1.23

Pittsburgh

Wrong prediction.

Buffalo
Denver

0.551
0.62

0.488
0.447

1.13
1.39

Denver

Wrong prediction.

Pittsburgh
Denver

0.633
0.686

0.523
0.5318

1.21
1.29

Denver

Philadelphia
San Francisco

0.557
0.621

0.467
0.444

1.19
1.4

San Francisco

Minnesota
Dallas

0.545
0.571

0.488
0.476

1.12
1.2

Dallas

San Francisco
Green Bay

0.585
0.685

0.5
0.46

1.17
1.49

Green Bay

Dallas
Carolina

0.522
0.51

0.494
0.448

1.06
1.14

Carolina

Carolina
Green Bay

0.511
0.643

0.498
0.521

1.03
1.23

Green Bay

0.618
0.556

0.457
0.476

1.35
1.17

Green Bay

Conference Finals

NFC
Wild Cards

Conference Finals

Super Bowl
Green Bay
Denver

55
Post-start (before Conference Finals)

Playoff P
redictions

A gains error in one game.

Predicted Outcomes
AFC
Team

Benefits

Costs

B/C

Winner

Actual

Conference Finals
Jacksonville
Denver

0.545
0.612

0.488
0.447

1.12 Denver
1.37

Jacksonville
New England

0.576
0.645

0.515
0.519

1.12 New Eng
1.24
NE

0.627
0.653

0.554
0.506

1.13
1.29 Green Bay

Jax

Super Bowl
New England
Green Bay

56
The Benefits

The Costs

57
Benefits Supermatrix
Local Weights
Offense

QB Ability
Running
Emotions Play Above
Ability
Coaching
Emotional State
Outside Home Field
Road Ahead
Teams
Dallas
Green Bay

Offensive
Global
0.0297
0.3140

Local
0.0864
0.9136

0.0037
0.0235
0.0923
0.0433
0.3670
0.1227
0.0039

0.0309
0.1962
0.7724
0.1055
0.8945
0.9693
0.0308

QB Ability

Emotions
Running Play Above
1.0000

Outside
Coaching
0.8000
0.2000

Emotions
1.0000

Home Field
.8000
.2000

Road Ahead
1.0000

Teams
Dallas Green Bay
0.8000
0.2000

1.0000
0.7500
0.2500
1.0000

1.0000

1.0000

1.0000
0.7500
0.2500

1.0000

CLUSTER WEIGHTS
Offense
Offense
0.0000
Emotions 0.2176
Outside
0.0914
Team
0.6910

Emotions
0.2449
0.0000
0.0902
0.6648

Outside
0.6442
0.0852
0.0000
0.2706

Teams
0.7172
0.1947
0.0881
0.0000

58

1.0000

1.0000
1.0000

0.2000
0.8000
Weighted Supermatrix
Cluster Weights
Offense

QB Ability
Running
Emotions Play Above
Ability
Coaching
Emotional State
Outside Home Field
Road Ahead
Teams
Dallas
Green Bay

Offensive
Global
0.0297
0.3140

Local
0.0864
0.9136

0.0037
0.0235
0.0923
0.0433
0.3670
0.1227
0.0039

0.0309
0.1962
0.7724
0.1055
0.8945
0.9693
0.0308

QB Ability

Emotions
Running Play Above
0.7308

Coaching
0.1959
0.0490

Outside
Emotions
0.7308

Home Field
0.5154
0.1288

Teams

Road Ahead

Dallas Green Bay
0.7125
0.1781

0.6442

0.0852
0.0639
0.0213
1.0000

1.0000

0.2692

0.0902
0.4986
0.1662

0.6885
0.3115

0.0538
0.2153
0.2706

0.0219
0.0875

0.2706

Limiting Benefits Supermatrix
Offensive

Offense
Emotions

Outside
Teams

QB Ability
Running
Play Above
Ability
Coaching
Emotional State
Home Field
Road Ahead
Dallas
Green Bay

Emotions

Global
0.0297
0.3140

Local
0.0297
0.3140

QB Ability
0.0297
0.3140

0.0037
0.0235
0.0923
0.0433
0.3670
0.1227
0.0039

0.0037
0.0235
0.0923
0.0433
0.3670
0.1227
0.0039

0.0037
0.0235
0.0923
0.0433
0.3670
0.1227
0.0039

Running Play Above
0.0297
0.0297
0.3140
0.3140
0.0037
0.0235
0.0923
0.0433
0.3670
0.1227
0.0039

0.0037
0.0235
0.0923
0.0433
0.3670
0.1227
0.0039

Outside

Teams

Coaching
0.0297
0.3140

Emotions
0.0297
0.3140

Home Field
0.0297
0.3140

0.0037
0.0235
0.0923
0.0433
0.3670
0.1227
0.0039

0.0037
0.0235
0.0923
0.0433
0.3670
0.1227
0.0039

0.0037
0.0235
0.0923
0.0433
0.3670
0.1227
0.0039

59

Road Ahead
0.0297
0.3140
0.0037
0.0235
0.0923
0.0433
0.3670
0.1227
0.0039

Dallas Green Bay
0.0297 0.0297
0.3140 0.3140
0.0037
0.0235
0.0923
0.0433
0.3670
0.1227
0.0039

0.0037
0.0235
0.0923
0.0433
0.3670
0.1227
0.0039
Costs Supermatrix
Local Weights

Offense
History
Outside
Teams

Road Ahead
Immature Players
Not Full Strength
Cinderella
Play Bey Ability
Past Failures
Mental State
Weather
Dallas
Green Bay

Offensive

Global
0.1529
0.0000
0.2261
0.0011
0.2002
0.0738
0.0121
0.1683
0.1653
0.0000

Local
0.4034
0.0000
0.5966
0.0041
0.7278
0.2683
0.0673
0.9332
1.0002
0.0000

Emotions

Immature Not Full
Road Ahead Players Strength

Outside

Cinderella
1.0000

Play
beyond
Past
Mental
Ability Failures State
0.8000
0.8000
0.2000

1.0000 0.2000
1.0000

0.8333
0.1667
0.8571
0.1429

1.0000

Emotions
0.3614
0.0000
0.0650
0.5736

1.0000
1.0000

Outside
0.6267
0.0936
0.0000
0.2797

Weather
1.0000
0.7500
0.2500

1.0000

CLUSTER WEIGHTS
Offense
Offense
0.0000
Emotions 0.0877
Outside
0.1392
Team
0.7731

Teams

Teams
0.7172
0.1947
0.0881
0.0000

60

1.0000

Dallas Green Bay
0.7500
0.2000
0.2500 0.8000
0.7500
0.2500
1.0000
0.8333 1.000
0.1667
Weighted Supermatrix
Cluster Weighted

Offense
History
Outside
Teams

Road Ahead
Immature Players
Not Full Strength
Cinderella
Play Bey Ability
Past Failures
Mental State
Weather
Dallas
Green Bay

Offensive

Global
0.1529
0.0000
0.2261
0.0011
0.2002
0.0738
0.0121
0.1683
0.1653
0.0000

Local
0.4034
0.0000
0.5966
0.0041
0.7278
0.2683
0.0673
0.9332
1.0002
0.0000

Emotions

Immature Not Full
Road Ahead Players Strength

Outside

Cinderella
1.0000

Play
beyond
Past
Mental
Ability Failures State
0.2891
0.5014
0.0723

Weather

1.0000 0.1253
0.0936

0.8333
0.1667
1.0000

Teams

0.6267
0.0702
0.0234

0.8571
0.1429
0.2797

Dallas Green Bay
0.5379
0.1434
0.1793 0.5738
0.1947
0.0734
0.0147

0.2797

Limiting Costs Supermatrix
Offensive

Offense
History
Outside
Teams

Road Ahead
Immature Players
Not Full Strength
Cinderella
Play Bey Ability
Past Failures
Mental State
Weather
Dallas
Green Bay

Emotions

0.1460
0.0487
0.0881

Outside

Teams

Global
Local
0.1529 0.1529

Immature Not Full
Road Ahead Players Strength
0.1529
0.1529 0.1529

Cinderella
0.1529

Play
beyond
Ability
0.1529

Weather
0.1529

Dallas
0.1529

Green Bay
0.1529

0.0000 0.0000

0.0000

0.0000 0.0000

0.0000

0.0000 0.0000 0.0000 0.0000

0.0000

0.0000

0.2261
0.0011
0.2002
0.0738
0.0212
0.1683
0.1653
0.0000

0.2261
0.0011
0.2002
0.0738
0.0212
0.1683
0.1653
0.0000

0.2261
0.0011
0.2002
0.0738
0.0212
0.1683
0.1653
0.0000

0.2261
0.0011
0.2002
0.0738
0.0212
0.1683
0.1653
0.0000

0.2261
0.0011
0.2002
0.0738
0.0212
0.1683
0.1653
0.0000

0.2261
0.0011
0.2002
0.0738
0.0212
0.1683
0.1653
0.0000

0.2261
0.0011
0.2002
0.0738
0.0212
0.1683
0.1653
0.0000

0.2261
0.0011
0.2002
0.0738
0.0212
0.1683
0.1653
0.0000

0.2261
0.0011
0.2002
0.0738
0.0212
0.1683
0.1653
0.0000

Past
Mental
Failures State
0.1529 0.1529
0.2261
0.0011
0.2002
0.0738
0.0212
0.1683
0.1653
0.0000

0.2261
0.0011
0.2002
0.0738
0.0212
0.1683
0.1653
0.0000

61

0.2261
0.0011
0.2002
0.0738
0.0212
0.1683
0.1653
0.0000
Benefits Intensity Priorities
Quarterback (0.030):
Average (0.091)
Running Game (0.314):
Average (0.084)

Good (0.281)
Good (0.211)GB

Play Above Potential (0.004):
Average (0.075)
Good (0.229)D
Coaching Ability
to Inspire (0.023):
Not A lot (0.078)
Emotional State (0.092):
Apathy (0.082)
Home Field
Advantage (0.043):
Neutral (0.105)
The Road Ahead (0.367):
No Effect (0.082)

Somewhat (0.205)D

High Ability (0.691)GB,D
High Ability (0.705)D
High Play Level (0.696)GB

Heroic (0.717)GB

Mediocre (0.236)

Excitement (0.682)GB,D

Some Effect (0.258)GB

Significant
Effect (0.637)D

Some Effect (0.236)D

Very
Confident (0.682)GB

Dallas’ Effect on the Ultimate
Outcome (0.123):
Medium (0.280)
Low Effect (0.094)

Greatly
Influenced (0.627)GB,D

Green Bay’s Effect on the Ultimate
Outcome (0.004):
Medium (0.258)
Not Much (0.105)

Greatly
Influenced (0.637)GB,D

Costs Intensity Priorities
The Road Ahead (0.153):
Low Effect (0.085)

Somewhat (0.271)GB,D

High Effect (0.644)

Not at Full Strength
(0.226):
Few Injuries (0.091)

Some
Injuries (0.218)

Big Injury
Problems (0.644) GB,D

Playing Beyond Ability (0.200):
Not a factor (0.094) GB,D
May Falter (0.288)

Venerable (0.627)

Past Failures (0.074):
Good History (0.082) GB

Can’t get
it Gone (0.682)

Mental State
of Preparedness (0.012):
Ready (0.122)GB

Mixed Past (0.236)D
May be
Hurt (0.230)D

Unready (0.648)

Cinderalla Team (0.001): Good Team
Not Cinderalla (0.082) GB,D Lucky (0.236)

It’s Midnight (0.682)

Weather Sensitivity (0.168): Small
Anything Goes (0.095)D
Sensitivity (0.250)GB

High
Sensitivity (0.655)

Dallas’ Effect (0.165):
Small (0.163)

High (0.540)GB,D

Medium (0.297)

Green Bay’s Effect (0.000)
Small (0.105)D
Medium (0.258)

Big Effect (0.637)GB

Immature Players (0.000)
Some
Veterans (0.082)D
Experience (0.236)GB

Young
Players (0.682)

Each of the two teams obtained a total score from the intensities.

62
Illustrative Considerations in the Evaluation
of 1996 Dallas - Green Bay Game
For the Benefits Model:
- With respect to Green Bay, Quarterback is equally to moderately more important than Dallas. Here we
are comparing an aspect of the Green Bay team to their opponent, Dallas effectively, we are asking
ourselves, which is more important to Green Bay’s success, the fact that they have Brett Favre, or the fact
that they are playing Dallas. The judgment was made that while Favre is an outstanding quarterback, the
fact that he is facing Dallas may be enough to counteract his abilities.
- With respect to Dallas, the Road Ahead is strongly more important than Home Field Advantage. The
Road Ahead refers to future games that the team may have to play if the team continues on. Here, the
relative ease of the road ahead for Dallas, based on the record of the AFC in the Super Bowl, causes it to
be less important than the fact that Dallas is playing Green Bay, possibly its biggest obstacle to winning
the Super Bowl, on its home turf.
- With respect to Dallas, Running Game is equally to moderately stronger than Quarterback. This
judgment is based on the fact that while Dallas’ quarterback is excellent the team’s Running Game is
quite often the league’s best.
- With respect to Dallas, Quarterback is strongly to very strongly more important than Coaching
Inspiration. The basis for this is the fact that Barry Switzer has exhibited no great gift for inspiration, the
team simply is full of talent, especially in the quarterback position.

63
For the Costs Model:
- With respect to Green Bay, Mental State is strongly more important than Weather Sensitivity, simply because Green Bay’s Mental State could be more easily called
into question (may not be tough enough) than their Weather Sensitivity (they are very insensitive to poor weather conditions.
- With respect to Dallas, Mental State is moderately more important than Weather Sensitivity. While the team is not highly Weather Sensitive, their arrogant attitudes
causes us a bit of concern that it may be their undoing.
- With respect to Green Bay, Not at Full Strength is moderately more important than The Road Ahead. The basis for this being that Reggie White, a very important
player on the team, is not 100%, and this is likely to have a larger impact than any AFC team that Green Bay might meet in the Super Bowl because, as we stated
before, AFC teams do not traditionally pose a threat. Conversely, if we looked at an AFC matchup, the Road Ahead would in most cases have a large impact due to the
fact that the AFC teams are usually unsuccessful against the NFC teams in the Super Bowl.
- With respect o Green Bay, Dallas is strongly more important than Cinderella. This translates to mean that any Cinderella story that Green Bay may be enjoying is
likely to be overshadowed by the fact that they are playing Dallas. While Green Bay is not widely considered to be a Cinderella, the label would have a larger effect on
a team like the Indianapolis Colts when they played Kansas City.
- With respect to Dallas, Not at Full Strength is strongly more important than Immature Players. While Dallas has many veterans, its biggest problem in this
comparison could be injuries to key players such as Charles Haley.
- With respect to Dallas, Past Failures are equally important as Play Beyond Ability. Not only is Dallas playing up to its potential, it has a few grave failures of the
past to look back on.
- Now that we have looked at several examples of judgments, we can move on to the results of the model. The elements in the model are given weights based on our
judgment. We can rate the teams using information that we have collected. For instance, if Green Bay’s passing statistics are traditionally low against Dallas, Green
Bay’s likelihood of success against Dallas is comprised by the fact that the team relies heavily on that kind of play. We determined that passing is important to Green
Bay in our judgments, and find that their passing suffers against Dallas in the statistical data that we collected.

Conclusion
It is our hope to use this model to forecast future Super Bowl competitions. Undoubtedly, there will be additional modifications. This basic ideas learned here can be
used to forecast the outcome of other competitive games. It appears that the use of intangibles is significantly more important in the forecast than the strict accuracy
of the statistics, although one cannot do without the statistics which tell more about performance than about attitude and environment.

64
Prediction of the 1997 Australian Tennis Open
Two models were used to predict the matches for the top 16 ranked players in the tournament. In the first
model, a feedback network modeled past performance. Here, we examined performances of players in
previous tournaments. The factors and weights were then included in the second model.
In the second model, a hierarchy was developed to model the intensities that will be used in the ratings
module to rate the players. Past Performance from the network model in the first stage was the first
criterion added. Another two criteria: Technique and Conditioning were also included.
Prediction:
7 of the top 8 players were correctly predicted to meet in the final rounds of the tournament with the final
between Sampras and Chang. In reality, the final was a match between Moya and Sampras, with the top
seed winning the outcome. As Moya was ranked 58th in the world prior to the start of the tournament, he
was not even included in the model.

65
Sampras
Chang
Becker
Agassi
Ivanisevic
Krajicek
Muster
Courier
Kafelnikov
Martin
Washington
Enqvist
Ferreira
Rios
Costa
mantilla

0.658
0.638
0.516
0.512
0.483
0.460
0.468
0.462
0.438
0.422
0.421
0.398
0.374
0.366
0.334
0.329

66
Hong Kong Competes with Singapore
and somewhat less with Tokyo
as Financial Center in Asia
in the 21st Century

Gang Hu (Tianjin), Chia-Shuan Huang (Taiwan), Hong Li (Beijing), Thomas Saaty (Pittsburgh),
Torsten Schmidt (Germany), and Yu-Chan Wang (Taiwan).

67
The Purpose
The purpose of this project is to study the potential impact imposed through the takeover of Hong
Kong by China in 1997. The analysis focuses on the following questions:
• What set of criteria does an Asian location have to meet in order to be a Financial Center?
• Which city is the best candidate for the Financial Center in the Asia-Pacific region in 1996?
• What is the most likely policy of the Chinese government towards Hong Kong after 1997?
• What impact does the Chinese policy have towards Hong Kong as a Financial Center?
• Which city is the most likely candidate to be the Financial Center is the Asia-Pacific region in
the year 2000?

68
The Approach
These five questions are studied with the methodology and technique provided by a combination
of the AHP and ANP. A dual-model approach was developed. The first model, the “Financial
Center model” which is an ANP model, was used to examine the first two of the above questions.
The second model, the “Mainland China Policy model” is an AHP model, used to focus on the
third question above to generate a policy package most likely to be adopted by the Chinese
government. Based on changed in the political, economic, and social environments incurred by the
estimated policy package, the “Financial Center model” was re-evaluated. The fourth and fifth
questions above are thus answered.
The two models complement one another because:
1. The Financial Center model provides the relevant factors for a focused examination
under the China model in order to find the relevant factors which may be changed by
the Chinese government, and
2. The China model provides a package of feasible (for mainland China) and likely
policies to be adopted by the Chinese government after 1997. Based on the package of
policies, a second evaluation of the Financial Center model was made in order to
estimate the future status of Hong Kong as a Financial Center.

69
Influencing Factors
A).Economic-Benefits:
1. Geographic advantage.
2. Free flow of information.
3. Free flow of people.
4. Free flow of capital.
5. Internationalization.
6. Investment.
7. Educated workforce.
8. Convertible currencies.
9. Assistance from government.
11. Modern infrastructure.
12. Deregulated market.
B).Political-Benefits:
1. Efficient government.
2. Independent legal system.
3. Assistance from government.
4. Free flow of people.
5. Free flow of information.
C).Social-Benefits:
1. Free flow of people.
2. Free flow of information.
3. Educated workforce.
4. Open culture.
5. Internationalized language.
6. Availability of business
professionals.
D).Economic-Costs:
1. Labor cost.
2. Corruption.
3. Protection from government.
4. Operating cost.
5. Tax.
E).Political-Costs:

1. Tax.
2. Corruption.
3. Protection from government.
F).Social-Costs:
1. Environment.
2. Corruption.
3. Protection from government.
G).Economic-Opportunities:
1. Investment.
2. Access to potential market.
3. Regional economic growth,
membership of international
organizations (GATT.WTO).
H).Political- Opportunities:
1. Political credit.
2. Investment.
3. Membership of international
organization (GATT,WTO).
I).Social-Opportunities:
1. Social wealth.
2. Access to potential market.
J).Political-Risks:
1. Political instability.
2. Instability of local government.
3. Political restriction.
K).Economic-Risks:
1. Instability of local financial market.
2. Inflation.
3. Competition from local business.
L).Social-Risks:
1. Industry resistance.
2. Public industry.
3. Instability of local society.

70
The Set of Four Control Hierarchies
Benefits Control Model

Opportunities Control Model

*
Risks Control Model

Costs Control Model

*
71
72

Costs

Benefits
73

Risks

Opportunities
Economic Benefits Sub-Model

74
Results
There are twelve supermatrices associated with the
complete model. With each of these supermatrices
is associated a cluster priority matrix, a weighted
supermatrix, and a limiting supermatrix from which
the priorities of the three contending centers are
derived. These twelve sets of priorities are
weighted by the priorities of the corresponding
control criteria and summed to obtain the final
ranking.

75
The output from the first Financial Center model
We assume that all the situation will remain the same after 1997. In other words, the
main land China government will adopt a set of feasible policies toward Hong Kong. Based on
this assumption, we made the judgments. After synthesis, we got the results below:
Opportunities

Benefits
Economic

Political

Social

Hong Kong

0.4131

0.5034

0.4416

Singapore

0.2836

0.1503

0.2164

Tokyo

0.3033

0.3465

0.342

Political
0.3813
0.2935
0.3252

Social
0.4511
0.2227
0.3261

Economic Political
0.3086
0.4278
0.2186
0.4387
0.4728
0.1335

Social
0.4387
0.2365
0.3248

Risks

Costs
Hong Kong
Singapore
Tokyo

Hong Kong
Singapore
Tokyo

Economic
0.4096
0.2874
0.303

Economic Political
0.2393
0.1922
0.2804
0.3625
0.4803
0.4453

Social
0.2519
0.1803
0.5678

Hong Kong
Singapore
Tokyo

The overall result is listed below:
Alternatives
Hong Kong
Singapore
Tokyo

Rank

(B*O)/(C*R)
1
1.6498
2
0.906
3
0.5338

It is clear that Hong Kong has the highest priority, which means if mainland China
government adopt all the policies described above toward Hong Kong, it will remain to be the
financial center in the Asia-Pacific region.

76
Likely Policies Followed by China
Affecting the Future of Hong Kong
About 50 potential Chinese policies were identified and
ranked in a hierarchy. The most likely policies were
identified and the network sub-models were re-assessed
given this information. The hierarchy and the policies are
shown next.

77
Sample Hierarchy for Assessing Benefit Intensities

78
Policy Rating

79
The output from the Chinese policies model
We picked 18 different factors (in the Financial Center model) which are highly
dependent on the policies of the mainland China government. For each of the factors, we divided
it into three situations(positive +, mutual 0, negative -), which denote the different Chinese
policies toward it. And then, we put them into the China government model(absolute hierarchy
model, including four sub-model: benefits, costs, opportunities and risks). After synthesis, we
got the overall score for each policy. Based on the scores, we draw the optimal and most likely
policies package(it is shown below).
1
2
3
4
5
6
7
8
9
10
11
12
13
14
15
16
17
18

Optimal and most likely policies
free flow of information 0
free flow of people 0
educated workforce +
convertible currency +
deregulated market 0
assistance from government +
inflation +
independent legal system 0
political restrcitions 0
instability of local society +
availability of business professionals +
public insecurity +
corruption +
tax +
protectionist barrier 0
investment +
political credit +
access to potential market +

80
The output from the second Financial Center model
Based on the optimal and most likely policies package we got, we made another set of
judgments for the Financial Center model. This is, with the assumptions we have made, an
estimation of the location of the financial center in the Asian-Pacific region. The results are
listed below:
Benefits

Hong Kong
Singapore
Tokyo

Opportunities

Economic Political
0.3814
0.4435
0.2992
0.2187
0.3194
0.3378

Social
0.4238
0.2306
0.3456

Costs
Hong Kong
Singapore
Tokyo

Hong Kong
Singapore
Tokyo

Economic
Political
0.4096
0.3813
0.2874
0.2935
0.303
0.3252

Social
0.4511
0.2227
0.3261

Economic
Political
0.4278
0.4278
0.4387
0.4387
0.1335
0.1335

Social
0.4387
0.2365
0.3248

Risks

Economic
Political
0.2966
0.2814
0.2561
0.3161
0.4475
0.4025

The overall result is as below

Social
0.3045
0.1657
0.5298

Alternatives
Hong Kong
Singapore
Tokyo

Hong Kong
Singapore
Tokyo

Rank

(B*O)/(C*R)
1
1.1822
2
1.1093
3
0.5949

We can see that Hong Kong can still maintain the financial center status after 1997, but
the gap between Hong Kong and other cities is much smaller. Especially, Singapore becomes
very competitive.

81
Original Economic Benefits Sub-Model Supermatrix
(Truncated to save space)

Economic Benefits
Local:

Sing

Toky

Hong

assi

free

conv

mode

good

dere

Singapore

0

0

0

0.3196

0.1692

0.1396

0.1692

0.3333

0.2081

Tokyo

0

0

0

0.122

0.4434

0.5278

0.4434

0.3333

0.1311

Hong Kong

0

0

0

0.5584

0.3874

0.3325

0.3874

0.3333

0.6608

0.0538

0.0459

0.0501

0

0

0

0

0

0.044

0.0526

0.0369

0

0

0

0

0

convertible currency

0.0379

0.0796

0.0625

0

0

0

0

0

modern infrastructure

0.0843

0.189

0.0925

0

0

0

0

0

good auditing systems

0.105

0.0801

0.0619

0

0

0

0

0

deregulated market

0.0367

0.0296

0.1166

0

0

0

0

0

geographic advantages

0.1713

0.1599

0.1593

0

0

0

0

0

free flow of information

0.0168

0.0837

0.0594

0

0

0

0

0

free flow of capital

0.1389

0.0917

0.0928

0

0

0

0

0

educated workforce

0.0602

0.0996

0.0537

0

0

0

0

0

internationalized language

0.0961

0.0283

0.0555

0

0

0

0

0

investment from outside

0.1551

0.06

0.1588

0

0

0

0

0

assistance from government
free flow of people

82
Weighted Economic Benefits Sub-Model Supermatrix
(Truncated to save space)

Economic Benefits
Weighted:

Sing

Toky

Hong

assi

free

conv

mode

good

dere

Singapore

0

0

0

0.3196

0.1692

0.1396

0.1692

0.3333

0.2081

Tokyo

0

0

0

0.122

0.4434

0.5279

0.4434

0.3333

0.1311

Hong Kong

0

0

0

0.5584

0.3874

0.3325

0.3874

0.3333

0.6608

0.0538

0.0459

0.0501

0

0

0

0

0

0.044

0.0526

0.0369

0

0

0

0

0

convertible currency

0.0379

0.0796

0.0625

0

0

0

0

0

modern infrastructure

0.0843

0.189

0.0925

0

0

0

0

0

good auditing systems

0.105

0.0801

0.0619

0

0

0

0

0

deregulated market

0.0367

0.0296

0.1166

0

0

0

0

0

geographic advantages

0.1713

0.1599

0.1593

0

0

0

0

0

free flow of information

0.0168

0.0837

0.0594

0

0

0

0

0

free flow of capital

0.1389

0.0917

0.0928

0

0

0

0

0

educated workforce

0.0602

0.0996

0.0537

0

0

0

0

0

internationalized language

0.0961

0.0283

0.0555

0

0

0

0

0

investment from outside

0.1551

0.06

0.1588

0

0

0

0

0

assistance from government
free flow of people

83
Limiting Economic Benefits Sub-Model Supermatrix
(Truncated to save space)

Economic Benefits
Synthesized: Global

Sing

Toky

Hong

assi

free

conv

mode

good

dere

Singapore

0.2836

0.2836

0.2836

0.2836

0.2836

0.2836

0.2836

0.2836

0.2836

Tokyo

0.3033

0.3033

0.3033

0.3033

0.3033

0.3033

0.3033

0.3033

0.3033

Hong Kong

0.4131

0.4131

0.4131

0.4131

0.4131

0.4131

0.4131

0.4131

0.4131

assistance from government

0.0499

0.0499

0.0499

0.0499

0.0499

0.0499

0.0499

0.0499

0.0499

free flow of people

0.0437

0.0437

0.0437

0.0437

0.0437

0.0437

0.0437

0.0437

0.0437

convertible currency

0.0607

0.0607

0.0607

0.0607

0.0607

0.0607

0.0607

0.0607

0.0607

modern infrastructure

0.1194

0.1194

0.1194

0.1194

0.1194

0.1194

0.1194

0.1194

0.1194

good auditing systems

0.0796

0.0796

0.0796

0.0796

0.0796

0.0796

0.0796

0.0796

0.0796

deregulated market

0.0676

0.0676

0.0676

0.0676

0.0676

0.0676

0.0676

0.0676

0.0676

geographic advantages

0.1629

0.1629

0.1629

0.1629

0.1629

0.1629

0.1629

0.1629

0.1629

free flow of information

0.0547

0.0547

0.0547

0.0547

0.0547

0.0547

0.0547

0.0547

0.0547

free flow of capital

0.1055

0.1055

0.1055

0.1055

0.1055

0.1055

0.1055

0.1055

0.1055

educated workforce

0.0695

0.0695

0.0695

0.0695

0.0695

0.0695

0.0695

0.0695

0.0695

internationalized language

0.0588

0.0588

0.0588

0.0588

0.0588

0.0588

0.0588

0.0588

0.0588

investment from outside

0.1278

0.1278

0.1278

0.1278

0.1278

0.1278

0.1278

0.1278

0.1278

84
Normalized by Cluster - Results from Limiting
Economic Benefits Sub-Model Supermatrix
Economic Benefits
Synthesized Local:
Singapore

0.2836

Tokyo

0.3033

Hong Kong

0.4131

assistance from government

0.0499

free flow of people

0.0437

convertible currency

0.0607

modern infrastructure

0.1194

good auditing systems

0.0796

deregulated market

0.0675

geographic advantages

0.1629

free flow of information

0.0547

free flow of capital

0.1055

educated workforce

0.0695

internationalized language

0.0588

investment from outside

0.1278

85
The Result
• The first result from the Financial Center model:
•If the Chinese government is able to maintain the current status of Hong Kong, Hong Kong
would still be the Financial Center is the Asia-Pacific region in 2000.
• The first result from the Mainland China Policy model:
•For interests of the mainland Chinese government, no negative policy should be adopted towards
Hong Kong after 1997. A careful and sensitive approach towards the future Hong Kong policy is
suggested by this result, which is also reinforced by the next result.
• The second result from the Financial Center model:
•Although Hong Kong may still be the best choice for a Financial Center, Singapore will become
a strong competitor for the Center in 2000.

86
Conclusions
1) Based on the first output of our Financial Center model, we can see that if all conditions remain the
same, in other words, if China adopts all the positive policies toward Hong Kong, in other words if the
Chinese government is able to maintain or even improve the current status of Hong Kong, it is quite sure
that Hong Kong will remain one of the important financial centers in the Asia-Pacific region.
2) Among the influencing factors of the financial center status, many of them are dependent directly on
the government’s policies. Therefore, Hong Kong’s future as a financial center is highly dependent on
the political attitude of the Chinese government.
3) Based on the result of our mainland China policy model, we found, among the 18 factors, the
Chinese government should adopt positive policies on 12 of them, and mixed policies on 6 of them. In
other words, for the interests of China itself (not Hong Kong), China should avoid implementing
negative policies, as defined in this study towards Hong Kong as a financial center.
4) Based on the second output of the Financial Center model, Hong Kong will maintain its financial
status after 1997. But at the same time, Singapore will become very competitive. Therefore, our
conclusion is that if Chinese government adopts rational policies toward Hong Kong as estimated in this
study, Hong Kong will remain the number one financial center of the Asian-Pacific region. But at the
same time, the position of Hong Kong as a financial center will be weakened. If any negative policies
are implemented, Singapore will become the number one financial center of this Asia-Pacific region
followed by Hong Kong.

87
Feedback Measurement as the Limiting Power of the Supermatrix
The eigenvectors of the paired comparison matrices are each part of a column of the supermatrix. The supermatrix may not be column stochastic. Its
column blocks would be weighted by the priorities of the clusters to render the matrix stochastic. The supermatrix must now be raised to powers to
capture all the interactions and feedback among its elements. What is desired is its limiting power
limW k
k



The power of a matrix is function of that matrix. Entire functions (series expansion converges for all values) of a matrix can be represented by the
formula:
II(λjI-W)

Wk =

n


i=1

λ

k
i

j≠i
II(λj-λi)
j≠i

if the eigenvalues are distinct, or if they are not then by:
m

W =
k



i=1

1
d mi-1
(mi-1)! d λmi-1

One is the largest eigenvalue of a stochastic matrix. This follows from

λ max  max
i

λki (λI-W)-1

n
II (λ- λi)
i=1
n
II (λ- λi)
i=mi+1

λ = λi

n

a
j=1

ij

and the sum on the right is equal to the one for a column stochastic matrix. It is obvious that the moduli of the remaining eigenvalues of a stochastic
matrix are less than or equal to one.
One is a simple eigenvalue if the matrix is positive. It can be a multiple eigenvalue or there may be other eigenvalues whose moduli are equal to one
if there is a sufficient number of zeros in the matrix so that it is reducible. When the supermatrix has some zero entries, it may be that some power of
it is positive and hence the matrix remains positive for still larger powers and is called primitive.
One is a simple eigenvalue of a primitive matrix. One may be a simple eigenvalue whether the matrix is primitive or not or a multiple eigenvalue yet
there may not be other eigenvalues whose moduli is equal to one. The powers take on a certain form in the limit for each of these three cases. On the
other hand if there are other such roots whose module is one, the powers of the supermatrix would cycle with a period of cyclicity and the limit is
given by the same expression in all three cases namely when the supermatrix is imprimitive or when one is a simple or a multiple eigenvalue.

88
Irreducible Stochastic ( λ = 1 is a simple root)
W∞ =
No other roots with modulus equal to one
(primitive)
Case A
Primitive if trace is positive.
Raise W to powers.
All columns the same and any column can also be
obtained as the solution of the eigenvalue
problem Ww = w.

Other roots with modulus equal to one
(imprimitive with cyclicity c).
Case A′

1
( I − W c )( I − W ) −1 (W c ) ∞
c

89

c≥ 2
Reducible Stochastic
W∞ =

No other roots with modulus equal to one
Case B

λ =1

Simple

−1
( I −W ) ∆ (1) = Adjo int( I − W ) normalized
∆ ′(1)
∆ ′(1)
Case C

λ =1

multiple

n1

n1 ∑ ( − 1) k
k=0

n1! ∆( n1 − k ) (λ )
(λ I − W ) − k −1 |λ =1
( n1 )
(n1 − k ) ∆ (λ )

Other roots with modulus equal to one (cyclic
with cyclicity c).
Case B′

1
( I − W c )( I − W ) −1 (W c ) ∞
c

c≥ 2

Case C′

1
( I − W c )( I − W ) −1 (W c ) ∞
c

c≥ 2

The desired outcome for Case C can often be obtained by introducing loops at all sinks and raising the
matrix to limiting powers.

90
Computationally, the foregoing classification may be simplified along the following lines. Define
λ 1. We have:
Proper

| λi | < 1 i > 1

λ 1 = 1 simple root

A primitive stochastic matrix is proper
(1)
Fully Regular
The index k=1 in the diagonal primitive block
matrices of the normal form

λ max =

Improper

| λ i | ≤ 1 (for several i)

Roots of unity of cyclicity c.
(2)

1
( I − W c )( I − W ) −1 (W c ) ∞
c

( I − W ) −1 ∆ (1) Adjo int( I − W )
=
∆ ′(1)
∆ ′(1)
Normalize the columns of the adjoint to get W∞ .
When W is primitive one can simply raise W to
very large powers on a personal computer.
(3)

λ 1 = 1 multiple root If and only if matrices A1,…, Ak in upper part of
of multiplicity n1

diagonal of normal form are primitive
n1

n1 ∑ (− 1) k
k=0

(4)

1
( I − W c )( I − W ) −1 (W c ) ∞
c

n1! ∆( n1 − k ) (λ )
(λ I − W ) − k −1 |λ =1
( n1 − k )! ∆( n1 ) (λ )

A simple practical rule for obtaining a limiting matrix for a given n by n nonnegative and stochastic
supermatrix W is first to test it for irreducibility with the condition (I+W)n-1 > 0. If it is irreducible, then
λ max = 1 is simple and one of the two formulas applies. It is then tested for cyclicity and the answer is
obtained using the above.
When alternatives do not feed back into the criteria, it is best not to include them in the supermatrix. The
reason is that if the supermatrix cycles, then the average value would first have to be calculated. The
average weights of the criteria are then used to weight the alternatives in a separate hierarchy.

91
ANP PROJECTS
1996 United States Presidential Election
A Day at the Races: Predicting a Harness Race at the Meadows: An Application of the ANP
A Prediction of Opportunities for Job Growth by U.S. Region
Alternative Fuels for Automobiles
An ANP Approach for Commodity Markets Demand/Supply Ratio Model
Analysis of the Market for 32-Bit Operating Systems
Bridge Management Decision
Choosing the Best Location for Permanent Storage of High-Level Nuclear Waste
Commodity Markets
Convocation Center
Corporate Market Value in the Computer Industry
Corporate Restructuring at Chrysler
Corporate Strategies for Competitors
Crime and Punishment
Disney America: Should Disney Build a Theme Park?
Given $10 Million, What Would be the Best Allocation to Each of the Proposed Programs that
Contribute to Decreasing Gang Activity?
Health Insurance Systems
How to Implement Flex Time
Justify the Existence of the Economic Black Market
Lake Levels and Flow Releases
Management Consulting Model
Market Share Predictions for Aqueous Intra-Nasal Steroids
Medical Center: Strategic Planning with the ANP
Mergers and Acquisitions
Mode of Transportation to School
Modeling a Reservoir Operations for Managing of Ecological Interests
Multi-Objective Decision Making Analysis with Engineering and Business Applications

92
ANP REFERENCES cont’d

NBA Playoffs for 1991
Net Dollar Value for IBM, Apple, Intel and Microsoft
Network Analysis of Illegal Drug Marketing in the United States
Planning Strategies for Incubator Space using the ANP
Predicting the Outcome of Legislative Debate over Superfund Reauthorization
Predicting the Winner of the 1995-1996 NHL Stanley Cup
Predicting the Winner of the 1996 Chase Championship with the ANP
Prediction of 1997 Australian Tennis Open
Prediction of the 1997 Wimbledon Tennis Championships
Prediction of the CPU Market
Prioritizing Flow Alternatives for Social Objectives
Ranking Countries in Telecommunications as a Subset of Locating a Business Problem
Stadium Placement and Optimal Funding
Strategic Staffing – Extra Care Providers
Strategies for Improvement at the Joseph M. Katz Graduate School of Business
Teenage Pregnancy
Telecommunications Network Design and Performance
The Decision to Market Nimbex (new drug) vs. Continuing to Market Tracruim (old drug)
The Emerging Information Technologies of the Future: The “Prize” of Firms and Industries
The Future of East Central Europe
The Future of Major League Baseball in Pittsburgh: Strategic Planning with the ANP
The Future of the University of Pittsburgh’s Medical Center
The Middle East
The Optimal MBA Program Structure
The Teenage Smoking Problem
Transportation to Work
Understanding the Tiananmen Massacre in China
What will be the worth? (Predicting Average Starting Salaries for MBA Graduates)
Where to Invest in Capital Markets

93

More Related Content

What's hot

A Formal Machine Learning or Multi Objective Decision Making System for Deter...
A Formal Machine Learning or Multi Objective Decision Making System for Deter...A Formal Machine Learning or Multi Objective Decision Making System for Deter...
A Formal Machine Learning or Multi Objective Decision Making System for Deter...Editor IJCATR
 
Imputation Techniques For Market Research Datasets With Missing Values
Imputation Techniques For Market Research Datasets With Missing Values Imputation Techniques For Market Research Datasets With Missing Values
Imputation Techniques For Market Research Datasets With Missing Values Salford Systems
 
Emilie Rousselin Stastistics
Emilie Rousselin StastisticsEmilie Rousselin Stastistics
Emilie Rousselin StastisticsEmilie Rousselin
 
IRJET- Analyzing Voting Results using Influence Matrix
IRJET- Analyzing Voting Results using Influence MatrixIRJET- Analyzing Voting Results using Influence Matrix
IRJET- Analyzing Voting Results using Influence MatrixIRJET Journal
 
Application of the analytic hierarchy process (AHP) for selection of forecast...
Application of the analytic hierarchy process (AHP) for selection of forecast...Application of the analytic hierarchy process (AHP) for selection of forecast...
Application of the analytic hierarchy process (AHP) for selection of forecast...Gurdal Ertek
 
Missing Data and data imputation techniques
Missing Data and data imputation techniquesMissing Data and data imputation techniques
Missing Data and data imputation techniquesOmar F. Althuwaynee
 
Statistical Approaches to Missing Data
Statistical Approaches to Missing DataStatistical Approaches to Missing Data
Statistical Approaches to Missing DataDataCards
 
Classification and decision tree classifier machine learning
Classification and decision tree classifier machine learningClassification and decision tree classifier machine learning
Classification and decision tree classifier machine learningFrancisco E. Figueroa-Nigaglioni
 
Generalized Linear Models
Generalized Linear ModelsGeneralized Linear Models
Generalized Linear ModelsAvinash Chamwad
 
Final generalized linear modeling by idrees waris iugc
Final generalized linear modeling by idrees waris iugcFinal generalized linear modeling by idrees waris iugc
Final generalized linear modeling by idrees waris iugcId'rees Waris
 
Multivariate Analysis Techniques
Multivariate Analysis TechniquesMultivariate Analysis Techniques
Multivariate Analysis TechniquesMehul Gondaliya
 
Twala2007.doc
Twala2007.docTwala2007.doc
Twala2007.docbutest
 

What's hot (20)

Comparison and evaluation of alternative designs
Comparison and evaluation of alternative designsComparison and evaluation of alternative designs
Comparison and evaluation of alternative designs
 
Missing Data and Causes
Missing Data and CausesMissing Data and Causes
Missing Data and Causes
 
Sensitivity analysis
Sensitivity analysisSensitivity analysis
Sensitivity analysis
 
Seminario
SeminarioSeminario
Seminario
 
A Formal Machine Learning or Multi Objective Decision Making System for Deter...
A Formal Machine Learning or Multi Objective Decision Making System for Deter...A Formal Machine Learning or Multi Objective Decision Making System for Deter...
A Formal Machine Learning or Multi Objective Decision Making System for Deter...
 
Imputation Techniques For Market Research Datasets With Missing Values
Imputation Techniques For Market Research Datasets With Missing Values Imputation Techniques For Market Research Datasets With Missing Values
Imputation Techniques For Market Research Datasets With Missing Values
 
One Graduate Paper
One Graduate PaperOne Graduate Paper
One Graduate Paper
 
03 Data Mining Techniques
03 Data Mining Techniques03 Data Mining Techniques
03 Data Mining Techniques
 
Emilie Rousselin Stastistics
Emilie Rousselin StastisticsEmilie Rousselin Stastistics
Emilie Rousselin Stastistics
 
IRJET- Analyzing Voting Results using Influence Matrix
IRJET- Analyzing Voting Results using Influence MatrixIRJET- Analyzing Voting Results using Influence Matrix
IRJET- Analyzing Voting Results using Influence Matrix
 
Application of the analytic hierarchy process (AHP) for selection of forecast...
Application of the analytic hierarchy process (AHP) for selection of forecast...Application of the analytic hierarchy process (AHP) for selection of forecast...
Application of the analytic hierarchy process (AHP) for selection of forecast...
 
Missing Data and data imputation techniques
Missing Data and data imputation techniquesMissing Data and data imputation techniques
Missing Data and data imputation techniques
 
Statistical Approaches to Missing Data
Statistical Approaches to Missing DataStatistical Approaches to Missing Data
Statistical Approaches to Missing Data
 
Classification and decision tree classifier machine learning
Classification and decision tree classifier machine learningClassification and decision tree classifier machine learning
Classification and decision tree classifier machine learning
 
Generalized Linear Models
Generalized Linear ModelsGeneralized Linear Models
Generalized Linear Models
 
Factor analysis (1)
Factor analysis (1)Factor analysis (1)
Factor analysis (1)
 
Final generalized linear modeling by idrees waris iugc
Final generalized linear modeling by idrees waris iugcFinal generalized linear modeling by idrees waris iugc
Final generalized linear modeling by idrees waris iugc
 
Pca analysis
Pca analysisPca analysis
Pca analysis
 
Multivariate Analysis Techniques
Multivariate Analysis TechniquesMultivariate Analysis Techniques
Multivariate Analysis Techniques
 
Twala2007.doc
Twala2007.docTwala2007.doc
Twala2007.doc
 

Viewers also liked

Tutorial 1 ahp_relative_model_ver_2.2.x
Tutorial 1 ahp_relative_model_ver_2.2.xTutorial 1 ahp_relative_model_ver_2.2.x
Tutorial 1 ahp_relative_model_ver_2.2.xelenau12
 
An Analytic Network Process Modeling to Assess Technological Innovation Capab...
An Analytic Network Process Modeling to Assess Technological Innovation Capab...An Analytic Network Process Modeling to Assess Technological Innovation Capab...
An Analytic Network Process Modeling to Assess Technological Innovation Capab...drboon
 
ANP-GP Approach for Selection of Software Architecture Styles
ANP-GP Approach for Selection of Software Architecture StylesANP-GP Approach for Selection of Software Architecture Styles
ANP-GP Approach for Selection of Software Architecture StylesWaqas Tariq
 
Access formulaires
Access formulairesAccess formulaires
Access formulaireshassan1488
 
Tutorial 8 building_ahp_rating_ models_ver_2.2
Tutorial 8 building_ahp_rating_ models_ver_2.2Tutorial 8 building_ahp_rating_ models_ver_2.2
Tutorial 8 building_ahp_rating_ models_ver_2.2elenau12
 
BOCR multi level ANP models
BOCR multi level ANP modelsBOCR multi level ANP models
BOCR multi level ANP modelsElena Rokou
 
ANP market share models
ANP market share modelsANP market share models
ANP market share modelsElena Rokou
 
Tutorial2003
Tutorial2003Tutorial2003
Tutorial2003chibi12
 
AHP Champion Award 2015
AHP Champion Award 2015AHP Champion Award 2015
AHP Champion Award 2015ahorsepubs
 
Changing from AHP to ANP thinking
Changing from AHP to ANP thinkingChanging from AHP to ANP thinking
Changing from AHP to ANP thinkingElena Rokou
 
Validation examples AHP and ANP
Validation examples AHP and ANPValidation examples AHP and ANP
Validation examples AHP and ANPElena Rokou
 
Analytic network process
Analytic network processAnalytic network process
Analytic network processMat Sahudi
 
SuperDecision for AHP and ANP
SuperDecision for AHP and ANPSuperDecision for AHP and ANP
SuperDecision for AHP and ANPElena Rokou
 
University Cafeteria Operations using Business Process Model and Notation (B...
University Cafeteria Operations  using Business Process Model and Notation (B...University Cafeteria Operations  using Business Process Model and Notation (B...
University Cafeteria Operations using Business Process Model and Notation (B...Moumie Soulemane
 
Process Experience - The coffee example
Process Experience - The coffee exampleProcess Experience - The coffee example
Process Experience - The coffee exampleThomas Olbrich
 

Viewers also liked (20)

Tutorial 1 ahp_relative_model_ver_2.2.x
Tutorial 1 ahp_relative_model_ver_2.2.xTutorial 1 ahp_relative_model_ver_2.2.x
Tutorial 1 ahp_relative_model_ver_2.2.x
 
An Analytic Network Process Modeling to Assess Technological Innovation Capab...
An Analytic Network Process Modeling to Assess Technological Innovation Capab...An Analytic Network Process Modeling to Assess Technological Innovation Capab...
An Analytic Network Process Modeling to Assess Technological Innovation Capab...
 
ANP-GP Approach for Selection of Software Architecture Styles
ANP-GP Approach for Selection of Software Architecture StylesANP-GP Approach for Selection of Software Architecture Styles
ANP-GP Approach for Selection of Software Architecture Styles
 
Regex php
Regex phpRegex php
Regex php
 
Access formulaires
Access formulairesAccess formulaires
Access formulaires
 
Tutorial 8 building_ahp_rating_ models_ver_2.2
Tutorial 8 building_ahp_rating_ models_ver_2.2Tutorial 8 building_ahp_rating_ models_ver_2.2
Tutorial 8 building_ahp_rating_ models_ver_2.2
 
BOCR multi level ANP models
BOCR multi level ANP modelsBOCR multi level ANP models
BOCR multi level ANP models
 
Generalites
GeneralitesGeneralites
Generalites
 
ANP market share models
ANP market share modelsANP market share models
ANP market share models
 
Tutorial2003
Tutorial2003Tutorial2003
Tutorial2003
 
AHP Champion Award 2015
AHP Champion Award 2015AHP Champion Award 2015
AHP Champion Award 2015
 
Changing from AHP to ANP thinking
Changing from AHP to ANP thinkingChanging from AHP to ANP thinking
Changing from AHP to ANP thinking
 
Validation examples AHP and ANP
Validation examples AHP and ANPValidation examples AHP and ANP
Validation examples AHP and ANP
 
Analytic network process
Analytic network processAnalytic network process
Analytic network process
 
SuperDecision for AHP and ANP
SuperDecision for AHP and ANPSuperDecision for AHP and ANP
SuperDecision for AHP and ANP
 
Ppt paper
Ppt paperPpt paper
Ppt paper
 
Gestion de formulaires en PHP
Gestion de formulaires en PHPGestion de formulaires en PHP
Gestion de formulaires en PHP
 
University Cafeteria Operations using Business Process Model and Notation (B...
University Cafeteria Operations  using Business Process Model and Notation (B...University Cafeteria Operations  using Business Process Model and Notation (B...
University Cafeteria Operations using Business Process Model and Notation (B...
 
Process Experience - The coffee example
Process Experience - The coffee exampleProcess Experience - The coffee example
Process Experience - The coffee example
 
Access 2007 verrou
Access 2007 verrouAccess 2007 verrou
Access 2007 verrou
 

Similar to Anp slideshow july_2001

Reading week08 saaty_sevenpillars_ahp
Reading week08 saaty_sevenpillars_ahpReading week08 saaty_sevenpillars_ahp
Reading week08 saaty_sevenpillars_ahphenry KKK
 
Factor Analysis in Research
Factor Analysis in ResearchFactor Analysis in Research
Factor Analysis in ResearchQasim Raza
 
Marketing Research Project
Marketing Research ProjectMarketing Research Project
Marketing Research ProjectPranav B. Gujjar
 
Overview Of Factor Analysis Q Ti A
Overview Of  Factor  Analysis  Q Ti AOverview Of  Factor  Analysis  Q Ti A
Overview Of Factor Analysis Q Ti AZoha Qureshi
 
Factor Analysis - Statistics
Factor Analysis - StatisticsFactor Analysis - Statistics
Factor Analysis - StatisticsThiyagu K
 
A Solution To The Random Assignment Problem On The Full Preference Domain
A Solution To The Random Assignment Problem On The Full Preference DomainA Solution To The Random Assignment Problem On The Full Preference Domain
A Solution To The Random Assignment Problem On The Full Preference DomainJoe Andelija
 
The Next Normal - Five Stages of Emergence
The Next Normal - Five Stages of EmergenceThe Next Normal - Five Stages of Emergence
The Next Normal - Five Stages of EmergenceMalcolm Ryder
 
factor analysis (basics) for research .ppt
factor analysis (basics) for research .pptfactor analysis (basics) for research .ppt
factor analysis (basics) for research .pptMsHumaJaved
 
Factor analysis
Factor analysis Factor analysis
Factor analysis Nima
 
Factor anaysis scale dimensionality
Factor anaysis scale dimensionalityFactor anaysis scale dimensionality
Factor anaysis scale dimensionalityCarlo Magno
 
Multiple discriminant analysis
Multiple discriminant analysisMultiple discriminant analysis
Multiple discriminant analysisMUHAMMAD HASRATH
 
Item formulation psychological testin gfinalxxxx[1]
Item formulation psychological testin gfinalxxxx[1]Item formulation psychological testin gfinalxxxx[1]
Item formulation psychological testin gfinalxxxx[1]Milen Ramos
 
Banking case study
Banking case studyBanking case study
Banking case studyGaurav Dubey
 
Decision Support Systems in Clinical Engineering
Decision Support Systems in Clinical EngineeringDecision Support Systems in Clinical Engineering
Decision Support Systems in Clinical EngineeringAsmaa Kamel
 
Regression analysis made easy
Regression analysis made easyRegression analysis made easy
Regression analysis made easyWeam Banjar
 

Similar to Anp slideshow july_2001 (20)

Reading week08 saaty_sevenpillars_ahp
Reading week08 saaty_sevenpillars_ahpReading week08 saaty_sevenpillars_ahp
Reading week08 saaty_sevenpillars_ahp
 
Factor Analysis in Research
Factor Analysis in ResearchFactor Analysis in Research
Factor Analysis in Research
 
Marketing Research Project
Marketing Research ProjectMarketing Research Project
Marketing Research Project
 
Overview Of Factor Analysis Q Ti A
Overview Of  Factor  Analysis  Q Ti AOverview Of  Factor  Analysis  Q Ti A
Overview Of Factor Analysis Q Ti A
 
Factor Analysis - Statistics
Factor Analysis - StatisticsFactor Analysis - Statistics
Factor Analysis - Statistics
 
A Solution To The Random Assignment Problem On The Full Preference Domain
A Solution To The Random Assignment Problem On The Full Preference DomainA Solution To The Random Assignment Problem On The Full Preference Domain
A Solution To The Random Assignment Problem On The Full Preference Domain
 
Factor analysis
Factor analysisFactor analysis
Factor analysis
 
The Next Normal - Five Stages of Emergence
The Next Normal - Five Stages of EmergenceThe Next Normal - Five Stages of Emergence
The Next Normal - Five Stages of Emergence
 
FactorAnalysis.ppt
FactorAnalysis.pptFactorAnalysis.ppt
FactorAnalysis.ppt
 
EFA
EFAEFA
EFA
 
factor analysis (basics) for research .ppt
factor analysis (basics) for research .pptfactor analysis (basics) for research .ppt
factor analysis (basics) for research .ppt
 
Factor analysis
Factor analysis Factor analysis
Factor analysis
 
Exploratory factor analysis
Exploratory factor analysisExploratory factor analysis
Exploratory factor analysis
 
Factor anaysis scale dimensionality
Factor anaysis scale dimensionalityFactor anaysis scale dimensionality
Factor anaysis scale dimensionality
 
Multiple discriminant analysis
Multiple discriminant analysisMultiple discriminant analysis
Multiple discriminant analysis
 
Item formulation psychological testin gfinalxxxx[1]
Item formulation psychological testin gfinalxxxx[1]Item formulation psychological testin gfinalxxxx[1]
Item formulation psychological testin gfinalxxxx[1]
 
Banking case study
Banking case studyBanking case study
Banking case study
 
Decision Support Systems in Clinical Engineering
Decision Support Systems in Clinical EngineeringDecision Support Systems in Clinical Engineering
Decision Support Systems in Clinical Engineering
 
Regression analysis made easy
Regression analysis made easyRegression analysis made easy
Regression analysis made easy
 
Priya
PriyaPriya
Priya
 

Recently uploaded

Build your next Gen AI Breakthrough - April 2024
Build your next Gen AI Breakthrough - April 2024Build your next Gen AI Breakthrough - April 2024
Build your next Gen AI Breakthrough - April 2024Neo4j
 
Kotlin Multiplatform & Compose Multiplatform - Starter kit for pragmatics
Kotlin Multiplatform & Compose Multiplatform - Starter kit for pragmaticsKotlin Multiplatform & Compose Multiplatform - Starter kit for pragmatics
Kotlin Multiplatform & Compose Multiplatform - Starter kit for pragmaticscarlostorres15106
 
Transcript: New from BookNet Canada for 2024: BNC BiblioShare - Tech Forum 2024
Transcript: New from BookNet Canada for 2024: BNC BiblioShare - Tech Forum 2024Transcript: New from BookNet Canada for 2024: BNC BiblioShare - Tech Forum 2024
Transcript: New from BookNet Canada for 2024: BNC BiblioShare - Tech Forum 2024BookNet Canada
 
Transcript: #StandardsGoals for 2024: What’s new for BISAC - Tech Forum 2024
Transcript: #StandardsGoals for 2024: What’s new for BISAC - Tech Forum 2024Transcript: #StandardsGoals for 2024: What’s new for BISAC - Tech Forum 2024
Transcript: #StandardsGoals for 2024: What’s new for BISAC - Tech Forum 2024BookNet Canada
 
"LLMs for Python Engineers: Advanced Data Analysis and Semantic Kernel",Oleks...
"LLMs for Python Engineers: Advanced Data Analysis and Semantic Kernel",Oleks..."LLMs for Python Engineers: Advanced Data Analysis and Semantic Kernel",Oleks...
"LLMs for Python Engineers: Advanced Data Analysis and Semantic Kernel",Oleks...Fwdays
 
My Hashitalk Indonesia April 2024 Presentation
My Hashitalk Indonesia April 2024 PresentationMy Hashitalk Indonesia April 2024 Presentation
My Hashitalk Indonesia April 2024 PresentationRidwan Fadjar
 
#StandardsGoals for 2024: What’s new for BISAC - Tech Forum 2024
#StandardsGoals for 2024: What’s new for BISAC - Tech Forum 2024#StandardsGoals for 2024: What’s new for BISAC - Tech Forum 2024
#StandardsGoals for 2024: What’s new for BISAC - Tech Forum 2024BookNet Canada
 
Tech-Forward - Achieving Business Readiness For Copilot in Microsoft 365
Tech-Forward - Achieving Business Readiness For Copilot in Microsoft 365Tech-Forward - Achieving Business Readiness For Copilot in Microsoft 365
Tech-Forward - Achieving Business Readiness For Copilot in Microsoft 3652toLead Limited
 
Bun (KitWorks Team Study 노별마루 발표 2024.4.22)
Bun (KitWorks Team Study 노별마루 발표 2024.4.22)Bun (KitWorks Team Study 노별마루 발표 2024.4.22)
Bun (KitWorks Team Study 노별마루 발표 2024.4.22)Wonjun Hwang
 
Snow Chain-Integrated Tire for a Safe Drive on Winter Roads
Snow Chain-Integrated Tire for a Safe Drive on Winter RoadsSnow Chain-Integrated Tire for a Safe Drive on Winter Roads
Snow Chain-Integrated Tire for a Safe Drive on Winter RoadsHyundai Motor Group
 
My INSURER PTE LTD - Insurtech Innovation Award 2024
My INSURER PTE LTD - Insurtech Innovation Award 2024My INSURER PTE LTD - Insurtech Innovation Award 2024
My INSURER PTE LTD - Insurtech Innovation Award 2024The Digital Insurer
 
Unleash Your Potential - Namagunga Girls Coding Club
Unleash Your Potential - Namagunga Girls Coding ClubUnleash Your Potential - Namagunga Girls Coding Club
Unleash Your Potential - Namagunga Girls Coding ClubKalema Edgar
 
Swan(sea) Song – personal research during my six years at Swansea ... and bey...
Swan(sea) Song – personal research during my six years at Swansea ... and bey...Swan(sea) Song – personal research during my six years at Swansea ... and bey...
Swan(sea) Song – personal research during my six years at Swansea ... and bey...Alan Dix
 
Key Features Of Token Development (1).pptx
Key  Features Of Token  Development (1).pptxKey  Features Of Token  Development (1).pptx
Key Features Of Token Development (1).pptxLBM Solutions
 
APIForce Zurich 5 April Automation LPDG
APIForce Zurich 5 April  Automation LPDGAPIForce Zurich 5 April  Automation LPDG
APIForce Zurich 5 April Automation LPDGMarianaLemus7
 
Scanning the Internet for External Cloud Exposures via SSL Certs
Scanning the Internet for External Cloud Exposures via SSL CertsScanning the Internet for External Cloud Exposures via SSL Certs
Scanning the Internet for External Cloud Exposures via SSL CertsRizwan Syed
 
CloudStudio User manual (basic edition):
CloudStudio User manual (basic edition):CloudStudio User manual (basic edition):
CloudStudio User manual (basic edition):comworks
 
SQL Database Design For Developers at php[tek] 2024
SQL Database Design For Developers at php[tek] 2024SQL Database Design For Developers at php[tek] 2024
SQL Database Design For Developers at php[tek] 2024Scott Keck-Warren
 

Recently uploaded (20)

Build your next Gen AI Breakthrough - April 2024
Build your next Gen AI Breakthrough - April 2024Build your next Gen AI Breakthrough - April 2024
Build your next Gen AI Breakthrough - April 2024
 
Kotlin Multiplatform & Compose Multiplatform - Starter kit for pragmatics
Kotlin Multiplatform & Compose Multiplatform - Starter kit for pragmaticsKotlin Multiplatform & Compose Multiplatform - Starter kit for pragmatics
Kotlin Multiplatform & Compose Multiplatform - Starter kit for pragmatics
 
Transcript: New from BookNet Canada for 2024: BNC BiblioShare - Tech Forum 2024
Transcript: New from BookNet Canada for 2024: BNC BiblioShare - Tech Forum 2024Transcript: New from BookNet Canada for 2024: BNC BiblioShare - Tech Forum 2024
Transcript: New from BookNet Canada for 2024: BNC BiblioShare - Tech Forum 2024
 
Transcript: #StandardsGoals for 2024: What’s new for BISAC - Tech Forum 2024
Transcript: #StandardsGoals for 2024: What’s new for BISAC - Tech Forum 2024Transcript: #StandardsGoals for 2024: What’s new for BISAC - Tech Forum 2024
Transcript: #StandardsGoals for 2024: What’s new for BISAC - Tech Forum 2024
 
"LLMs for Python Engineers: Advanced Data Analysis and Semantic Kernel",Oleks...
"LLMs for Python Engineers: Advanced Data Analysis and Semantic Kernel",Oleks..."LLMs for Python Engineers: Advanced Data Analysis and Semantic Kernel",Oleks...
"LLMs for Python Engineers: Advanced Data Analysis and Semantic Kernel",Oleks...
 
My Hashitalk Indonesia April 2024 Presentation
My Hashitalk Indonesia April 2024 PresentationMy Hashitalk Indonesia April 2024 Presentation
My Hashitalk Indonesia April 2024 Presentation
 
#StandardsGoals for 2024: What’s new for BISAC - Tech Forum 2024
#StandardsGoals for 2024: What’s new for BISAC - Tech Forum 2024#StandardsGoals for 2024: What’s new for BISAC - Tech Forum 2024
#StandardsGoals for 2024: What’s new for BISAC - Tech Forum 2024
 
Tech-Forward - Achieving Business Readiness For Copilot in Microsoft 365
Tech-Forward - Achieving Business Readiness For Copilot in Microsoft 365Tech-Forward - Achieving Business Readiness For Copilot in Microsoft 365
Tech-Forward - Achieving Business Readiness For Copilot in Microsoft 365
 
Bun (KitWorks Team Study 노별마루 발표 2024.4.22)
Bun (KitWorks Team Study 노별마루 발표 2024.4.22)Bun (KitWorks Team Study 노별마루 발표 2024.4.22)
Bun (KitWorks Team Study 노별마루 발표 2024.4.22)
 
Snow Chain-Integrated Tire for a Safe Drive on Winter Roads
Snow Chain-Integrated Tire for a Safe Drive on Winter RoadsSnow Chain-Integrated Tire for a Safe Drive on Winter Roads
Snow Chain-Integrated Tire for a Safe Drive on Winter Roads
 
My INSURER PTE LTD - Insurtech Innovation Award 2024
My INSURER PTE LTD - Insurtech Innovation Award 2024My INSURER PTE LTD - Insurtech Innovation Award 2024
My INSURER PTE LTD - Insurtech Innovation Award 2024
 
Unleash Your Potential - Namagunga Girls Coding Club
Unleash Your Potential - Namagunga Girls Coding ClubUnleash Your Potential - Namagunga Girls Coding Club
Unleash Your Potential - Namagunga Girls Coding Club
 
DMCC Future of Trade Web3 - Special Edition
DMCC Future of Trade Web3 - Special EditionDMCC Future of Trade Web3 - Special Edition
DMCC Future of Trade Web3 - Special Edition
 
Swan(sea) Song – personal research during my six years at Swansea ... and bey...
Swan(sea) Song – personal research during my six years at Swansea ... and bey...Swan(sea) Song – personal research during my six years at Swansea ... and bey...
Swan(sea) Song – personal research during my six years at Swansea ... and bey...
 
Key Features Of Token Development (1).pptx
Key  Features Of Token  Development (1).pptxKey  Features Of Token  Development (1).pptx
Key Features Of Token Development (1).pptx
 
APIForce Zurich 5 April Automation LPDG
APIForce Zurich 5 April  Automation LPDGAPIForce Zurich 5 April  Automation LPDG
APIForce Zurich 5 April Automation LPDG
 
Scanning the Internet for External Cloud Exposures via SSL Certs
Scanning the Internet for External Cloud Exposures via SSL CertsScanning the Internet for External Cloud Exposures via SSL Certs
Scanning the Internet for External Cloud Exposures via SSL Certs
 
CloudStudio User manual (basic edition):
CloudStudio User manual (basic edition):CloudStudio User manual (basic edition):
CloudStudio User manual (basic edition):
 
SQL Database Design For Developers at php[tek] 2024
SQL Database Design For Developers at php[tek] 2024SQL Database Design For Developers at php[tek] 2024
SQL Database Design For Developers at php[tek] 2024
 
E-Vehicle_Hacking_by_Parul Sharma_null_owasp.pptx
E-Vehicle_Hacking_by_Parul Sharma_null_owasp.pptxE-Vehicle_Hacking_by_Parul Sharma_null_owasp.pptx
E-Vehicle_Hacking_by_Parul Sharma_null_owasp.pptx
 

Anp slideshow july_2001

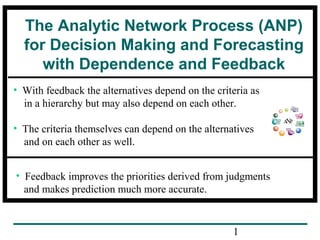
  • 1. The Analytic Network Process (ANP) for Decision Making and Forecasting with Dependence and Feedback • With feedback the alternatives depend on the criteria as in a hierarchy but may also depend on each other. • The criteria themselves can depend on the alternatives and on each other as well. • Feedback improves the priorities derived from judgments and makes prediction much more accurate. 1
  • 3. Feedback Network with components having Inner and Outer Dependence among Their Elements C4 C1 Feedback Arc from component C4 to C2 indicates the outer dependence of the elements in C2 on the elements in C4 with respect to a common property. C2 C3 Loop in a component indicates inner dependence of the elements in that component with respect to a common property. 3
  • 4. Inner and Outer Dependence and the Control Hierarchy In a network, the elements in a component may be people (e.g., individuals in the White House) and those in another component may also be people (e.g., individuals in Congress). The elements in a component may influence other elements in the same component (inner dependence) and those in other components (outer dependence) with respect to each of several properties. We want to determine the overall influence of all the elements. In that case we must organize the properties or criteria and prioritize them in the framework of a control hierarchy (or a network), perform comparisons and synthesize to obtain the priorities of these properties. We then derive the influence of elements in the feedback system with respect to each of these properties. Finally, we weight the resulting influences by the importance of the properties and add to obtain the overall influence of each element. 4
  • 5. Main Operations of the ANP • Relative measurement: Reciprocal relation • Judgments: Homogeneity • Hierarchy or Network: Structure of problem; the control hierarchy • Priorities, Dominance and Consistency: Eigenvector • Composition, Additive to also handle dependence through the supermatrix • Supermatrix: Dependence • Neural Firing: Fredholm Kernel and Eigenfunctions 5
  • 6. Inner and Outer Dependence and the Control Hierarchy cont. Control hierarchies fall in four groups: • Benefits, Costs, Risks, & Opportunities. Benefits and costs measure the positive and negative contributions or importance of the alternatives if they happen, but will they happen? Risks and opportunities measure the likelihood that the alternatives will happen and make positive and respectively negative contributions. Each one is a hierarchy (or a network) by itself. The overall priorities of the alternatives with respect to each of these are then combined by forming the ratios: Benefits x Opportunities Costs x Risks to obtain their final overall priorities for a decision. 6
  • 7. Weighting The Components In the ANP one often needs to prioritize the influence of the components themselves on each other component to which the elements belong. This influence is assessed through paired comparisons with respect to a control criterion. The priority of each component is used to weight the priorities of all the elements in that component. The reason for doing this is to enable us to perform feedback multiplication of priorities by other priorities in a cycle, an infinite number of times. The process would not converge unless the resulting matrix of priorities is column stochastic (each of its columns adds to one). To see that one must compare clusters in real life, we note that if a person is introduced as the president it makes much difference, for example, whether he or she is the President of the United States or the president of a local labor group. 7
  • 8. Functional - Structural Criteria Independence - Dependence 1--Criteria completely independent from alternatives - Absolute Measurement, Intensities and Standards. 2--Criteria quasi dependent on alternatives - Relative Measurement: Rescale the weight of a criterion by the number of alternatives and their measurement (normalization). 3--Criteria completely dependent on alternatives - Feedback network - the Supermatrix. 8
  • 9. Why ANP? • The power of the Analytic Network Process (ANP) lies in its use of ratio scales to capture all kinds of interactions and make accurate predictions, and, even further, to make better decisions. So far, it has proven itself to be a success when expert knowledge is used with it to predict sports outcomes, economic turns, business, social and political decision outcomes. • The ANP is a mathematical theory that makes it possible for one to deal systematically with all kinds of dependence and feedback. The reason for its success is the way it elicits judgments and uses measurement to derive ratio scales. Priorities as ratio scales are a fundamental kind of number amenable to performing the basic arithmetic operations of adding within the same scale and multiplying different scales meaningfully as required by the ANP. 9
  • 10. Mutual Influence Among Several Elements In order to distinguish among the influence of several homogeneous elements that is exerted on a single element, the number of influencing elements cannot be more than a few. The reason is that the element that is influenced must be able to distinguish between the various influences and respond to them in relatives terms. If their number is large, the relative influence of each would be a small part of the total. On the other hand, if the number of elements is small, the relative influence of each one on any other single element would be large and distinguishable. A small change in the influence of any of these elements would not alter the receiving elements estimation of its overall influence. When the number of elements is large, they need to be put in different clusters. Unidirectional Influence A single powerful element may influence numerous other elements that do not influence it in return or influence each other. If many elements influence a single element without feedback, their number can be arbitrarily large. 10
  • 11. The Questions to Answer About the Dominance of Influence Two kinds of questions encountered in the ANP: 1. Given a criterion, which element has greater influence (is more dominant) with respect to that criterion? Use one of the following two questions throughout an exercise. 2. Given a criterion and given an element X in any cluster, which element in the same cluster or a different cluster has greater influence on X with respect to that criterion? 2’. Given a criterion and given an element X in any cluster, which element in the same or in a different cluster is influenced more by X with respect to that criterion. 11
  • 12. Example of Control Hierarchy Optimum Function of A System Environmental Economic Social Influence is too general a concept and must be specified in terms of particular criteria. It is analyzed according to each criterion and then synthesized by weighting with these priorities of the “control” criteria belonging to a hierarchy or to a system. 12
  • 13. The Supermatrix Take a control criterion. The priorities of the elements derived from paired comparisons with respect to that control criterion are arranged both vertically and horizontally according to components. The elements in each component are listed for that component in a matrix known as the Supermatrix. Each vector taken from a paired comparison matrix is part of the column of the supermatrix representing the impact with respect to the control criterion of the elements of that component on a single element of the same or another component listed at the top. The Weighted Supermatrix All the clusters are pairwise compared according to their influence on a given cluster X with respect to the control criterion. This yields a vector of priorities of the impact of all the clusters on a given criterion. Each component of a vector is used to weight all the elements in the block of column priorities of the supermatrix corresponding to the impact of the elements of that cluster on X. The process is repeated for all the clusters resulting in a weighted supermatrix. In each block of the supermatrix, a column is either a normalized eigenvector with possibly some zero entries, or all of its elements are equal to zero. In either case it is weighted by the priority of the corresponding cluster on the left. If it is zero, that column of the supermatrix must be normalized after weighting by the cluster’s weights. This operation is equivalent to assigning a zero value to the cluster on the left when weighting a column of a block with zero entries and then re-normalizing the weights of the remaining clusters. 13
  • 14. The Limiting Supermatrix The weighted supermatrix is now column stochastic from which one then derives the limiting supermatrix. There are four major cases to consider in deriving the limiting supermatrix depending on the simplicity or multiplicity of the principle eigenvalue and on the reducibility and irreducibility of the matrix. How to Read Off the Answer The desired priorities of the criteria and alternatives with respect to the corresponding control criterion can be read off the supermatrix as given or they may be structurally adjusted according to the number of elements in each cluster and appropriately re-weighted. How to Combine Benefits, Costs, Opportunities, Risks One must first combine the supermatrices for the benefits, then for the costs, then for the opportunities and then for the risks by using the weights of the control criteria for each. One then takes the ratio benefits x opportunities / costs x risks for the alternatives and selects the alternative with the largest ratio. 14
  • 15. Networks and the Supermatrix c1 c1 W= e11 e12 c2 e1n1 21 e22 cN e2n2 N1 eN2 e11e12 c2 e1n1 e21e22 cN e2n2 eN1eN2 eNnN W11 W12 W1N W21 W22 W2N WN1 WN2 WNN eNuN 15
  • 17. Supermatrix of a Hierarchy 0 W= 0 0 0 0 W21 0 0 0 0 0 0 0 0 0 0 0 0 W32 0 0 0 0 0 Wn-1, n-2 0 0 0 Wn, n-1 I 17
  • 18. 0 0 0 0 0 0 0 0 0 0 0 0 0 0 0 W k= Wn,n-1 Wn-1,n-2 W … 32 W21 Wn,n-1 Wn-1,n-2 W ... 32 Wn,n-1 Wn-1,n-2 Wn,n-1 I for k>n-1 18
  • 19. The School Hierarchy as Supermatrix Goal Learning Friends School life Vocational training College preparation Music classes Alternative A Alternative B Alternative C Goal 0 0.32 0.14 0.03 0.13 0.24 0.14 0 0 0 Learning 0 0 0 0 0 0 0 0.16 0.59 0.25 Friends 0 0 0 0 0 0 0 0.33 0.33 0.34 School life Vocational training College preparation Music classes 0 0 0 0 0 0 0 0 0 0 0 0 0 0 0 0 0 0 0 0 0 0 0 0 0 0 0 0 0.45 0.77 0.25 0.69 0.09 0.06 0.5 0.09 0.46 0.17 0.25 0.22 A 0 0 0 0 0 0 0 1 0 0 B 0 0 0 0 0 0 0 0 1 0 C 0 0 0 0 0 0 0 0 0 1 Limiting Supermatrix & Hierarchic Composition Goal Learning Friends School life Vocational training College preparation Music classes Alternative A Alternative B Alternative C Goal 0 0 0 0 0 0 0 0.3676 0.3781 0.2543 Learning 0 0 0 0 0 0 0 0.16 0.59 0.25 Friends 0 0 0 0 0 0 0 0.33 0.33 0.34 School life Vocational training College preparation Music classes 0 0 0 0 0 0 0 0 0 0 0 0 0 0 0 0 0 0 0 0 0 0 0 0 0 0 0 0 0.45 0.77 0.25 0.69 0.09 0.06 0.5 0.09 0.46 0.17 0.25 0.22 19 A 0 0 0 0 0 0 0 1 0 0 B 0 0 0 0 0 0 0 0 1 0 C 0 0 0 0 0 0 0 0 0 1
  • 20. Criteria Independent from Alternatives When the criteria do not depend on the alternatives, the latter are kept out of the supermatrix and are evaluated in the usual hierarchic way by the distributive or ideal modes to make possible rank preservation or reversal as desired. The priorities of the criteria in terms of which the alternatives are evaluated hierarchically are taken from the limiting supermatrix. Here again benefit, cost, opportunity, and risk evaluation can be made to determine the ranks of the alternatives. 20
  • 21. Structural Adjust After & Before the Final Results After computing the limiting results, if it is desired to group together elements from two or more clusters to determine their relative influence, the priorities of each cluster may be multiplied by the relative number of elements in that cluster to the total number in the set of clusters and then the entire set is normalized. One may think to do such structural adjustment in the weighting process of the original supermatrix. There may be occasions where that is what should be done. 21
  • 22. The Management of a Water Reservoir Here we are faced with the decision to choose one of the possibilities of maintaining the water level in a dam at: Low (L), Medium (M) or High (H) depending on the relative importance of Flood Control (F), Recreation (R) and the generation of Hydroelectric Power (E) respectively for the three levels. The first set of three matrices gives the prioritization of the alternatives with respect to the criteria and the second set, those of the criteria in terms of the alternatives. 22
  • 23. A Feedback System with Two Components Flood Control Low Level Recreation Intermediate Level HydroElectric Power High Level 23
  • 24. 1) Which level is best for flood control? Flood Control Low Low 1 Medium 1/5 High 1/7 Med 5 1 1/4 High Eigenvector 7 .722 4 .205 1 .073 Consistency Ratio = .107 3) Which level is best for power generation? Power Generation Low Low 1 Medium 5 High 9 Med 1/5 1 5 High Eigenvector 1/9 .058 1/5 .207 1 .735 2) Which level is best for recreation? Recreation Low Low 1 Medium 7 High 5 Med 1/7 1 1/3 High Eigenvector 1/5 .072 3 .649 1 .279 Consistency Ratio = .056 Consistency Ratio = .101 24
  • 25. Flood Control Recreation Hydro-Electric Power 2) At Intermediate Level, which attribute is satisfied best? Flood Control Recreation Hydro-Electric Power F 1 1/3 1/5 Low Level Dam R E 3 5 1 3 1/3 1 Eigenvector .637 .258 .105 1) At Low Level, which attribute is satisfied best? Consistency Ratio = .033 Flood Control Recreation Hydro-Electric Power F 1 5 9 Intermediate Level Dam F R E 1 1/3 1 3 1 3 1 1/3 1 Eigenvector .200 .600 .200 Consistency Ratio = .000 High Level Dam R E 1/5 1/9 1 1/4 4 1 Eigenvector .060 .231 .709 3) At High Level, which attribute is satisfied best? Consistency Ratio = .061 25
  • 26. The six eigenvectors were then introduced as columns of the following stochastic supermatrix. F F R E L M H 0 0 0 .722 .205 .073 R E L M H 0 0 0 .072 .649 .279 0 0 0 .058 .207 .735 .637 .258 .105 0 0 0 .200 .600 .200 0 0 0 .060 .231 .709 0 0 0 One must ensure that all columns sum to unity exactly. 26
  • 27. The final priorities for both, the height of the dam and for the criteria were obtained from the limiting power of the supermatrix. The components were not weighted here because the matrix is already column stochastic and would give the same limiting result for the ratios even if multiplied by the weighting constants. Its powers stabilize after a few iterations. We have F F R E L M H R E L M H 0 0 0 .223 .372 .405 0 0 0 .223 .372 .405 0 0 0 .223 .372 .405 .241 .374 .385 0 0 0 .241 .374 .385 0 0 0 .241 .374 .385 0 0 0 27
  • 28. The columns of each block of this matrix are identical, so that in the top right block we can read off the overall priority of each of the three criteria from any column, and read off the overall priorities of the three alternatives from any column of the bottom left block. It is clear from this analysis that for the kind of judgments provided, there is preference for a high dam with priority .405 for hydroelectric power generation with priority .385. 28
  • 29. Choosing a Car: Foreign or Domestic? Cost A E J A E J 1 1/5 1/3 5 1 3 3 1/3 1 Eigenvector .637 .105 .258 American C R D C 1 1/3 1/4 R D 3 1 1 4 1 1 Consistency Ratio = .033 Repair Cost A E J A E 1 1/5 1/2 J 5 1 3 Eigenvector 2 1/3 1 .582 .109 .309 A E J A E J 1 5 3 1/5 1 1/3 1/3 3 1 Eigenvector .105 .637 .258 Consistency Ratio = .033 .634 .192 .174 Consistency Ratio = .008 European C R D C R D 1 1 2 1 1 2 1/2 1/2 1 Consistency Ratio = .003 Durability Eigenvector Eigenvector .250 .250 .500 Consistency Ratio = .008 Japanese C R D C R D 1 1/2 1 2 1 2 1 1/2 1 Eigenvector .400 .200 .400 Consistency Ratio = .000 29
  • 31. Date and Strength of Recovery of U.S. Economy Primary Factors Subfactors Adjustment Period Required for Turnaround Conventional adjustment Economic Restructuring Consumption (C) Exports (X) Investment (I) Fiscal Policy (F) Monetary Policy (M) Confidence (K) Financial Sector (FS) Defense Posture (DP) Global Competition (GC) 3 months 6 months 12 months 24 months The U.S. Holarchy of Factors for Forecasting Turnaround in Economic Stagnation 31
  • 32. Table 1: Matrices for subfactor importance relative to primary factors influencing the Timing of Recovery Panel A: Which subfactor has the greater potential to influence Conventional Adjustment and how strongly? C Consumption (C) Exports (E) Investment (I) Confidence (K) Fiscal Policy (F) Monetary Policy (M) E I K F M Vector Weights 1 1/7 1/5 5 2 5 7 1 5 5 5 7 5 1/5 1 5 3 5 1/5 1/5 1/5 1 1/5 1 1/2 1/5 1/3 5 1 5 1/5 1/7 1/5 1 1/5 1 0.118 0.029 0.058 0.334 0.118 0.343 Panel B: Which subfactor has the greater potential to influence Economic Restructuring and how strongly? FS Financial Sector (FS) Defense Posture (DS) Global Competition (GC) DP GC Vector Weights 1 3 3 0.584 1/3 1 3 0.281 1/3 1/3 1 0.135 32
  • 33. Table 2: Matrices for relative influence of subfactors on periods of adjustment (months) (Conventional Adjustment) For each panel below, which time period is more likely to indicate a turnaround if the relevant factor is the sole driving force? Panel A: Relative importance of targeted time periods for consumption to drive a turnaround 3 6 12 24 Vec. Wts. 3 months 6 months 12 months 24 months 1 5 7 7 1/5 1 5 5 1/7 1/5 1 3 1/7 1/5 1/3 1 .043 .113 .310 .534 Panel C: Relative importance of targeted time periods for investment to drive a turnaround 3 6 12 24 Vec. Wts. 3 months 6 months 12 months 24 months 1 1 5 5 1 1 5 5 1/5 1/5 1 3 1/5 1/5 1/3 1 .078 .078 .305 .538 Panel E: Relative importance of targeted time periods for monetary policy to drive a turnaround 3 3 months 6 months 12 months 24 months 1 1/5 1/7 1/7 6 12 24 5 1 1/5 1/7 7 5 1 5 7 7 1/5 1 Vec. Wts. .605 .262 .042 .091 Panel B: Relative importance of targeted time periods for exports to drive a turnaround 3 3 months 6 months 12 months 24 months 1 1 5 5 6 1 1 5 5 12 24 1/5 1/5 1 1 1/5 1/5 1 1 Vec. Wts. .083 .083 .417 .417 Panel D: Relative importance of targeted time periods for fiscal policy to drive a turnaround 3 6 12 24 Vec. Wts. 3 months 6 months 12 months 24 months 1 1 3 5 1 1 5 5 1/3 1/5 1 1 1/5 1/5 1 1 .099 .087 .382 .432 Panel F: Expected time for a change of confidence indicators of consumer and investor activity to support a turnaround in the economy 3 6 12 24 Vec. Wts. 3 months 6 months 12 months 24 months 1 1/3 1/5 1/5 3 1 1/5 1/5 5 5 1 1/5 33 5 5 5 1 .517 .305 .124 .054
  • 34. Table 3: Matrices for relative influence of subfactors on periods of adjustment (months) (Economic Restructuring) For each panel below, which time period is more likely to indicate a turnaround if the relevant factor is the sole driving force? Panel A: Financial system restructuring time 3 6 12 24 Vec. Wts. 3 months 6 months 12 months 24 months 1 3 5 7 1/3 1 5 7 1/5 1/5 1 5 1/7 1/7 1/5 1 Panel B: Defense readjustment time 3 6 12 24 .049 .085 .236 .630 3 months 6 months 12 months 24 months 1 3 5 7 1/3 1 5 7 1/5 1/5 1 5 1/7 1/7 1/5 1 Vec. Wts. .049 .085 .236 .630 Panel C: Global competition adjustment time 3 6 12 24 Vec. Wts. 3 months 6 months 12 months 24 months 1 1 5 5 1 1 5 5 1/5 1/5 1 3 1/5 1/5 1/3 1 .078 .078 .305 .538 Table 4: Most likely factor to dominate during a specified time period Which factor is more likely to produce a turnaround during the specified time period? Panel A: 3 Months CA R CA 1 1/5 R 5 1 Vec. Wts. .833 .167 Panel B: 6 Months CA CA 1 R 1/5 R 5 1 Vec. Wts. .833 .167 Conventional Adjustment Restructuring Panel C: 1 Year CA CA 1 R 1 R 1 1 CA R Panel D: 2 Years Vec. Wts. .500 .500 CA R CA 1 1/5 R 5 1 34 Vec. Wts. .167 .833
  • 35. Table 5: The Completed Supermatrix Conven. Economic. Consum. Adjust Restruc. Conven. Adjust Economic. Restru. Exports Invest. Confid. Fiscal Policy Monet. Policy Financ. Sector Defense Posture Global Compet. 3 mo. 0.0 0.0 0.0 0.0 0.0 0.0 0.0 0.0 0.0 0.0 0.0 0.0 0.0 0.0 0.0 0.0 0.0 0.0 0.0 0.0 0.0 0.0 0.500 0.167 ¦ 0.833 0.833 ¦ 0.500 0.833 ¦ 0.167 0.167 +-------------------------- ------+ 0.118 ¦ 0.0 0.0 0.0 0.0 0.0 0.0 0.0 0.0 0.0 0.0 0.0 ¦ Exports 0.029 ¦ 0.0 0.0 0.0 0.0 0.0 0.0 0.0 0.0 0.0 0.0 0.0 ¦ Invest. 0.0 0.0 0.0 0.0 0.0 0.0 0.0 0.0 0.0 0.0 0.058 ¦0.0 ¦ Confid. 0.0 0.0 0.0 0.0 0.0 0.0 0.0 0.0 0.0 0.0 0.334 ¦0.0 ¦ Fiscal 0.118 ¦0.0 0.0 0.0 0.0 0.0 0.0 0.0 0.0 0.0 0.0 0.0 Policy ¦ Monetary 0.343 ¦0.0 0.0 0.0 0.0 0.0 0.0 0.0 0.0 0.0 0.0 0.0 Policy ------+ +----+ Financ. 0.0 0.0 0.0 0.0 0.0 0.0 0.0 0.0 0.0 0.0 ¦0.584¦ 0.0 Sector ¦ ¦ ¦ ¦ Defense 0.0 0.0 0.0 0.0 0.0 0.0 0.0 0.0 0.0 0.0 ¦0.281¦ 0.0 Posture ¦ ¦ ¦ ¦ Global 0.0 0.0 0.0 0.0 0.0 0.0 0.0 0.0 0.0 0.0 ¦0.135¦ 0.0 Compet. +----+ +------------------------------------------------------------------+ 3 months 0.0 0.0 ¦ 0.043 0.083 0.078 0.517 0.099 0.605 0.049 0.049 0.089 ¦ 0.0 ¦ ¦ 6 months 0.0 0.0 ¦ 0.113 0.083 0.078 0.305 0.086 0.262 0.085 0.085 0.089 ¦ 0.0 ¦ ¦ 1 year 0.0 0.0 ¦ 0.310 0.417 0.305 0.124 0.383 0.042 0.236 0.236 0.209 ¦ 0.0 ¦ ¦ 2 0.0 ¦ 0.534 0.417 0.539 0.054 0.432 0.091 0.630 0.630 0.613 ¦ 0.0 ≥ years 0.0 Consum. 6 mo. 1 yr. 2 ≥ years 0.0 0.0 0.0 0.0 0.0 0.0 0.0 0.0 0.0 0.0 0.0 0.0 0.0 0.0 0.0 0.0 0.0 0.0 0.0 0.0 0.0 0.0 0.0 0.0 0.0 0.0 0.0 0.0 0.0 0.0 0.0 0.0 0.0 0.0 0.0 0.0 0.0 0.0 0.0 35
  • 36. Table 6: The Limiting Supermatrix Conven. Economic. Consum. Adjust Restruc. Exports Invest. Confid. Fiscal Policy Monet. Policy Financ. Sector Defense Posture Global Compet. 6 mo. 1 yr. ≥ 2 years 0.0 0.0 0.0 0.0 0.0 0.0 0.0 0.0 Conven. Adjust Economic Restru. 0.0 Consum. 0.0 0.0 0.0 0.0 0.0 0.0 0.0 0.0 0.0 0.0 0.0 Exports 0.0 0.0 0.0 0.0 0.0 0.0 0.0 0.0 0.0 0.0 0.0 Invest. 0.0 0.0 0.0 0.0 0.0 0.0 0.0 0.0 0.0 0.0 0.0 Confid. 0.0 0.0 0.0 0.0 0.0 0.0 0.0 0.0 0.0 0.0 0.0 Fiscal Policy Monetary Policy Financ. Sector Defense Posture Global Compet. 0.0 0.0 0.0 0.0 0.0 0.0 0.0 0.0 0.0 0.0 0.0 0.0 0.0 0.0 0.0 0.0 0.0 0.0 0.0 0.0 0.0 0.0 0.0 0.0 0.0 0.0 0.0 0.0 0.0 0.0 0.0 0.0 0.0 0.0 0.0 0.0 0.0 0.0 0.0 0.0 0.0 0.0 0.0 0.0 0.0 0.0 0.0 0.0 0.0 0.0 0.0 0.0 0.0 0.0 0.0 0.0 0.0 0.0 0.0 0.0 0.0 0.0 0.0 0.0 0.0 0.0 0.0 0.0 0.0 0.0 0.0 0.0 0.0 0.0 0.0 0.0 0.0 0.0 0.0 0.0 0.0 0.0 0.0 0.0 0.0 0.0 0.0 0.0 0.0 0.0 0.0 0.0 0.0 0.0 0.0 0.0 0.0 0.0 0.0 0.0 0.0 0.0 0.0 0.0 0.0  0.484 0.484 0.484 0.484 0.484 0.484 0.484 0.484 0.484    0.0  0.516 0.516 0.516 0.516 0.516 0.516 0.516 0.516 0.516   3 mo.  0.224 0.224  0.0  6 months 0.151 0.151 0.0  1 year 0.201 0.201  0.0  0.424 0.424  0.0 ≥ 2 years 3 months  0.057 0.057 0.057 0.057  0.014 0.014 0.014 0.014  0.028 0.028 0.028 0.028  0.162 0.162 0.162 0.162  0.057 0.057 0.057 0.057  0.166 0.166 0.166 0.166  0.301 0.301 0.301 0.301  0.145 0.145 0.145 0.145  0.070 0.070 0.070 0.070  36
  • 37. Synthesis/Results When the judgments were made, the AHP framework was used to perform a synthesis which produced the following results. First a meaningful turnaround in the economy would likely require an additional ten to eleven months, occurring during the fourth quarter of 1992. This forecast is derived from weights generated in the first column of the limiting matrix in Table 6, coupled with the mid-points of the alternate time periods (so as to provide unbiased estimates: .224 x 1.5 + .151 x 4.5 + .201 x 9 + .424 x 18 = 10.45 months from late December 1991/early January 1992 37
  • 38. The Strength of Recovery Primary Factors Conventional Adjustment Subfactors Consumption (C) Exports (X) Investment (I) Fiscal Policy (F) Monetary Policy (M) Confidence (K) Very Strong (5.5-6.5% GNP) Strong (4.5-5.5% GNP) Economic Restructuring Financial Sector (FS) Defense Posture (DP) Global Competition (GC) Moderate (3-4.5% GNP) Weak (2-3% GNP) 38
  • 39. Table 7: Matrices for Primary and Subfactors for Strength of Recovery Panel A: Which primary factor will be more influential in determining the Strength of Recovery? Vector CA R Weights Conventional Adjustment (CA) Restructuring (R) 1 5 1/5 1 .167 .833 Panel B: Which subfactor is more important in influencing Conventional Adjustment? C Consumption (C) Exports (E) Investment (I) Confidence (K) Fiscal Policy (F) Monetary Policy (M) E I K F M Vector Weights 1 1/7 1/3 1 1/7 1/3 7 1 5 5 1 7 3 1/5 1 3 3 5 1 1/5 1/3 1 1/7 1/3 7 1 1/3 7 1 7 3 1/5 1/5 3 1/7 1 0.317 0.037 0.099 0.305 0.035 0.207 Panel C: Which subfactor is more important in influencing Economic Restructuring? FS Financial Sector (FS) Defense Posture (DS) Global Competition (GC) DP GC Vector Weights 1 1/5 1/3 0.105 5 1 3 0.637 3 1/3 1 0.258 CI = 0.037 39
  • 40. Table 8: Matrices for relative influence of subfactors on Strength of Recovery (Conventional Adjustment) For each panel below, which intensity is more likely to obtain if the designated factor drives the recovery? Panel A: Relative likelihood of the strength of recovery if consumption drives the expansion V S M W Vec. Wts. Very Strong (V) 1 Strong (S) 1 1/5 Moderate (M) 1/7 Weak (W) 1 1 1/5 1/7 5 5 1 1/3 7 7 3 1 .423 .423 .104 .051 CI = 0.028 Panel B: Relative likelihood of the strength of recovery if exports drives the expansion V Very Strong (V) 1 Strong (S) 1 3 Moderate (M) 5 Weak (W) S M 1 1 3 5 1/3 1/3 1 3 W 1/5 1/5 1/3 1 Vec. Wts. .095 .095 .249 .560 CI = 0.016 Panel C: Relative likelihood of the strength of recovery if investment drives the expansion V S M W Vec. Wts. Panel D: Relative likelihood of the strength of recovery if confidence drives the expansion V S M W Vec. Wts. Very Strong (V) 1 Strong (S) 1 3 Moderate (M) 1/2 Weak (W) Very Strong (V) 1 Strong (S) 1 1/3 Moderate (M) 1/5 Weak (W) 1 1 3 1/2 1/3 1/3 1 1/6 2 2 6 1 .182 .182 .545 .091 CI = 0.0 1 1 1/3 1/5 3 3 1/3 1/7 5 5 7 1 .376 .376 .193 .054 CI = 0.101 Panel E: Relative likelihood of the strength of recovery if fiscal policy drive the expansion V S M W Vec. Wts. Panel F: Relative likelihood of the strength of recovery if monetary policy drives the expansion V S M W Vec. Wts. Very Strong (V) Strong (S) Very Strong (V) 1 Strong (S) 1 5 Moderate (M) 3 Weak (W) Moderate (M) Weak (W) 1 1 5 1 1 1 5 1 1/5 1/5 1 1/5 CI = 0.0 1 1 5 1 .125 .125 .625 .125 1 1 5 3 1/5 1/5 1 1/7 CI = 0.101 40 1/3 1/3 7 1 .084 .084 .649 .183
  • 41. Table 9: Matrices for relative influence of subfactors on Strength of Recovery (Restructuring) For each panel below, which intensity is more likely to obtain if the designated factor drives the recovery? Panel A: Relative likelihood of the strength of recovery if financial sector drives the expansion V S M W Vec. Wts. Very Strong (V) 1 Strong (S) 1 3 Moderate (M) 5 Weak (W) 1 1 3 5 1/3 1/3 1 1/3 1/5 1/5 1/3 1 Panel B: Relative likelihood of the strength of recovery if defense posture drives the expansion V S M W Vec. Wts. .095 .095 .249 .560 Very Strong (V) 1 Strong (S) 3 5 Moderate (M) 7 Weak (W) CI = 0.016 1/3 1 3 5 1/5 1/3 1 3 1/7 1/5 1/3 1 .055 .118 .262 .565 CI = 0.044 Panel C: Relative likelihood of the strength of recovery if global competition drives the expansion V S M W Vec. Wts. Very Strong (V) 1 Strong (S) 1 3 Moderate (M) 5 Weak (W) 1 1 3 5 1/3 1/3 1 1 1/5 1/5 1 1 .101 .101 .348 .449 CI = 0.012 Table 10: Overall Results for Strength of Recovery % GNP Growth Very Strong (5.56.5) Strong (4.5-.5) Moderate (3-4.5) Weak (2-3) 0.108 0.141 0.290 0.461 % GNP Recovery Rate* 3.6 *% GNP Recovery rate calculated using the relative strength of conventional adjustment and restructuring in Table 5 Panel A each used to multiply midpoints of % GNP Growth and then summed. 41
  • 42. Hamburger Model Estimating Market Share of Wendy’s, Burger King and McDonald’s with respect to the single economic control criterion 42
  • 43. How to Pose the Question to Make Paired Comparisons • One must answer questions of the following kind: given McDonald’s (in the Alternatives cluster) is its economic strength derived more from Creativity or from Frequency (both in the Advertising cluster)? Conversely, given Creativity in the Advertising cluster who is more dominant, McDonald’s or Burger King? • Then, again, by comparing the dominance impact of the clusters of Advertising and Quality of Food on the economic success of McDonald by weighting and normalizing we can relate the relative effect of elements in these different clusters. 43
  • 44. Hamburger Model Supermatrix Other Quality Advertising Competition Local: O t h e r Q Ad C o m p Menu Cleanli ness Speed Service Location Price Reputa tion Take Out Portion Taste Nutri tion Freq uency Promo tion Creativ ity Wendy’s Burger King McDonald’s Menu Item Cleanliness Speed Service Location Price Reputation Take-Out Portion Taste Nutrition Frequency Promotion Creativity Wendy's Burger King McDonald’s 0.0000 0.6370 0.1940 0.0000 0.0530 0.1170 0.0000 0.0000 0.2290 0.6960 0.0750 0.7500 0.1710 0.0780 0.3110 0.1960 0.4930 0.0000 0.0000 0.7500 0.0780 0.1710 0.0000 0.0000 0.0000 0.0000 0.0000 0.0000 0.0000 0.0000 0.0000 0.5000 0.2500 0.2500 0.0000 0.0000 0.0000 0.1880 0.0000 0.0000 0.0810 0.7310 0.0000 0.0000 0.0000 0.0000 0.0000 0.0000 0.0990 0.3640 0.5370 0.0000 0.5190 0.2850 0.0000 0.0980 0.0000 0.0980 0.0000 0.0000 0.0000 0.0000 0.0000 0.0000 0.0000 0.5280 0.1400 0.3330 0.0000 0.0000 0.0000 0.0000 0.0000 0.0000 0.0000 0.0000 0.0000 0.0000 0.0000 0.0000 0.0000 0.0000 0.0950 0.2500 0.6550 0.0000 0.0000 0.0000 0.0000 0.5000 0.0000 0.0000 0.5000 0.8330 0.0000 0.1670 0.1670 0.8330 0.0000 0.0950 0.2500 0.6550 0.1930 0.2390 0.0830 0.0450 0.2640 0.0620 0.0570 0.0570 0.2800 0.6270 0.0940 0.5500 0.3680 0.0820 0.1010 0.2260 0.6740 0.0000 0.0000 0.2900 0.0550 0.6550 0.0000 0.0000 0.0000 0.0000 0.0000 0.0000 0.0000 0.0000 0.0000 0.1960 0.3110 0.4940 0.0000 0.0000 0.0000 0.0000 0.0000 0.8570 0.0000 0.1430 0.0000 0.0000 0.0000 0.0000 0.0000 0.0000 0.2760 0.1280 0.5950 0.0000 0.0000 0.0000 0.0000 0.0000 0.0000 0.0000 0.0000 0.0000 0.0000 0.0000 0.0000 0.0000 0.0000 0.6050 0.1050 0.2910 0.0000 0.0000 0.0000 0.0000 0.0000 0.0000 0.0000 0.0000 0.0000 0.0000 0.0000 0.0000 0.0000 0.0000 0.5940 0.1570 0.2490 0.3110 0.0000 0.0000 0.0000 0.1960 0.0000 0.4930 0.0000 0.0000 0.0000 0.0000 0.0000 0.5000 0.5000 0.0880 0.1950 0.7170 0.1670 0.0000 0.0000 0.0000 0.0000 0.8330 0.0000 0.0000 0.0000 0.0000 0.0000 0.6670 0.0000 0.3330 0.0880 0.1950 0.7170 0.1350 0.0000 0.0000 0.0000 0.7100 0.0000 0.1550 0.0000 0.0000 0.0000 0.0000 0.8750 0.1250 0.0000 0.1170 0.2680 0.6140 0.1570 0.2760 0.0640 0.0650 0.1420 0.0300 0.2070 0.0590 0.0940 0.2800 0.6270 0.6490 0.0720 0.2790 0.0000 0.2500 0.7500 0.0510 0.1100 0.1400 0.1430 0.2240 0.2390 0.0420 0.0510 0.6490 0.0720 0.2790 0.7090 0.1130 0.1790 0.1670 0.0000 0.8330 0.1590 0.3330 0.0480 0.0240 0.1070 0.0330 0.2230 0.0740 0.5280 0.1400 0.3320 0.6610 0.1310 0.2080 0.2000 0.8000 0.0000 Cluster Priorities Matrix Cluster: Other Quality Advertising Competition Other 0.198 0.066 0.607 0.129 Quality 0.500 0.000 0.000 0.500 Advertising 0.131 0.000 0.622 0.247 Competition 0.187 0.066 0.533 0.215 44
  • 45. Weighted Supermatrix Weighted: Menu Cleanli ness Speed Service Location Price Reputa tion Take Out Portion Taste Nutri tion Freq uency Promo tion Creativ ity Wendy’s Burger King McDonald’s Menu Item Cleanliness Speed Service Location Price Reputation Take-Out Portion Taste Nutrition Frequency Promotion Creativity Wendy's Burger King McDonald ‘s 0.0000 0.1262 0.0384 0.0000 0.0105 0.0232 0.0000 0.0000 0.0151 0.0460 0.0050 0.4554 0.1038 0.0474 0.0401 0.0253 0.0636 0.0000 0.0000 0.4544 0.0473 0.1036 0.0000 0.0000 0.0000 0.0000 0.0000 0.0000 0.0000 0.0000 0.0000 0.1974 0.0987 0.0987 0.0000 0.0000 0.0000 0.1138 0.0000 0.0000 0.0490 0.4426 0.0000 0.0000 0.0000 0.0000 0.0000 0.0000 0.0391 0.1436 0.2118 0.0000 0.3141 0.1725 0.0000 0.0593 0.0000 0.0593 0.0000 0.0000 0.0000 0.0000 0.0000 0.0000 0.0000 0.2082 0.0552 0.1313 0.0000 0.0000 0.0000 0.0000 0.0000 0.0000 0.0000 0.0000 0.0000 0.0000 0.0000 0.0000 0.0000 0.0000 0.0950 0.2500 0.6550 0.0000 0.0000 0.0000 0.0000 0.0990 0.0000 0.0000 0.0990 0.0550 0.0000 0.0110 0.1014 0.5056 0.0000 0.0123 0.0323 0.0845 0.0382 0.0473 0.0164 0.0089 0.0523 0.0123 0.0113 0.0113 0.0185 0.0414 0.0062 0.3338 0.2233 0.0498 0.0130 0.0291 0.0869 0.0000 0.0000 0.1755 0.0333 0.3964 0.0000 0.0000 0.0000 0.0000 0.0000 0.0000 0.0000 0.0000 0.0000 0.0773 0.1226 0.1948 0.0000 0.0000 0.0000 0.0000 0.0000 0.4287 0.0000 0.0715 0.0000 0.0000 0.0000 0.0000 0.0000 0.0000 0.1381 0.0640 0.2976 0.0000 0.0000 0.0000 0.0000 0.0000 0.0000 0.0000 0.0000 0.0000 0.0000 0.0000 0.0000 0.0000 0.0000 0.6044 0.1049 0.2907 0.0000 0.0000 0.0000 0.0000 0.0000 0.0000 0.0000 0.0000 0.0000 0.0000 0.0000 0.0000 0.0000 0.0000 0.5940 0.1570 0.2490 0.0407 0.0000 0.0000 0.0000 0.0257 0.0000 0.0646 0.0000 0.0000 0.0000 0.0000 0.0000 0.3110 0.3110 0.0217 0.0482 0.1771 0.0219 0.0000 0.0000 0.0000 0.0000 0.1091 0.0000 0.0000 0.0000 0.0000 0.0000 0.4149 0.0000 0.2071 0.0217 0.0482 0.1771 0.0177 0.0000 0.0000 0.0000 0.0930 0.0000 0.0203 0.0000 0.0000 0.0000 0.0000 0.5444 0.0778 0.0000 0.0289 0.0662 0.1517 0.0293 0.0516 0.0120 0.0121 0.0265 0.0056 0.0387 0.0110 0.0062 0.0185 0.0413 0.3455 0.0383 0.1485 0.0000 0.0537 0.1611 0.0095 0.0205 0.0261 0.0267 0.0418 0.0446 0.0078 0.0095 0.0428 0.0047 0.0184 0.3773 0.0601 0.0953 0.0359 0.0000 0.1788 0.0297 0.0622 0.0090 0.0045 0.0200 0.0062 0.0417 0.0138 0.0348 0.0092 0.0219 0.3519 0.0697 0.1107 0.0429 0.1718 0.0000 Synthesized: Global Menu Cleanli ness Speed Service Location Price Reputa tion Take Out Portion Taste Nutri tion Freq uency Promo tion Creativ ity Wendy’s Burger King McDonald’s Menu Item Cleanliness Speed Service Location Price Reputation Take-Out Portion Taste Nutrition Frequency Promotion Creativity Wendy's Burger King McDonald’s 0.0234 0.0203 0.0185 0.0072 0.0397 0.0244 0.0296 0.0152 0.0114 0.0049 0.0073 0.2518 0.1279 0.1388 0.0435 0.0784 0.1579 0.0234 0.0203 0.0185 0.0072 0.0397 0.0244 0.0296 0.0152 0.0114 0.0049 0.0073 0.2518 0.1279 0.1388 0.0435 0.0784 0.1579 0.0234 0.0203 0.0185 0.0072 0.0397 0.0244 0.0296 0.0152 0.0114 0.0049 0.0073 0.2518 0.1279 0.1388 0.0435 0.0784 0.1579 0.0234 0.0203 0.0185 0.0072 0.0397 0.0244 0.0296 0.0152 0.0114 0.0049 0.0073 0.2518 0.1279 0.1388 0.0435 0.0784 0.1579 0.0234 0.0203 0.0185 0.0072 0.0397 0.0244 0.0296 0.0152 0.0114 0.0049 0.0073 0.2518 0.1279 0.1388 0.0435 0.0784 0.1579 0.0234 0.0203 0.0185 0.0072 0.0397 0.0244 0.0296 0.0152 0.0114 0.0049 0.0073 0.2518 0.1279 0.1388 0.0435 0.0784 0.1579 0.0234 0.0203 0.0185 0.0072 0.0397 0.0244 0.0296 0.0152 0.0114 0.0049 0.0073 0.2518 0.1279 0.1388 0.0435 0.0784 0.1579 0.0234 0.0203 0.0185 0.0072 0.0397 0.0244 0.0296 0.0152 0.0114 0.0049 0.0073 0.2518 0.1279 0.1388 0.0435 0.0784 0.1579 0.0234 0.0203 0.0185 0.0072 0.0397 0.0244 0.0296 0.0152 0.0114 0.0049 0.0073 0.2518 0.1279 0.1388 0.0435 0.0784 0.1579 0.0234 0.0203 0.0185 0.0072 0.0397 0.0244 0.0296 0.0152 0.0114 0.0049 0.0073 0.2518 0.1279 0.1388 0.0435 0.0784 0.1579 0.0234 0.0203 0.0185 0.0072 0.0397 0.0244 0.0296 0.0152 0.0114 0.0049 0.0073 0.2518 0.1279 0.1388 0.0435 0.0784 0.1579 0.0234 0.0203 0.0185 0.0072 0.0397 0.0244 0.0296 0.0152 0.0114 0.0049 0.0073 0.2518 0.1279 0.1388 0.0435 0.0784 0.1579 0.0234 0.0203 0.0185 0.0072 0.0397 0.0244 0.0296 0.0152 0.0114 0.0049 0.0073 0.2518 0.1279 0.1388 0.0435 0.0784 0.1579 0.0234 0.0203 0.0185 0.0072 0.0397 0.0244 0.0296 0.0152 0.0114 0.0049 0.0073 0.2518 0.1279 0.1388 0.0435 0.0784 0.1579 0.0234 0.0203 0.0185 0.0072 0.0397 0.0244 0.0296 0.0152 0.0114 0.0049 0.0073 0.2518 0.1279 0.1388 0.0435 0.0784 0.1579 0.0234 0.0203 0.0185 0.0072 0.0397 0.0244 0.0296 0.0152 0.0114 0.0049 0.0073 0.2518 0.1279 0.1388 0.0435 0.0784 0.1579 0.0234 0.0203 0.0185 0.0072 0.0397 0.0244 0.0296 0.0152 0.0114 0.0049 0.0073 0.2518 0.1279 0.1388 0.0435 0.0784 0.1579 Limiting Supermatrix { Relative local weights: Wendy’s= 0.156, Burger King =0.281, and McDonald’s=0.566 45
  • 46. Validation The same problem worked as a simple and a complex hierarchy and as a feedback network. 46
  • 47. Hamburger Model Synthesized Local: Other Quality Synthesized Local Cont’d: Menu Item Cleanliness Speed Service Location Price Reputation Take-Out Portion Taste Nutrition Simple Hierarchy (Three Level) Wendy’s Burger King McDonald’s 0.3055 0.2305 0.4640 0.132 0.115 0.104 0.040 0.224 0.138 0.167 0.086 0.494 0.214 0.316 Advertising Competition Complex Hierarchy (Several Levels) 0.1884 0.2689 0.5427 Frequency Promotion Creativity Wendy’s Burger King McDonald’s Feedback Network 0.156 0.281 0.566 47 0.485 0.246 0.267 0.156 0.281 0.566 Actual Market Share 0.1320 0.2857 0.5823
  • 48. 48
  • 49. Strategic Planning for the Future of the University of Pittsburgh Medical Center Using the Analytic Network Process(ANP) 49
  • 50. Evaluate Strategies for the University Health Network to Compete in a Managed Care Environment Benefits Control Model Costs Control Model B e n e f it s S o c ia l Social Benefits Network Submodel Risks Control Model C o s ts E c o n o m ic P o lit ic a l S o c ia l Economic Benefits Network Submodel Political Benefits Network Submodel Social Costs Network Submodel E c o n o m ic Economic Costs Network Submodel R is k s P o lit ic a l Political Costs Network Submodel S o c ia l E c o n o m ic Social Risks Network Submodel 50 Economic Risks Network Submodel P o lit ic a l Political Risks Network Submodel
  • 51. List of Clusters and Elements (Not all the Clusters appear in all 9 of the sub-models.) Cluster Names Cluster Elements Clients Businesses- businesses that offer employees health care plans Consumers- individuals who purchase their own health coverage Insurers- companies who sell health insurance Competition Competitors- other hospitals in Pittsburgh that compete w/ UPMC Convenience Time- expended by customer scheduling, traveling, and actual waiting room Safety- safety of location Internal Stakeholders Physicians- working for UPMC Administrators- planners, managers, decision makers of UPMC Alliances- outside organizations, involved: isurers, hospitals, physician networks Staff- non-physician, non-administrative personel Public Relations Public Relations- UPMC’s public image: TV, Newspaper, Radio Quality Specialty quality non-general health services, Diversity- range of health services offered by UPMC Care- quality of general health services Research- quality of research at UPMC *Strategies Improve and Measure Outcomes- measure effectiveness to improve service Capitalization- negotiated insurance contracts with fixed payments Develop a Primary Network- increase number of primary care physicians Internal Cost Reduction- cut facilities, employees, and high cost procedures Teach Primary Care- shift focus from curative care to preventive care Variety of Services Internal Medicine and Surgery- Curative specialty services and hospitalization Cancer Treatment- cancer treatment cure Outpatient Care- preventive care and short term medical treatments *Strategies apperar in every sub-moadel as alternatives of choice 51
  • 52. Clusters and Elements in the Economic Benefits Sub-model 52
  • 53. Benefits & Costs Predicting the Superbowl Winner ‘96 & ‘97 53
  • 54. Pre-start (early December 1995) Wild Card Games Benefits Costs B/C Miami vs. Buffalo 1996 Playoffs Team 0.701 0.745 0.612 0.590 1.145 1.263 Indianapolis vs. San Diego 0.687 0.660 0.622 0.650 1.105 1.015 Detroit vs. Philadelphia 0.625 0.695 0.636 0.580 0.983 1.198 Atlanta vs. Green Bay 0.590 0.785 0.612 0.515 All predictions correct except for two games below. 0.964 1.524 Second Round Pittsburgh vs. Buffalo 0.740 0.704 0.581 0.605 1.274 1.164 Indianapolis vs. Kansas City 0.695 0.750 0.590 0.575 1.178 1.304 Kansas kicker missed 3 field goals & ruined them. No way to know his ailments that day. Green Bay vs. San Francisco 0.755 0.751 0.590 0.585 1.280 1.284 Was too close to determine the winner. Green Bay won. Philadelphia vs. Dallas 0.732 0.759 0.641 0.576 1.142 1.318 Divisional Playoffs Dallas vs. Green Bay 0.742 0.756 0.540 0.561 1.370 1.350 Pittsburgh vs. Indianapolis 0.699 0.741 0.555 0.598 1.260 1.240 The Super Bowl Dallas vs. Pittsburgh 0.761 0.748 0.728 0.735 1.045 1.018 54
  • 55. Pre-start (early December 1996) The first predictions were wrong on three games which then required revision. Playoff Predictions Pre-Start Predicted Outcomes AFC 1997 Playoffs Team Benefits Costs B/C Winner Las Vegas Wild Cards Indianapolis Pittsburgh 0.588 0.592 0.489 0.477 1.2 1.24 Pittsburgh Jacksonville Buffalo 0.601 0.594 0.501 0.487 1.2 1.22 Buffalo Wrong prediction. Pittsburgh New England 0.609 0.516 0.479 0.419 1.27 1.23 Pittsburgh Wrong prediction. Buffalo Denver 0.551 0.62 0.488 0.447 1.13 1.39 Denver Wrong prediction. Pittsburgh Denver 0.633 0.686 0.523 0.5318 1.21 1.29 Denver Philadelphia San Francisco 0.557 0.621 0.467 0.444 1.19 1.4 San Francisco Minnesota Dallas 0.545 0.571 0.488 0.476 1.12 1.2 Dallas San Francisco Green Bay 0.585 0.685 0.5 0.46 1.17 1.49 Green Bay Dallas Carolina 0.522 0.51 0.494 0.448 1.06 1.14 Carolina Carolina Green Bay 0.511 0.643 0.498 0.521 1.03 1.23 Green Bay 0.618 0.556 0.457 0.476 1.35 1.17 Green Bay Conference Finals NFC Wild Cards Conference Finals Super Bowl Green Bay Denver 55
  • 56. Post-start (before Conference Finals) Playoff P redictions A gains error in one game. Predicted Outcomes AFC Team Benefits Costs B/C Winner Actual Conference Finals Jacksonville Denver 0.545 0.612 0.488 0.447 1.12 Denver 1.37 Jacksonville New England 0.576 0.645 0.515 0.519 1.12 New Eng 1.24 NE 0.627 0.653 0.554 0.506 1.13 1.29 Green Bay Jax Super Bowl New England Green Bay 56
  • 58. Benefits Supermatrix Local Weights Offense QB Ability Running Emotions Play Above Ability Coaching Emotional State Outside Home Field Road Ahead Teams Dallas Green Bay Offensive Global 0.0297 0.3140 Local 0.0864 0.9136 0.0037 0.0235 0.0923 0.0433 0.3670 0.1227 0.0039 0.0309 0.1962 0.7724 0.1055 0.8945 0.9693 0.0308 QB Ability Emotions Running Play Above 1.0000 Outside Coaching 0.8000 0.2000 Emotions 1.0000 Home Field .8000 .2000 Road Ahead 1.0000 Teams Dallas Green Bay 0.8000 0.2000 1.0000 0.7500 0.2500 1.0000 1.0000 1.0000 1.0000 0.7500 0.2500 1.0000 CLUSTER WEIGHTS Offense Offense 0.0000 Emotions 0.2176 Outside 0.0914 Team 0.6910 Emotions 0.2449 0.0000 0.0902 0.6648 Outside 0.6442 0.0852 0.0000 0.2706 Teams 0.7172 0.1947 0.0881 0.0000 58 1.0000 1.0000 1.0000 0.2000 0.8000
  • 59. Weighted Supermatrix Cluster Weights Offense QB Ability Running Emotions Play Above Ability Coaching Emotional State Outside Home Field Road Ahead Teams Dallas Green Bay Offensive Global 0.0297 0.3140 Local 0.0864 0.9136 0.0037 0.0235 0.0923 0.0433 0.3670 0.1227 0.0039 0.0309 0.1962 0.7724 0.1055 0.8945 0.9693 0.0308 QB Ability Emotions Running Play Above 0.7308 Coaching 0.1959 0.0490 Outside Emotions 0.7308 Home Field 0.5154 0.1288 Teams Road Ahead Dallas Green Bay 0.7125 0.1781 0.6442 0.0852 0.0639 0.0213 1.0000 1.0000 0.2692 0.0902 0.4986 0.1662 0.6885 0.3115 0.0538 0.2153 0.2706 0.0219 0.0875 0.2706 Limiting Benefits Supermatrix Offensive Offense Emotions Outside Teams QB Ability Running Play Above Ability Coaching Emotional State Home Field Road Ahead Dallas Green Bay Emotions Global 0.0297 0.3140 Local 0.0297 0.3140 QB Ability 0.0297 0.3140 0.0037 0.0235 0.0923 0.0433 0.3670 0.1227 0.0039 0.0037 0.0235 0.0923 0.0433 0.3670 0.1227 0.0039 0.0037 0.0235 0.0923 0.0433 0.3670 0.1227 0.0039 Running Play Above 0.0297 0.0297 0.3140 0.3140 0.0037 0.0235 0.0923 0.0433 0.3670 0.1227 0.0039 0.0037 0.0235 0.0923 0.0433 0.3670 0.1227 0.0039 Outside Teams Coaching 0.0297 0.3140 Emotions 0.0297 0.3140 Home Field 0.0297 0.3140 0.0037 0.0235 0.0923 0.0433 0.3670 0.1227 0.0039 0.0037 0.0235 0.0923 0.0433 0.3670 0.1227 0.0039 0.0037 0.0235 0.0923 0.0433 0.3670 0.1227 0.0039 59 Road Ahead 0.0297 0.3140 0.0037 0.0235 0.0923 0.0433 0.3670 0.1227 0.0039 Dallas Green Bay 0.0297 0.0297 0.3140 0.3140 0.0037 0.0235 0.0923 0.0433 0.3670 0.1227 0.0039 0.0037 0.0235 0.0923 0.0433 0.3670 0.1227 0.0039
  • 60. Costs Supermatrix Local Weights Offense History Outside Teams Road Ahead Immature Players Not Full Strength Cinderella Play Bey Ability Past Failures Mental State Weather Dallas Green Bay Offensive Global 0.1529 0.0000 0.2261 0.0011 0.2002 0.0738 0.0121 0.1683 0.1653 0.0000 Local 0.4034 0.0000 0.5966 0.0041 0.7278 0.2683 0.0673 0.9332 1.0002 0.0000 Emotions Immature Not Full Road Ahead Players Strength Outside Cinderella 1.0000 Play beyond Past Mental Ability Failures State 0.8000 0.8000 0.2000 1.0000 0.2000 1.0000 0.8333 0.1667 0.8571 0.1429 1.0000 Emotions 0.3614 0.0000 0.0650 0.5736 1.0000 1.0000 Outside 0.6267 0.0936 0.0000 0.2797 Weather 1.0000 0.7500 0.2500 1.0000 CLUSTER WEIGHTS Offense Offense 0.0000 Emotions 0.0877 Outside 0.1392 Team 0.7731 Teams Teams 0.7172 0.1947 0.0881 0.0000 60 1.0000 Dallas Green Bay 0.7500 0.2000 0.2500 0.8000 0.7500 0.2500 1.0000 0.8333 1.000 0.1667
  • 61. Weighted Supermatrix Cluster Weighted Offense History Outside Teams Road Ahead Immature Players Not Full Strength Cinderella Play Bey Ability Past Failures Mental State Weather Dallas Green Bay Offensive Global 0.1529 0.0000 0.2261 0.0011 0.2002 0.0738 0.0121 0.1683 0.1653 0.0000 Local 0.4034 0.0000 0.5966 0.0041 0.7278 0.2683 0.0673 0.9332 1.0002 0.0000 Emotions Immature Not Full Road Ahead Players Strength Outside Cinderella 1.0000 Play beyond Past Mental Ability Failures State 0.2891 0.5014 0.0723 Weather 1.0000 0.1253 0.0936 0.8333 0.1667 1.0000 Teams 0.6267 0.0702 0.0234 0.8571 0.1429 0.2797 Dallas Green Bay 0.5379 0.1434 0.1793 0.5738 0.1947 0.0734 0.0147 0.2797 Limiting Costs Supermatrix Offensive Offense History Outside Teams Road Ahead Immature Players Not Full Strength Cinderella Play Bey Ability Past Failures Mental State Weather Dallas Green Bay Emotions 0.1460 0.0487 0.0881 Outside Teams Global Local 0.1529 0.1529 Immature Not Full Road Ahead Players Strength 0.1529 0.1529 0.1529 Cinderella 0.1529 Play beyond Ability 0.1529 Weather 0.1529 Dallas 0.1529 Green Bay 0.1529 0.0000 0.0000 0.0000 0.0000 0.0000 0.0000 0.0000 0.0000 0.0000 0.0000 0.0000 0.0000 0.2261 0.0011 0.2002 0.0738 0.0212 0.1683 0.1653 0.0000 0.2261 0.0011 0.2002 0.0738 0.0212 0.1683 0.1653 0.0000 0.2261 0.0011 0.2002 0.0738 0.0212 0.1683 0.1653 0.0000 0.2261 0.0011 0.2002 0.0738 0.0212 0.1683 0.1653 0.0000 0.2261 0.0011 0.2002 0.0738 0.0212 0.1683 0.1653 0.0000 0.2261 0.0011 0.2002 0.0738 0.0212 0.1683 0.1653 0.0000 0.2261 0.0011 0.2002 0.0738 0.0212 0.1683 0.1653 0.0000 0.2261 0.0011 0.2002 0.0738 0.0212 0.1683 0.1653 0.0000 0.2261 0.0011 0.2002 0.0738 0.0212 0.1683 0.1653 0.0000 Past Mental Failures State 0.1529 0.1529 0.2261 0.0011 0.2002 0.0738 0.0212 0.1683 0.1653 0.0000 0.2261 0.0011 0.2002 0.0738 0.0212 0.1683 0.1653 0.0000 61 0.2261 0.0011 0.2002 0.0738 0.0212 0.1683 0.1653 0.0000
  • 62. Benefits Intensity Priorities Quarterback (0.030): Average (0.091) Running Game (0.314): Average (0.084) Good (0.281) Good (0.211)GB Play Above Potential (0.004): Average (0.075) Good (0.229)D Coaching Ability to Inspire (0.023): Not A lot (0.078) Emotional State (0.092): Apathy (0.082) Home Field Advantage (0.043): Neutral (0.105) The Road Ahead (0.367): No Effect (0.082) Somewhat (0.205)D High Ability (0.691)GB,D High Ability (0.705)D High Play Level (0.696)GB Heroic (0.717)GB Mediocre (0.236) Excitement (0.682)GB,D Some Effect (0.258)GB Significant Effect (0.637)D Some Effect (0.236)D Very Confident (0.682)GB Dallas’ Effect on the Ultimate Outcome (0.123): Medium (0.280) Low Effect (0.094) Greatly Influenced (0.627)GB,D Green Bay’s Effect on the Ultimate Outcome (0.004): Medium (0.258) Not Much (0.105) Greatly Influenced (0.637)GB,D Costs Intensity Priorities The Road Ahead (0.153): Low Effect (0.085) Somewhat (0.271)GB,D High Effect (0.644) Not at Full Strength (0.226): Few Injuries (0.091) Some Injuries (0.218) Big Injury Problems (0.644) GB,D Playing Beyond Ability (0.200): Not a factor (0.094) GB,D May Falter (0.288) Venerable (0.627) Past Failures (0.074): Good History (0.082) GB Can’t get it Gone (0.682) Mental State of Preparedness (0.012): Ready (0.122)GB Mixed Past (0.236)D May be Hurt (0.230)D Unready (0.648) Cinderalla Team (0.001): Good Team Not Cinderalla (0.082) GB,D Lucky (0.236) It’s Midnight (0.682) Weather Sensitivity (0.168): Small Anything Goes (0.095)D Sensitivity (0.250)GB High Sensitivity (0.655) Dallas’ Effect (0.165): Small (0.163) High (0.540)GB,D Medium (0.297) Green Bay’s Effect (0.000) Small (0.105)D Medium (0.258) Big Effect (0.637)GB Immature Players (0.000) Some Veterans (0.082)D Experience (0.236)GB Young Players (0.682) Each of the two teams obtained a total score from the intensities. 62
  • 63. Illustrative Considerations in the Evaluation of 1996 Dallas - Green Bay Game For the Benefits Model: - With respect to Green Bay, Quarterback is equally to moderately more important than Dallas. Here we are comparing an aspect of the Green Bay team to their opponent, Dallas effectively, we are asking ourselves, which is more important to Green Bay’s success, the fact that they have Brett Favre, or the fact that they are playing Dallas. The judgment was made that while Favre is an outstanding quarterback, the fact that he is facing Dallas may be enough to counteract his abilities. - With respect to Dallas, the Road Ahead is strongly more important than Home Field Advantage. The Road Ahead refers to future games that the team may have to play if the team continues on. Here, the relative ease of the road ahead for Dallas, based on the record of the AFC in the Super Bowl, causes it to be less important than the fact that Dallas is playing Green Bay, possibly its biggest obstacle to winning the Super Bowl, on its home turf. - With respect to Dallas, Running Game is equally to moderately stronger than Quarterback. This judgment is based on the fact that while Dallas’ quarterback is excellent the team’s Running Game is quite often the league’s best. - With respect to Dallas, Quarterback is strongly to very strongly more important than Coaching Inspiration. The basis for this is the fact that Barry Switzer has exhibited no great gift for inspiration, the team simply is full of talent, especially in the quarterback position. 63
  • 64. For the Costs Model: - With respect to Green Bay, Mental State is strongly more important than Weather Sensitivity, simply because Green Bay’s Mental State could be more easily called into question (may not be tough enough) than their Weather Sensitivity (they are very insensitive to poor weather conditions. - With respect to Dallas, Mental State is moderately more important than Weather Sensitivity. While the team is not highly Weather Sensitive, their arrogant attitudes causes us a bit of concern that it may be their undoing. - With respect to Green Bay, Not at Full Strength is moderately more important than The Road Ahead. The basis for this being that Reggie White, a very important player on the team, is not 100%, and this is likely to have a larger impact than any AFC team that Green Bay might meet in the Super Bowl because, as we stated before, AFC teams do not traditionally pose a threat. Conversely, if we looked at an AFC matchup, the Road Ahead would in most cases have a large impact due to the fact that the AFC teams are usually unsuccessful against the NFC teams in the Super Bowl. - With respect o Green Bay, Dallas is strongly more important than Cinderella. This translates to mean that any Cinderella story that Green Bay may be enjoying is likely to be overshadowed by the fact that they are playing Dallas. While Green Bay is not widely considered to be a Cinderella, the label would have a larger effect on a team like the Indianapolis Colts when they played Kansas City. - With respect to Dallas, Not at Full Strength is strongly more important than Immature Players. While Dallas has many veterans, its biggest problem in this comparison could be injuries to key players such as Charles Haley. - With respect to Dallas, Past Failures are equally important as Play Beyond Ability. Not only is Dallas playing up to its potential, it has a few grave failures of the past to look back on. - Now that we have looked at several examples of judgments, we can move on to the results of the model. The elements in the model are given weights based on our judgment. We can rate the teams using information that we have collected. For instance, if Green Bay’s passing statistics are traditionally low against Dallas, Green Bay’s likelihood of success against Dallas is comprised by the fact that the team relies heavily on that kind of play. We determined that passing is important to Green Bay in our judgments, and find that their passing suffers against Dallas in the statistical data that we collected. Conclusion It is our hope to use this model to forecast future Super Bowl competitions. Undoubtedly, there will be additional modifications. This basic ideas learned here can be used to forecast the outcome of other competitive games. It appears that the use of intangibles is significantly more important in the forecast than the strict accuracy of the statistics, although one cannot do without the statistics which tell more about performance than about attitude and environment. 64
  • 65. Prediction of the 1997 Australian Tennis Open Two models were used to predict the matches for the top 16 ranked players in the tournament. In the first model, a feedback network modeled past performance. Here, we examined performances of players in previous tournaments. The factors and weights were then included in the second model. In the second model, a hierarchy was developed to model the intensities that will be used in the ratings module to rate the players. Past Performance from the network model in the first stage was the first criterion added. Another two criteria: Technique and Conditioning were also included. Prediction: 7 of the top 8 players were correctly predicted to meet in the final rounds of the tournament with the final between Sampras and Chang. In reality, the final was a match between Moya and Sampras, with the top seed winning the outcome. As Moya was ranked 58th in the world prior to the start of the tournament, he was not even included in the model. 65
  • 67. Hong Kong Competes with Singapore and somewhat less with Tokyo as Financial Center in Asia in the 21st Century Gang Hu (Tianjin), Chia-Shuan Huang (Taiwan), Hong Li (Beijing), Thomas Saaty (Pittsburgh), Torsten Schmidt (Germany), and Yu-Chan Wang (Taiwan). 67
  • 68. The Purpose The purpose of this project is to study the potential impact imposed through the takeover of Hong Kong by China in 1997. The analysis focuses on the following questions: • What set of criteria does an Asian location have to meet in order to be a Financial Center? • Which city is the best candidate for the Financial Center in the Asia-Pacific region in 1996? • What is the most likely policy of the Chinese government towards Hong Kong after 1997? • What impact does the Chinese policy have towards Hong Kong as a Financial Center? • Which city is the most likely candidate to be the Financial Center is the Asia-Pacific region in the year 2000? 68
  • 69. The Approach These five questions are studied with the methodology and technique provided by a combination of the AHP and ANP. A dual-model approach was developed. The first model, the “Financial Center model” which is an ANP model, was used to examine the first two of the above questions. The second model, the “Mainland China Policy model” is an AHP model, used to focus on the third question above to generate a policy package most likely to be adopted by the Chinese government. Based on changed in the political, economic, and social environments incurred by the estimated policy package, the “Financial Center model” was re-evaluated. The fourth and fifth questions above are thus answered. The two models complement one another because: 1. The Financial Center model provides the relevant factors for a focused examination under the China model in order to find the relevant factors which may be changed by the Chinese government, and 2. The China model provides a package of feasible (for mainland China) and likely policies to be adopted by the Chinese government after 1997. Based on the package of policies, a second evaluation of the Financial Center model was made in order to estimate the future status of Hong Kong as a Financial Center. 69
  • 70. Influencing Factors A).Economic-Benefits: 1. Geographic advantage. 2. Free flow of information. 3. Free flow of people. 4. Free flow of capital. 5. Internationalization. 6. Investment. 7. Educated workforce. 8. Convertible currencies. 9. Assistance from government. 11. Modern infrastructure. 12. Deregulated market. B).Political-Benefits: 1. Efficient government. 2. Independent legal system. 3. Assistance from government. 4. Free flow of people. 5. Free flow of information. C).Social-Benefits: 1. Free flow of people. 2. Free flow of information. 3. Educated workforce. 4. Open culture. 5. Internationalized language. 6. Availability of business professionals. D).Economic-Costs: 1. Labor cost. 2. Corruption. 3. Protection from government. 4. Operating cost. 5. Tax. E).Political-Costs: 1. Tax. 2. Corruption. 3. Protection from government. F).Social-Costs: 1. Environment. 2. Corruption. 3. Protection from government. G).Economic-Opportunities: 1. Investment. 2. Access to potential market. 3. Regional economic growth, membership of international organizations (GATT.WTO). H).Political- Opportunities: 1. Political credit. 2. Investment. 3. Membership of international organization (GATT,WTO). I).Social-Opportunities: 1. Social wealth. 2. Access to potential market. J).Political-Risks: 1. Political instability. 2. Instability of local government. 3. Political restriction. K).Economic-Risks: 1. Instability of local financial market. 2. Inflation. 3. Competition from local business. L).Social-Risks: 1. Industry resistance. 2. Public industry. 3. Instability of local society. 70
  • 71. The Set of Four Control Hierarchies Benefits Control Model Opportunities Control Model * Risks Control Model Costs Control Model * 71
  • 75. Results There are twelve supermatrices associated with the complete model. With each of these supermatrices is associated a cluster priority matrix, a weighted supermatrix, and a limiting supermatrix from which the priorities of the three contending centers are derived. These twelve sets of priorities are weighted by the priorities of the corresponding control criteria and summed to obtain the final ranking. 75
  • 76. The output from the first Financial Center model We assume that all the situation will remain the same after 1997. In other words, the main land China government will adopt a set of feasible policies toward Hong Kong. Based on this assumption, we made the judgments. After synthesis, we got the results below: Opportunities Benefits Economic Political Social Hong Kong 0.4131 0.5034 0.4416 Singapore 0.2836 0.1503 0.2164 Tokyo 0.3033 0.3465 0.342 Political 0.3813 0.2935 0.3252 Social 0.4511 0.2227 0.3261 Economic Political 0.3086 0.4278 0.2186 0.4387 0.4728 0.1335 Social 0.4387 0.2365 0.3248 Risks Costs Hong Kong Singapore Tokyo Hong Kong Singapore Tokyo Economic 0.4096 0.2874 0.303 Economic Political 0.2393 0.1922 0.2804 0.3625 0.4803 0.4453 Social 0.2519 0.1803 0.5678 Hong Kong Singapore Tokyo The overall result is listed below: Alternatives Hong Kong Singapore Tokyo Rank (B*O)/(C*R) 1 1.6498 2 0.906 3 0.5338 It is clear that Hong Kong has the highest priority, which means if mainland China government adopt all the policies described above toward Hong Kong, it will remain to be the financial center in the Asia-Pacific region. 76
  • 77. Likely Policies Followed by China Affecting the Future of Hong Kong About 50 potential Chinese policies were identified and ranked in a hierarchy. The most likely policies were identified and the network sub-models were re-assessed given this information. The hierarchy and the policies are shown next. 77
  • 78. Sample Hierarchy for Assessing Benefit Intensities 78
  • 80. The output from the Chinese policies model We picked 18 different factors (in the Financial Center model) which are highly dependent on the policies of the mainland China government. For each of the factors, we divided it into three situations(positive +, mutual 0, negative -), which denote the different Chinese policies toward it. And then, we put them into the China government model(absolute hierarchy model, including four sub-model: benefits, costs, opportunities and risks). After synthesis, we got the overall score for each policy. Based on the scores, we draw the optimal and most likely policies package(it is shown below). 1 2 3 4 5 6 7 8 9 10 11 12 13 14 15 16 17 18 Optimal and most likely policies free flow of information 0 free flow of people 0 educated workforce + convertible currency + deregulated market 0 assistance from government + inflation + independent legal system 0 political restrcitions 0 instability of local society + availability of business professionals + public insecurity + corruption + tax + protectionist barrier 0 investment + political credit + access to potential market + 80
  • 81. The output from the second Financial Center model Based on the optimal and most likely policies package we got, we made another set of judgments for the Financial Center model. This is, with the assumptions we have made, an estimation of the location of the financial center in the Asian-Pacific region. The results are listed below: Benefits Hong Kong Singapore Tokyo Opportunities Economic Political 0.3814 0.4435 0.2992 0.2187 0.3194 0.3378 Social 0.4238 0.2306 0.3456 Costs Hong Kong Singapore Tokyo Hong Kong Singapore Tokyo Economic Political 0.4096 0.3813 0.2874 0.2935 0.303 0.3252 Social 0.4511 0.2227 0.3261 Economic Political 0.4278 0.4278 0.4387 0.4387 0.1335 0.1335 Social 0.4387 0.2365 0.3248 Risks Economic Political 0.2966 0.2814 0.2561 0.3161 0.4475 0.4025 The overall result is as below Social 0.3045 0.1657 0.5298 Alternatives Hong Kong Singapore Tokyo Hong Kong Singapore Tokyo Rank (B*O)/(C*R) 1 1.1822 2 1.1093 3 0.5949 We can see that Hong Kong can still maintain the financial center status after 1997, but the gap between Hong Kong and other cities is much smaller. Especially, Singapore becomes very competitive. 81
  • 82. Original Economic Benefits Sub-Model Supermatrix (Truncated to save space) Economic Benefits Local: Sing Toky Hong assi free conv mode good dere Singapore 0 0 0 0.3196 0.1692 0.1396 0.1692 0.3333 0.2081 Tokyo 0 0 0 0.122 0.4434 0.5278 0.4434 0.3333 0.1311 Hong Kong 0 0 0 0.5584 0.3874 0.3325 0.3874 0.3333 0.6608 0.0538 0.0459 0.0501 0 0 0 0 0 0.044 0.0526 0.0369 0 0 0 0 0 convertible currency 0.0379 0.0796 0.0625 0 0 0 0 0 modern infrastructure 0.0843 0.189 0.0925 0 0 0 0 0 good auditing systems 0.105 0.0801 0.0619 0 0 0 0 0 deregulated market 0.0367 0.0296 0.1166 0 0 0 0 0 geographic advantages 0.1713 0.1599 0.1593 0 0 0 0 0 free flow of information 0.0168 0.0837 0.0594 0 0 0 0 0 free flow of capital 0.1389 0.0917 0.0928 0 0 0 0 0 educated workforce 0.0602 0.0996 0.0537 0 0 0 0 0 internationalized language 0.0961 0.0283 0.0555 0 0 0 0 0 investment from outside 0.1551 0.06 0.1588 0 0 0 0 0 assistance from government free flow of people 82
  • 83. Weighted Economic Benefits Sub-Model Supermatrix (Truncated to save space) Economic Benefits Weighted: Sing Toky Hong assi free conv mode good dere Singapore 0 0 0 0.3196 0.1692 0.1396 0.1692 0.3333 0.2081 Tokyo 0 0 0 0.122 0.4434 0.5279 0.4434 0.3333 0.1311 Hong Kong 0 0 0 0.5584 0.3874 0.3325 0.3874 0.3333 0.6608 0.0538 0.0459 0.0501 0 0 0 0 0 0.044 0.0526 0.0369 0 0 0 0 0 convertible currency 0.0379 0.0796 0.0625 0 0 0 0 0 modern infrastructure 0.0843 0.189 0.0925 0 0 0 0 0 good auditing systems 0.105 0.0801 0.0619 0 0 0 0 0 deregulated market 0.0367 0.0296 0.1166 0 0 0 0 0 geographic advantages 0.1713 0.1599 0.1593 0 0 0 0 0 free flow of information 0.0168 0.0837 0.0594 0 0 0 0 0 free flow of capital 0.1389 0.0917 0.0928 0 0 0 0 0 educated workforce 0.0602 0.0996 0.0537 0 0 0 0 0 internationalized language 0.0961 0.0283 0.0555 0 0 0 0 0 investment from outside 0.1551 0.06 0.1588 0 0 0 0 0 assistance from government free flow of people 83
  • 84. Limiting Economic Benefits Sub-Model Supermatrix (Truncated to save space) Economic Benefits Synthesized: Global Sing Toky Hong assi free conv mode good dere Singapore 0.2836 0.2836 0.2836 0.2836 0.2836 0.2836 0.2836 0.2836 0.2836 Tokyo 0.3033 0.3033 0.3033 0.3033 0.3033 0.3033 0.3033 0.3033 0.3033 Hong Kong 0.4131 0.4131 0.4131 0.4131 0.4131 0.4131 0.4131 0.4131 0.4131 assistance from government 0.0499 0.0499 0.0499 0.0499 0.0499 0.0499 0.0499 0.0499 0.0499 free flow of people 0.0437 0.0437 0.0437 0.0437 0.0437 0.0437 0.0437 0.0437 0.0437 convertible currency 0.0607 0.0607 0.0607 0.0607 0.0607 0.0607 0.0607 0.0607 0.0607 modern infrastructure 0.1194 0.1194 0.1194 0.1194 0.1194 0.1194 0.1194 0.1194 0.1194 good auditing systems 0.0796 0.0796 0.0796 0.0796 0.0796 0.0796 0.0796 0.0796 0.0796 deregulated market 0.0676 0.0676 0.0676 0.0676 0.0676 0.0676 0.0676 0.0676 0.0676 geographic advantages 0.1629 0.1629 0.1629 0.1629 0.1629 0.1629 0.1629 0.1629 0.1629 free flow of information 0.0547 0.0547 0.0547 0.0547 0.0547 0.0547 0.0547 0.0547 0.0547 free flow of capital 0.1055 0.1055 0.1055 0.1055 0.1055 0.1055 0.1055 0.1055 0.1055 educated workforce 0.0695 0.0695 0.0695 0.0695 0.0695 0.0695 0.0695 0.0695 0.0695 internationalized language 0.0588 0.0588 0.0588 0.0588 0.0588 0.0588 0.0588 0.0588 0.0588 investment from outside 0.1278 0.1278 0.1278 0.1278 0.1278 0.1278 0.1278 0.1278 0.1278 84
  • 85. Normalized by Cluster - Results from Limiting Economic Benefits Sub-Model Supermatrix Economic Benefits Synthesized Local: Singapore 0.2836 Tokyo 0.3033 Hong Kong 0.4131 assistance from government 0.0499 free flow of people 0.0437 convertible currency 0.0607 modern infrastructure 0.1194 good auditing systems 0.0796 deregulated market 0.0675 geographic advantages 0.1629 free flow of information 0.0547 free flow of capital 0.1055 educated workforce 0.0695 internationalized language 0.0588 investment from outside 0.1278 85
  • 86. The Result • The first result from the Financial Center model: •If the Chinese government is able to maintain the current status of Hong Kong, Hong Kong would still be the Financial Center is the Asia-Pacific region in 2000. • The first result from the Mainland China Policy model: •For interests of the mainland Chinese government, no negative policy should be adopted towards Hong Kong after 1997. A careful and sensitive approach towards the future Hong Kong policy is suggested by this result, which is also reinforced by the next result. • The second result from the Financial Center model: •Although Hong Kong may still be the best choice for a Financial Center, Singapore will become a strong competitor for the Center in 2000. 86
  • 87. Conclusions 1) Based on the first output of our Financial Center model, we can see that if all conditions remain the same, in other words, if China adopts all the positive policies toward Hong Kong, in other words if the Chinese government is able to maintain or even improve the current status of Hong Kong, it is quite sure that Hong Kong will remain one of the important financial centers in the Asia-Pacific region. 2) Among the influencing factors of the financial center status, many of them are dependent directly on the government’s policies. Therefore, Hong Kong’s future as a financial center is highly dependent on the political attitude of the Chinese government. 3) Based on the result of our mainland China policy model, we found, among the 18 factors, the Chinese government should adopt positive policies on 12 of them, and mixed policies on 6 of them. In other words, for the interests of China itself (not Hong Kong), China should avoid implementing negative policies, as defined in this study towards Hong Kong as a financial center. 4) Based on the second output of the Financial Center model, Hong Kong will maintain its financial status after 1997. But at the same time, Singapore will become very competitive. Therefore, our conclusion is that if Chinese government adopts rational policies toward Hong Kong as estimated in this study, Hong Kong will remain the number one financial center of the Asian-Pacific region. But at the same time, the position of Hong Kong as a financial center will be weakened. If any negative policies are implemented, Singapore will become the number one financial center of this Asia-Pacific region followed by Hong Kong. 87
  • 88. Feedback Measurement as the Limiting Power of the Supermatrix The eigenvectors of the paired comparison matrices are each part of a column of the supermatrix. The supermatrix may not be column stochastic. Its column blocks would be weighted by the priorities of the clusters to render the matrix stochastic. The supermatrix must now be raised to powers to capture all the interactions and feedback among its elements. What is desired is its limiting power limW k k  The power of a matrix is function of that matrix. Entire functions (series expansion converges for all values) of a matrix can be represented by the formula: II(λjI-W) Wk = n  i=1 λ k i j≠i II(λj-λi) j≠i if the eigenvalues are distinct, or if they are not then by: m W = k  i=1 1 d mi-1 (mi-1)! d λmi-1 One is the largest eigenvalue of a stochastic matrix. This follows from λ max  max i λki (λI-W)-1 n II (λ- λi) i=1 n II (λ- λi) i=mi+1 λ = λi n a j=1 ij and the sum on the right is equal to the one for a column stochastic matrix. It is obvious that the moduli of the remaining eigenvalues of a stochastic matrix are less than or equal to one. One is a simple eigenvalue if the matrix is positive. It can be a multiple eigenvalue or there may be other eigenvalues whose moduli are equal to one if there is a sufficient number of zeros in the matrix so that it is reducible. When the supermatrix has some zero entries, it may be that some power of it is positive and hence the matrix remains positive for still larger powers and is called primitive. One is a simple eigenvalue of a primitive matrix. One may be a simple eigenvalue whether the matrix is primitive or not or a multiple eigenvalue yet there may not be other eigenvalues whose moduli is equal to one. The powers take on a certain form in the limit for each of these three cases. On the other hand if there are other such roots whose module is one, the powers of the supermatrix would cycle with a period of cyclicity and the limit is given by the same expression in all three cases namely when the supermatrix is imprimitive or when one is a simple or a multiple eigenvalue. 88
  • 89. Irreducible Stochastic ( λ = 1 is a simple root) W∞ = No other roots with modulus equal to one (primitive) Case A Primitive if trace is positive. Raise W to powers. All columns the same and any column can also be obtained as the solution of the eigenvalue problem Ww = w. Other roots with modulus equal to one (imprimitive with cyclicity c). Case A′ 1 ( I − W c )( I − W ) −1 (W c ) ∞ c 89 c≥ 2
  • 90. Reducible Stochastic W∞ = No other roots with modulus equal to one Case B λ =1 Simple −1 ( I −W ) ∆ (1) = Adjo int( I − W ) normalized ∆ ′(1) ∆ ′(1) Case C λ =1 multiple n1 n1 ∑ ( − 1) k k=0 n1! ∆( n1 − k ) (λ ) (λ I − W ) − k −1 |λ =1 ( n1 ) (n1 − k ) ∆ (λ ) Other roots with modulus equal to one (cyclic with cyclicity c). Case B′ 1 ( I − W c )( I − W ) −1 (W c ) ∞ c c≥ 2 Case C′ 1 ( I − W c )( I − W ) −1 (W c ) ∞ c c≥ 2 The desired outcome for Case C can often be obtained by introducing loops at all sinks and raising the matrix to limiting powers. 90
  • 91. Computationally, the foregoing classification may be simplified along the following lines. Define λ 1. We have: Proper | λi | < 1 i > 1 λ 1 = 1 simple root A primitive stochastic matrix is proper (1) Fully Regular The index k=1 in the diagonal primitive block matrices of the normal form λ max = Improper | λ i | ≤ 1 (for several i) Roots of unity of cyclicity c. (2) 1 ( I − W c )( I − W ) −1 (W c ) ∞ c ( I − W ) −1 ∆ (1) Adjo int( I − W ) = ∆ ′(1) ∆ ′(1) Normalize the columns of the adjoint to get W∞ . When W is primitive one can simply raise W to very large powers on a personal computer. (3) λ 1 = 1 multiple root If and only if matrices A1,…, Ak in upper part of of multiplicity n1 diagonal of normal form are primitive n1 n1 ∑ (− 1) k k=0 (4) 1 ( I − W c )( I − W ) −1 (W c ) ∞ c n1! ∆( n1 − k ) (λ ) (λ I − W ) − k −1 |λ =1 ( n1 − k )! ∆( n1 ) (λ ) A simple practical rule for obtaining a limiting matrix for a given n by n nonnegative and stochastic supermatrix W is first to test it for irreducibility with the condition (I+W)n-1 > 0. If it is irreducible, then λ max = 1 is simple and one of the two formulas applies. It is then tested for cyclicity and the answer is obtained using the above. When alternatives do not feed back into the criteria, it is best not to include them in the supermatrix. The reason is that if the supermatrix cycles, then the average value would first have to be calculated. The average weights of the criteria are then used to weight the alternatives in a separate hierarchy. 91
  • 92. ANP PROJECTS 1996 United States Presidential Election A Day at the Races: Predicting a Harness Race at the Meadows: An Application of the ANP A Prediction of Opportunities for Job Growth by U.S. Region Alternative Fuels for Automobiles An ANP Approach for Commodity Markets Demand/Supply Ratio Model Analysis of the Market for 32-Bit Operating Systems Bridge Management Decision Choosing the Best Location for Permanent Storage of High-Level Nuclear Waste Commodity Markets Convocation Center Corporate Market Value in the Computer Industry Corporate Restructuring at Chrysler Corporate Strategies for Competitors Crime and Punishment Disney America: Should Disney Build a Theme Park? Given $10 Million, What Would be the Best Allocation to Each of the Proposed Programs that Contribute to Decreasing Gang Activity? Health Insurance Systems How to Implement Flex Time Justify the Existence of the Economic Black Market Lake Levels and Flow Releases Management Consulting Model Market Share Predictions for Aqueous Intra-Nasal Steroids Medical Center: Strategic Planning with the ANP Mergers and Acquisitions Mode of Transportation to School Modeling a Reservoir Operations for Managing of Ecological Interests Multi-Objective Decision Making Analysis with Engineering and Business Applications 92
  • 93. ANP REFERENCES cont’d NBA Playoffs for 1991 Net Dollar Value for IBM, Apple, Intel and Microsoft Network Analysis of Illegal Drug Marketing in the United States Planning Strategies for Incubator Space using the ANP Predicting the Outcome of Legislative Debate over Superfund Reauthorization Predicting the Winner of the 1995-1996 NHL Stanley Cup Predicting the Winner of the 1996 Chase Championship with the ANP Prediction of 1997 Australian Tennis Open Prediction of the 1997 Wimbledon Tennis Championships Prediction of the CPU Market Prioritizing Flow Alternatives for Social Objectives Ranking Countries in Telecommunications as a Subset of Locating a Business Problem Stadium Placement and Optimal Funding Strategic Staffing – Extra Care Providers Strategies for Improvement at the Joseph M. Katz Graduate School of Business Teenage Pregnancy Telecommunications Network Design and Performance The Decision to Market Nimbex (new drug) vs. Continuing to Market Tracruim (old drug) The Emerging Information Technologies of the Future: The “Prize” of Firms and Industries The Future of East Central Europe The Future of Major League Baseball in Pittsburgh: Strategic Planning with the ANP The Future of the University of Pittsburgh’s Medical Center The Middle East The Optimal MBA Program Structure The Teenage Smoking Problem Transportation to Work Understanding the Tiananmen Massacre in China What will be the worth? (Predicting Average Starting Salaries for MBA Graduates) Where to Invest in Capital Markets 93