Recommended

Recommended
More Related Content
What's hot
What's hot (16)
Viewers also liked
Viewers also liked (15)
Similar to Shorter Multi-marker Signatures: a new tool to facilitate cancer diagnosis
Similar to Shorter Multi-marker Signatures: a new tool to facilitate cancer diagnosis (20)
Recently uploaded
Recently uploaded (20)
Shorter Multi-marker Signatures: a new tool to facilitate cancer diagnosis
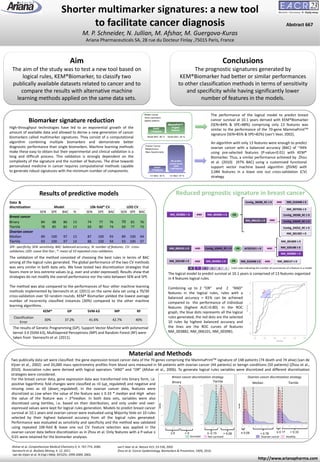
- 1. Shorter multimarker signatures: a new tool to facilitate cancer diagnosis M. P. Schneider, N. Jullian, M. Afshar, M. Guergova-Kuras Ariana Pharmaceuticals SA, 28 rue du Docteur Finlay ,75015 Paris, France Reduced prognostic signature in breast cancer Aim The aim of the study was to test a new tool based on logical rules, KEM®Biomarker, to classify two publically available datasets related to cancer and to compare the results with alternative machine learning methods applied on the same data sets. Abstract 667 Conclusions The prognostic signatures generated by KEM®Biomarker had better or similar performances to other classification methods in terms of sensitivity and specificity while having significantly lower number of features in the models. Results of predictive models Biomarker signature reduction High-throughput technologies have led to an exponential growth of the amount of available data and allowed to derive a new generation of cancer biomarkers called multimarker signatures. They consist of a computational algorithm combining multiple biomarkers and demonstrate better diagnostic performance than single biomarkers. Machine learning methods make these easy to obtain but their experimental and clinical validation is a long and difficult process. This validation is strongly dependent on the complexity of the signature and the number of features. The drive towards personalized medicine in cancer requires computational methods capable to generate robust signatures with the minimum number of components. The performance of the logical model to predict breast cancer survival at 10.1 years derived with KEM®Biomarker (SEN=84% & SPE=88%) comprising only 13 features was similar to the performance of the 70-gene MammaPrintTM signature (SEN=85% & SPE=82%) (van’t Veer, 2002). An algorithm with only 13 features were enough to predict ovarian cancer with a balanced accuracy (BAC) of ~94% using pre-selected features (P-value<0.01) with KEM® Biomarker. Thus, a similar performance achieved by Zhou et al. (2010) (97% BAC) using a customized functional support vector machine based algorithm (fSVM) with 2,084 features in a leave one out cross-validation (CV) strategy. The logical model to predict survival at 10.1 years is comprised of 13 features organized in 4 features logical rules. Combining up to 2 “OR” and 2 “AND” features in the logical rules, rules with a balanced accuracy > 81% can be achieved compared to the performance of individual features (highest AUC=0.80). In the ROC graph, the blue dots represents all the logical rules generated, the red dots are the selected 10 rules by highest balanced accuracy and the lines are the ROC curves of features NM_003882, NM_006101, NM_003981. Data & discretization Model 10k-fold* CV LOO CV SEN SPE BAC N SEN SPE BAC SEN SPE BAC Breast cancer Binary 84 88 86 13 74 77 76 70 81 76 Tiertile 78 85 82 13 69 80 74 69 77 73 Ovarian cancer Median 89 100 97 13 87 100 93 89 100 94 Tiertile 93 100 97 14 88 100 94 93 100 97 SPE: specificity; SEN: sensitivity; BAC: balanced accuracy; N: number of features; CV: cross- validation; LOO: Leave One Out ; *: mean of 10 repeated cross validation. Material and Methods Two publically data set were classified: the gene expression breast cancer data of the 70 genes comprising the MammaPrintTM signature of 148 patients (74 death and 74 alive) (van de Vijver et al., 2002) and 20,000 mass spectrometry profiles from blood sera measured in 94 patients with ovarian cancer (44 patients) or benign conditions (50 patients) (Zhou et al., 2010). Association rules were derived with logical operators “AND” and “OR” (Afshar et al., 2006). To generate logical rules variables were discretized and different discretization strategies were considered. http://www.arianapharma.com/ Breast cancer discretization strategy Ovarian cancer discretization strategy For the breast cancer data, gene expression data was transformed into binary form, i.e. positive logarithmic fold changes were classified as >0 (up_regulated) and negative and missing ones as ≤0 (down_regulated). In the ovarian cancer data, features were discretized as Low when the value of the feature was ≤ 0.33 * median and High when the value of the feature was > 3*median. In both data sets, variables were also discretized using tiertiles, i.e. based on their distribution, and only under and over- expressed values were kept for logical rules generation. Models to predict breast cancer survival at 10.1 years and ovarian cancer were evaluated using Majority Vote on 10 rules selected by their highest balanced accuracy from all the logical rules generated. Performance was evaluated as sensitivity and specificity and the method was validated using repeated 10K-fold & leave one out CV. Feature selection was applied in the ovarian cancer data before discretization as in Zhou et al. Only features with a P-value ≤ 0.01 were retained for the biomarker analyses. Color scale indicating the number of occurrences of a feature in a model The validation of the method consisted of choosing the best rules in terms of BAC among all the logical rules generated. The global performance of the two CV methods was very similar in both data sets. We have tested two discretization strategies that favors more or less extreme values (e.g. over and under expressed). Results show that strategies do not modify the overall performance nor the ratio between SEN and SPE. The method was also compared to the performances of four other machine learning methods implemented by Vanneschi et al. (2011) on the same data set using a 70/30 cross-validation over 50 random rounds. KEM® Biomarker yielded the lowest average number of incorrectly classified instances (30%) compared to the other machine learning algorithms. KEM® GP SVM-k3 MP RF Classification Error 30% 37.2% 41.6% 42.7% 40% NM_003882 > 0 AND NM_003981 ≤ 0 NM_006101 ≤ 0 NM_007036 ≤ 0 Contig_38288_RC ≤ 0 Contig_63649_RC ≤ 0 Contig_24252_RC ≤ 0 NM_001282 > 0 Contig_38288_RC ≤ 0 NM_016448 ≤ 0 NM_006101 ≤ 0 Contig_63649_RC ≤ 0 AF201951 > 0 NM_001809 ≤ 0 NM_020188 ≤ 0 NM_003882 > 0 NM_020188 ≤ 0 NM_003981 ≤ 0 NM_000127 ≤ 0NM_016448 ≤ 0 OR 8 7 4 3 2 1 AND AND ANDOR AND OR AND Afshar et al. Comprehensive Medical Chemistry II, 4: 767-774, 2006. Vanneschi et al. BioData Mining, 4: 12, 2011 van de Vijver et al. N Engl J Med, 347(25): 1999-2009, 2002. The results of Genetic Programming (GP), Support Vector Machine with polynomial kernel 3.0 (SVM-k3), Multilayered Perceptrons (MP) and Random Forest (RF) were taken from Vanneschi et al. (2011). Survived Not survived ≤ 0 > 0 Binary ≤ -0.15 > 0.08 Tiertile TiertileMedian > 0.78≤ 0.09 Ovarian cancer Healthy > 0.33≤ 0.17 van’t Veer et al. Nature 415: 53-536, 2002 Zhou et al. Cancer Epidemiology, Biomarkers & Prevention, 19(9), 2010. Model BAC: 86 % Model BAC: 84 % CV BAC: 94 % CV BAC: 97 % AND Breast Cancer Gene expression Agilent platform Ovarian Cancer Metabolomics Mass Spectrometry