SlideShare a Scribd company logo
1 of 10
Download to read offline
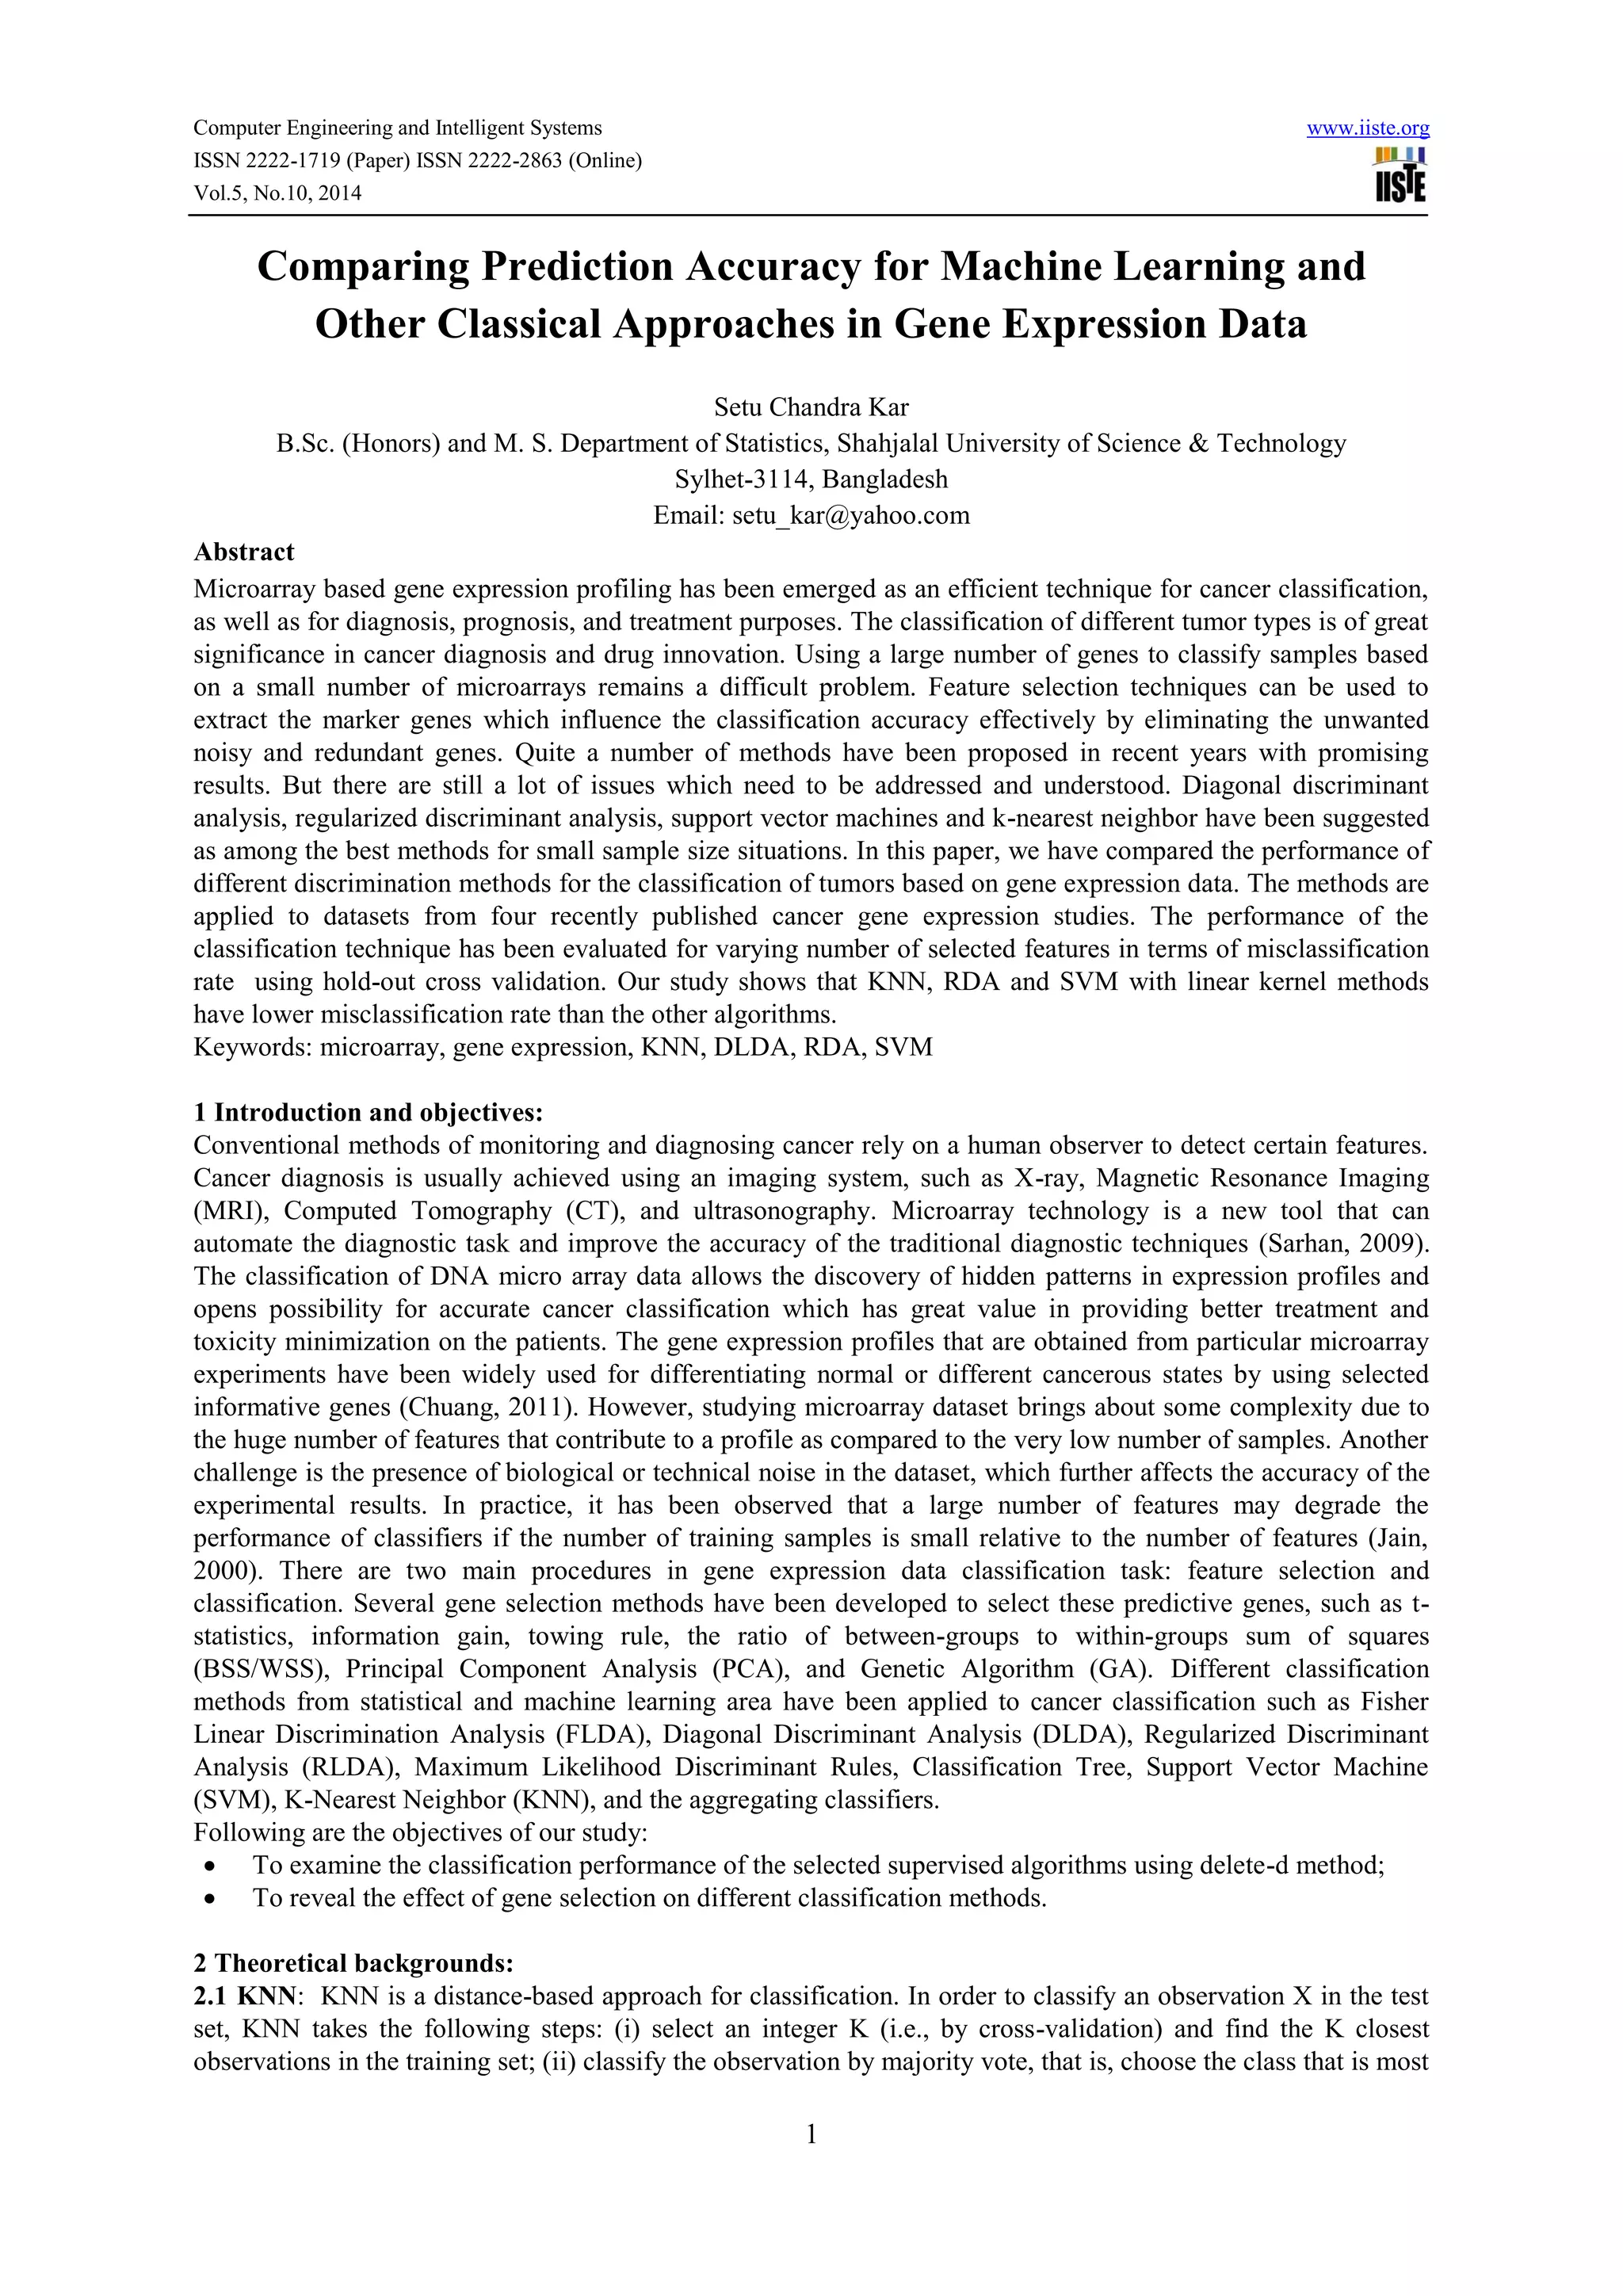
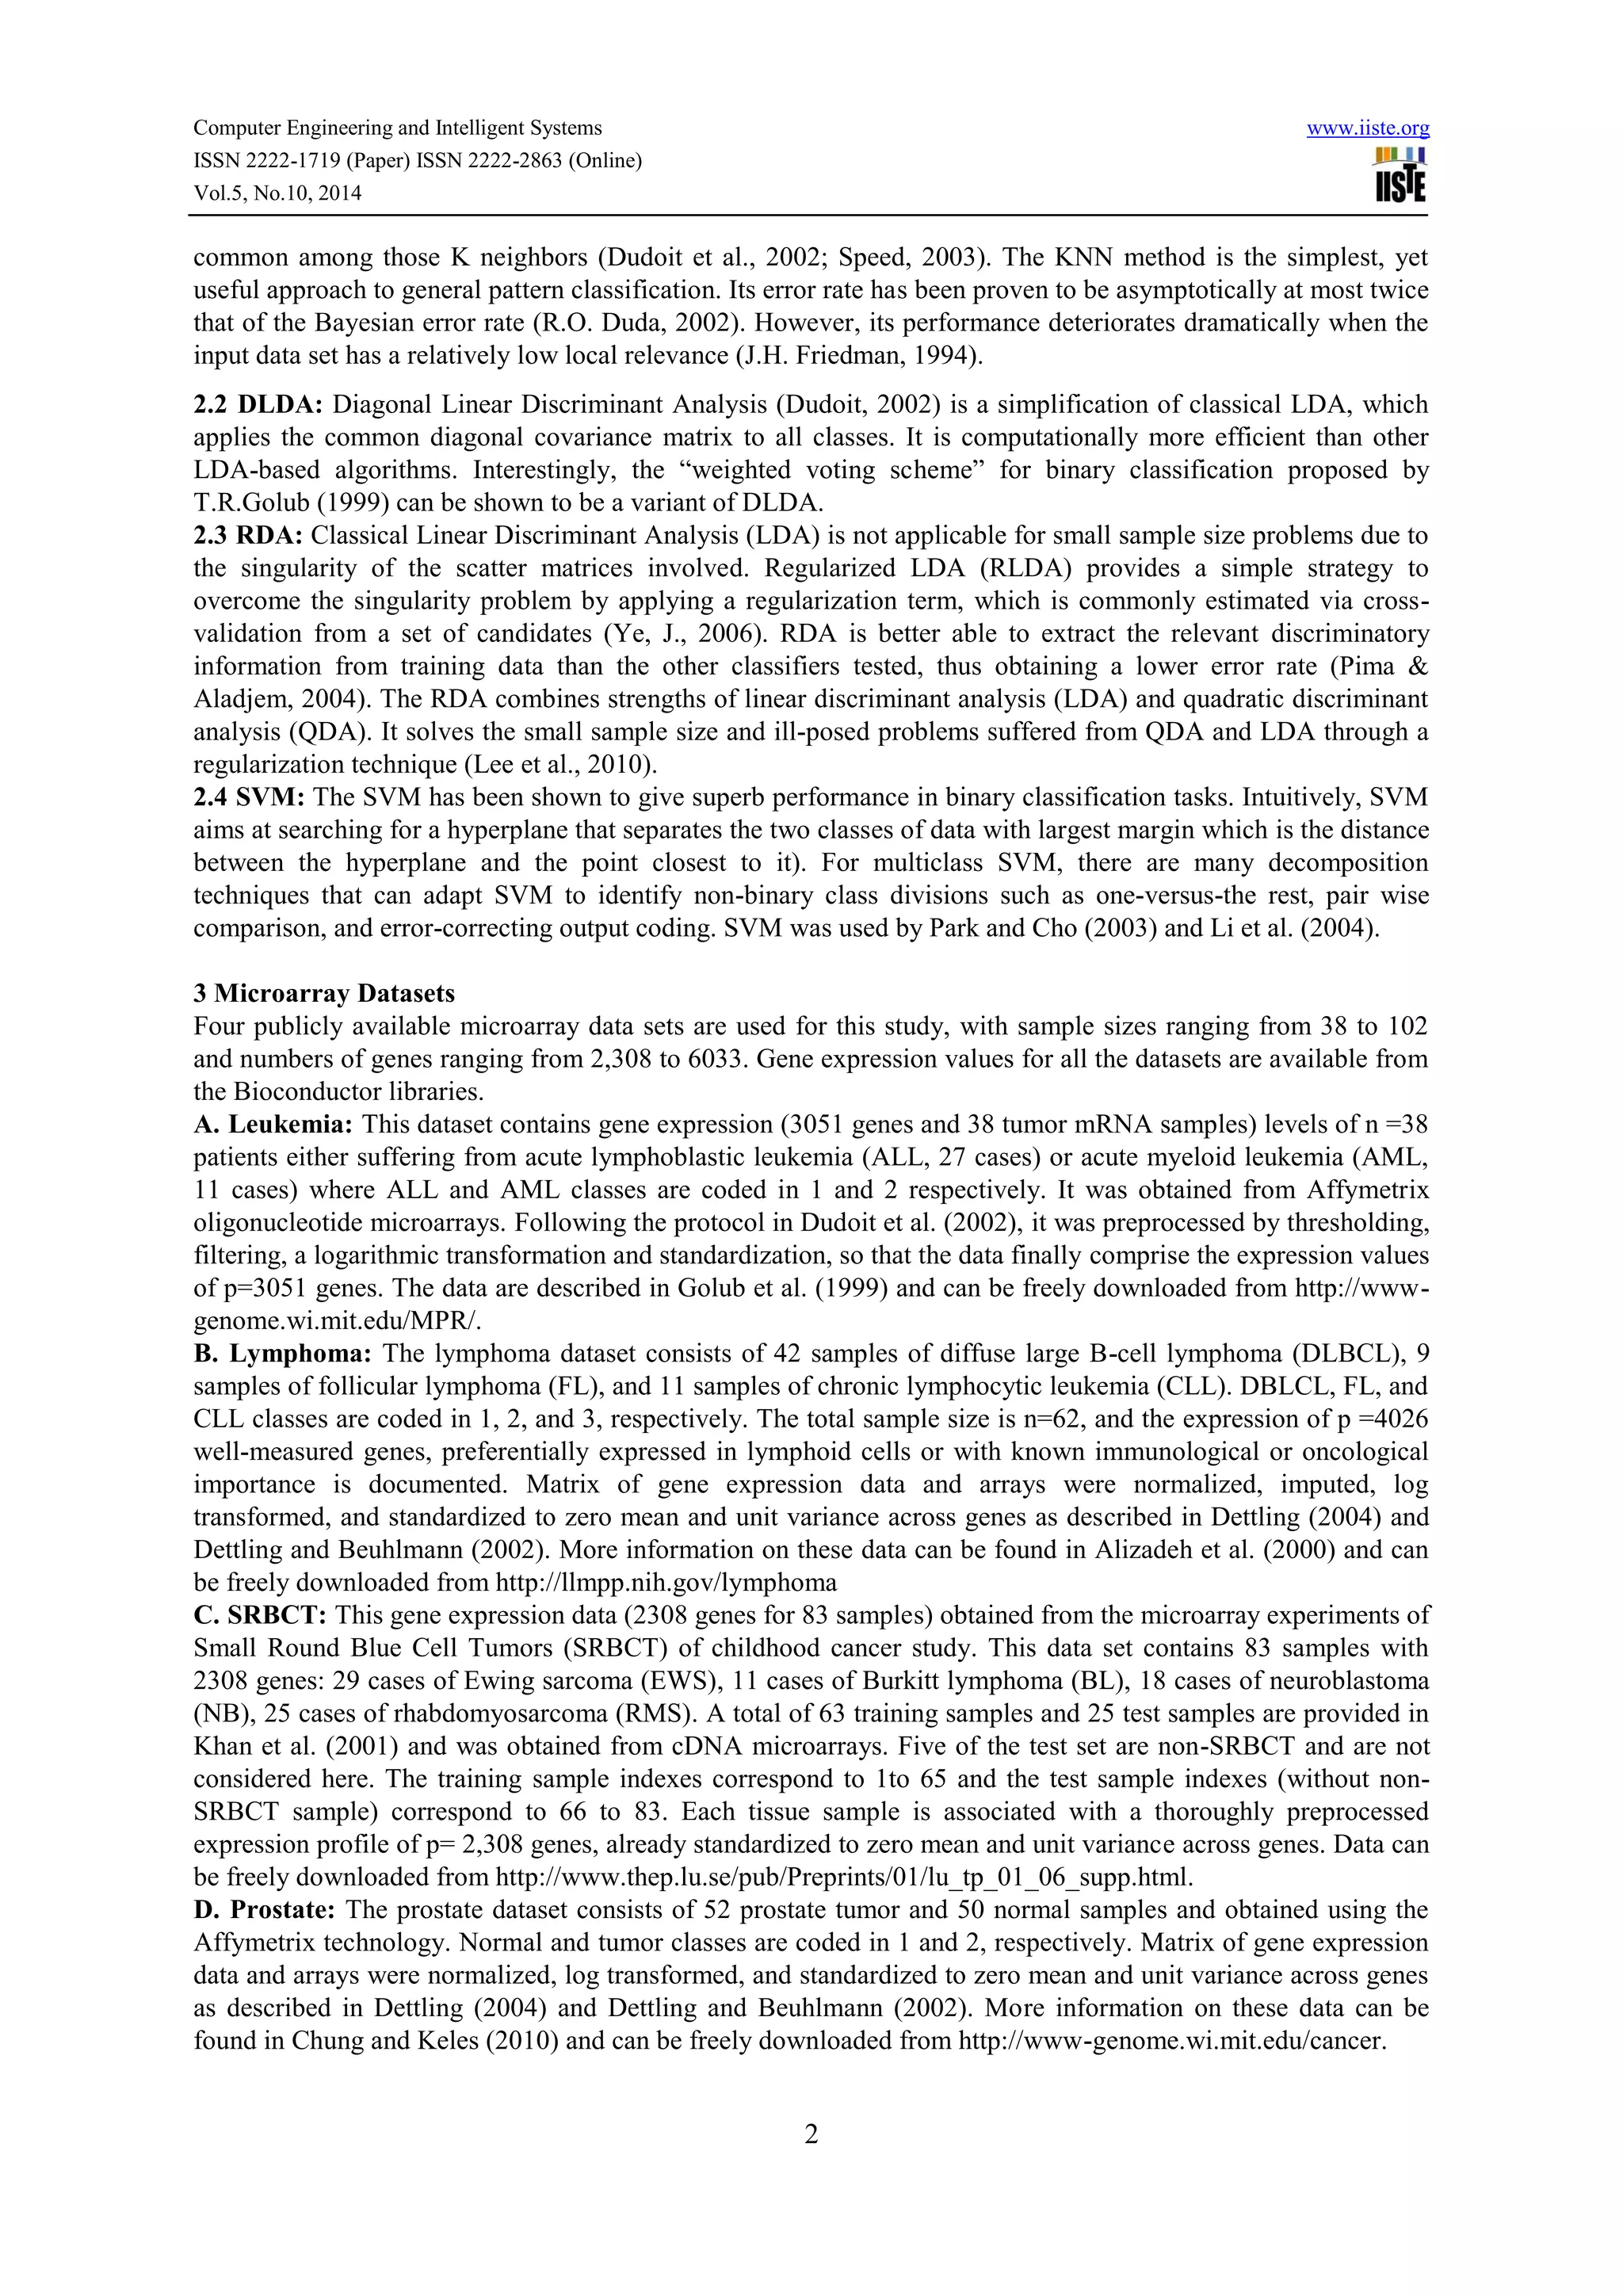
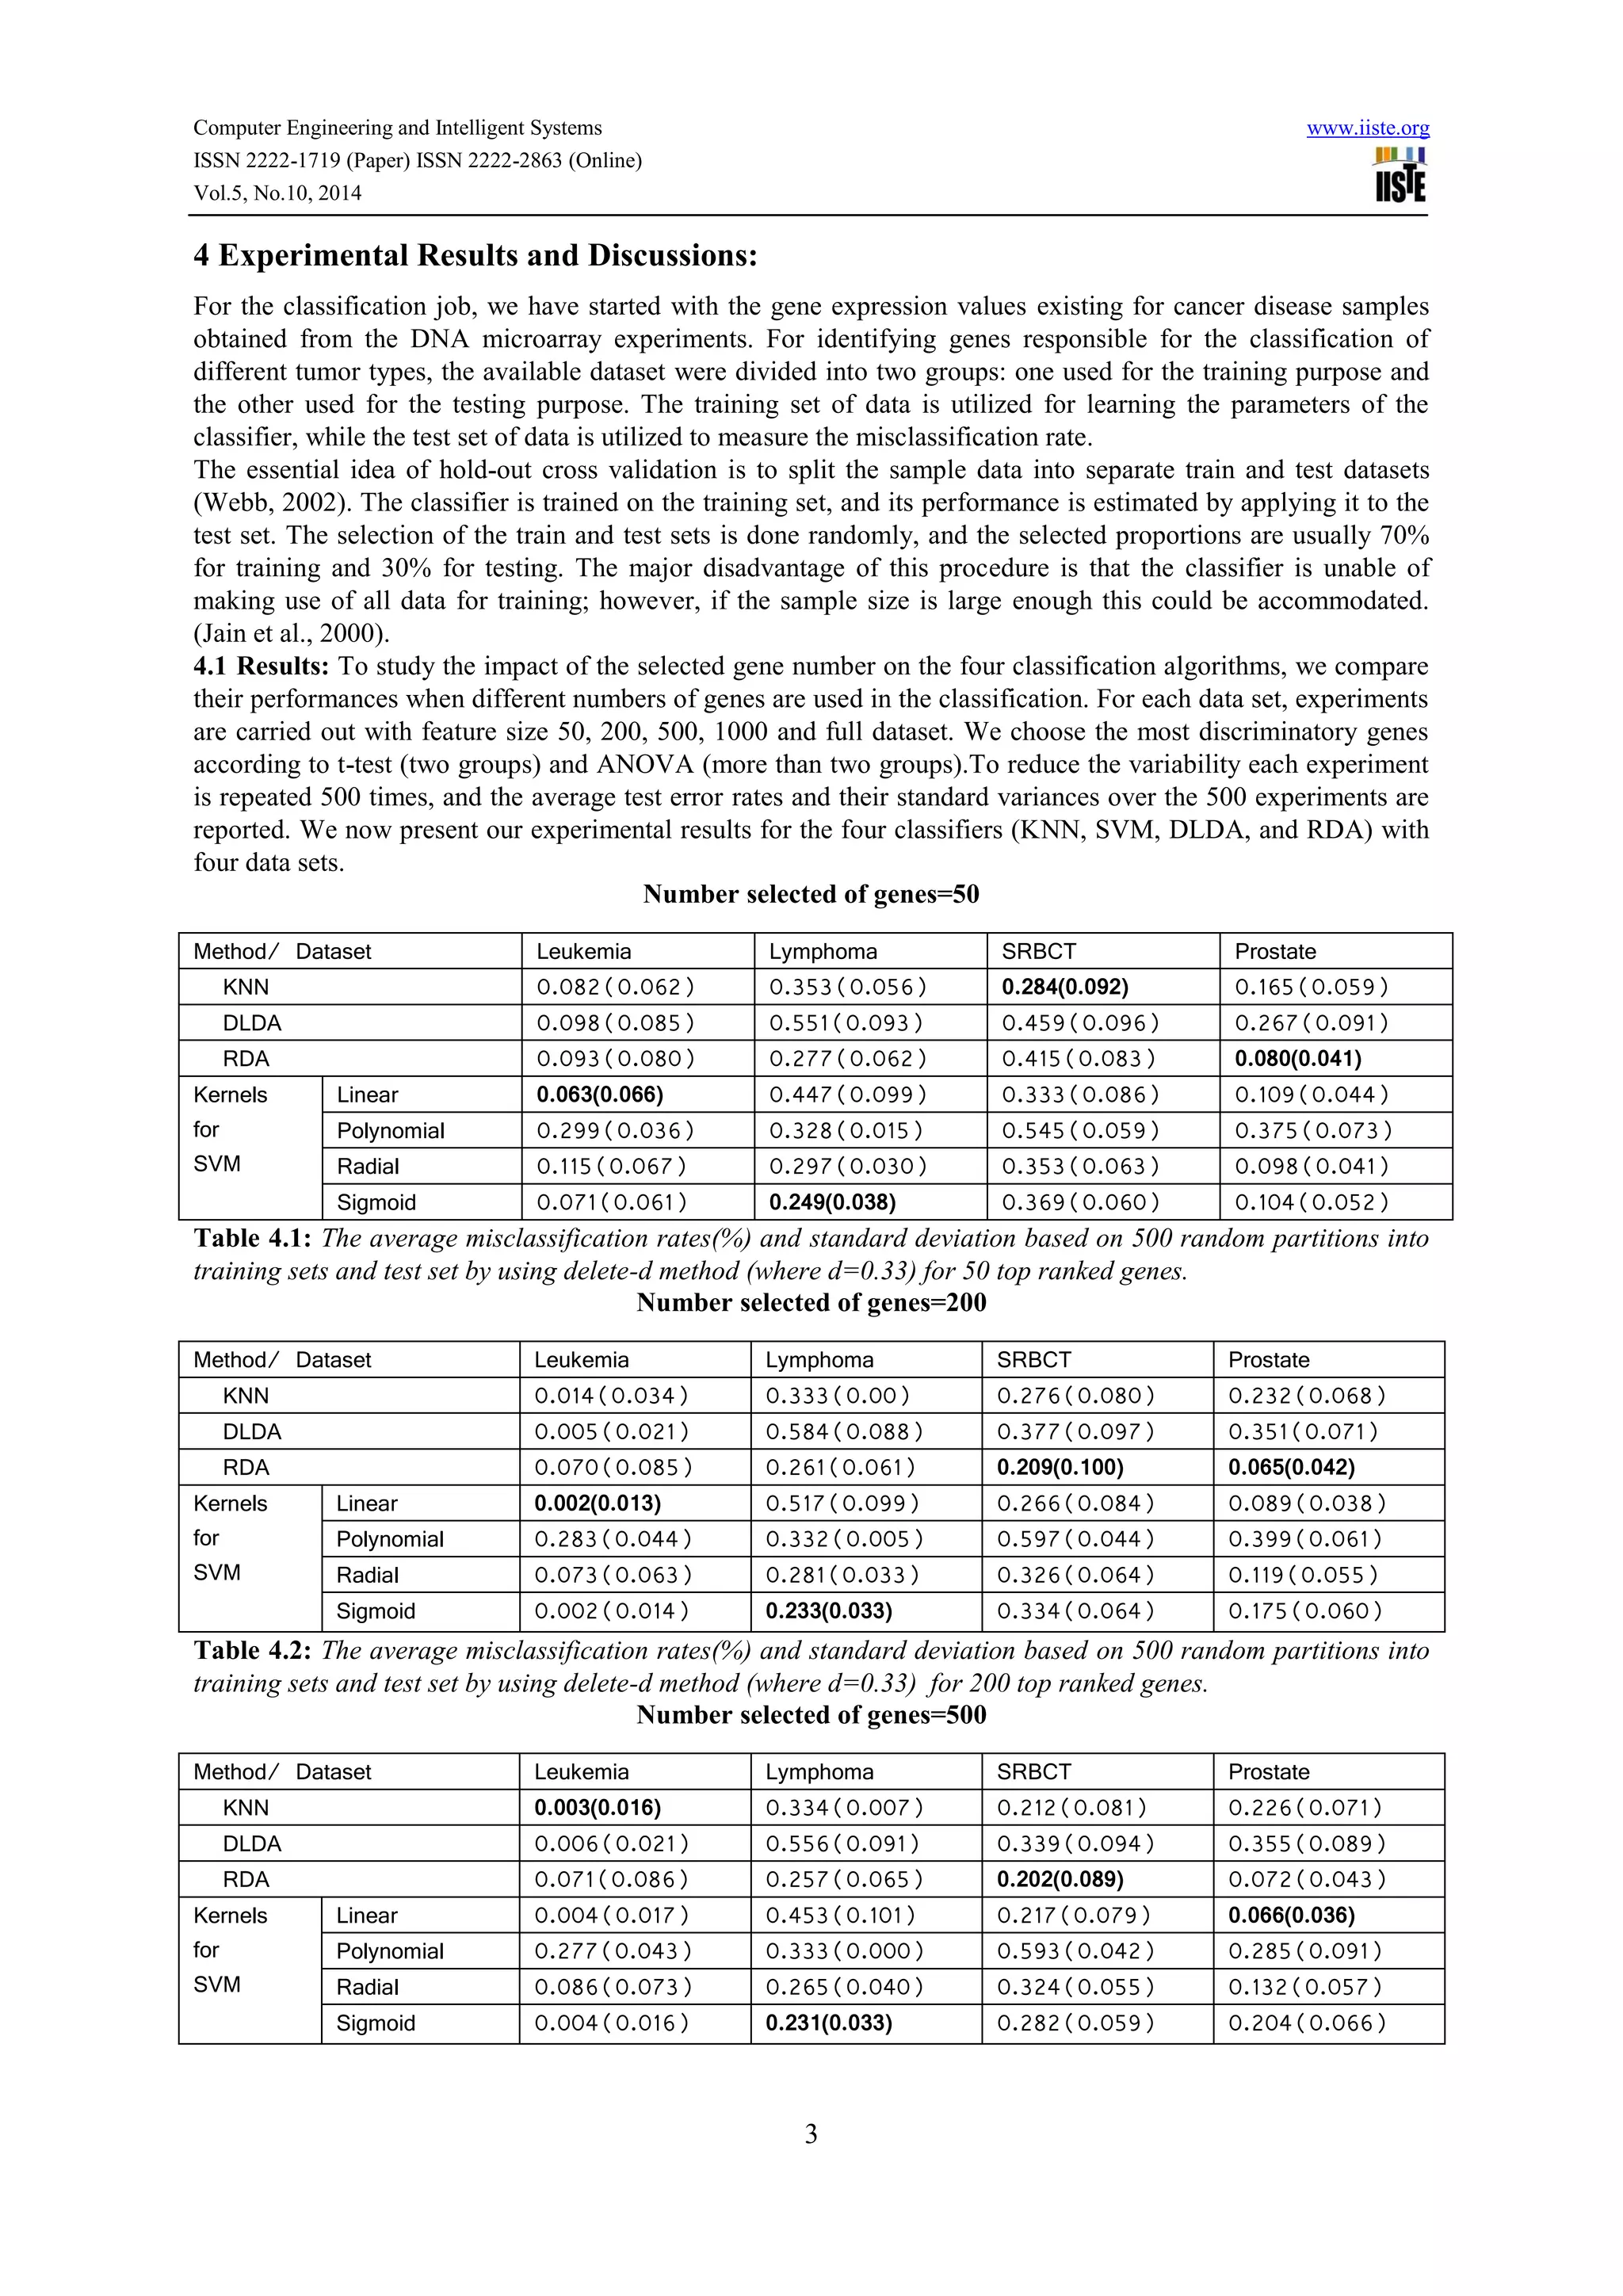
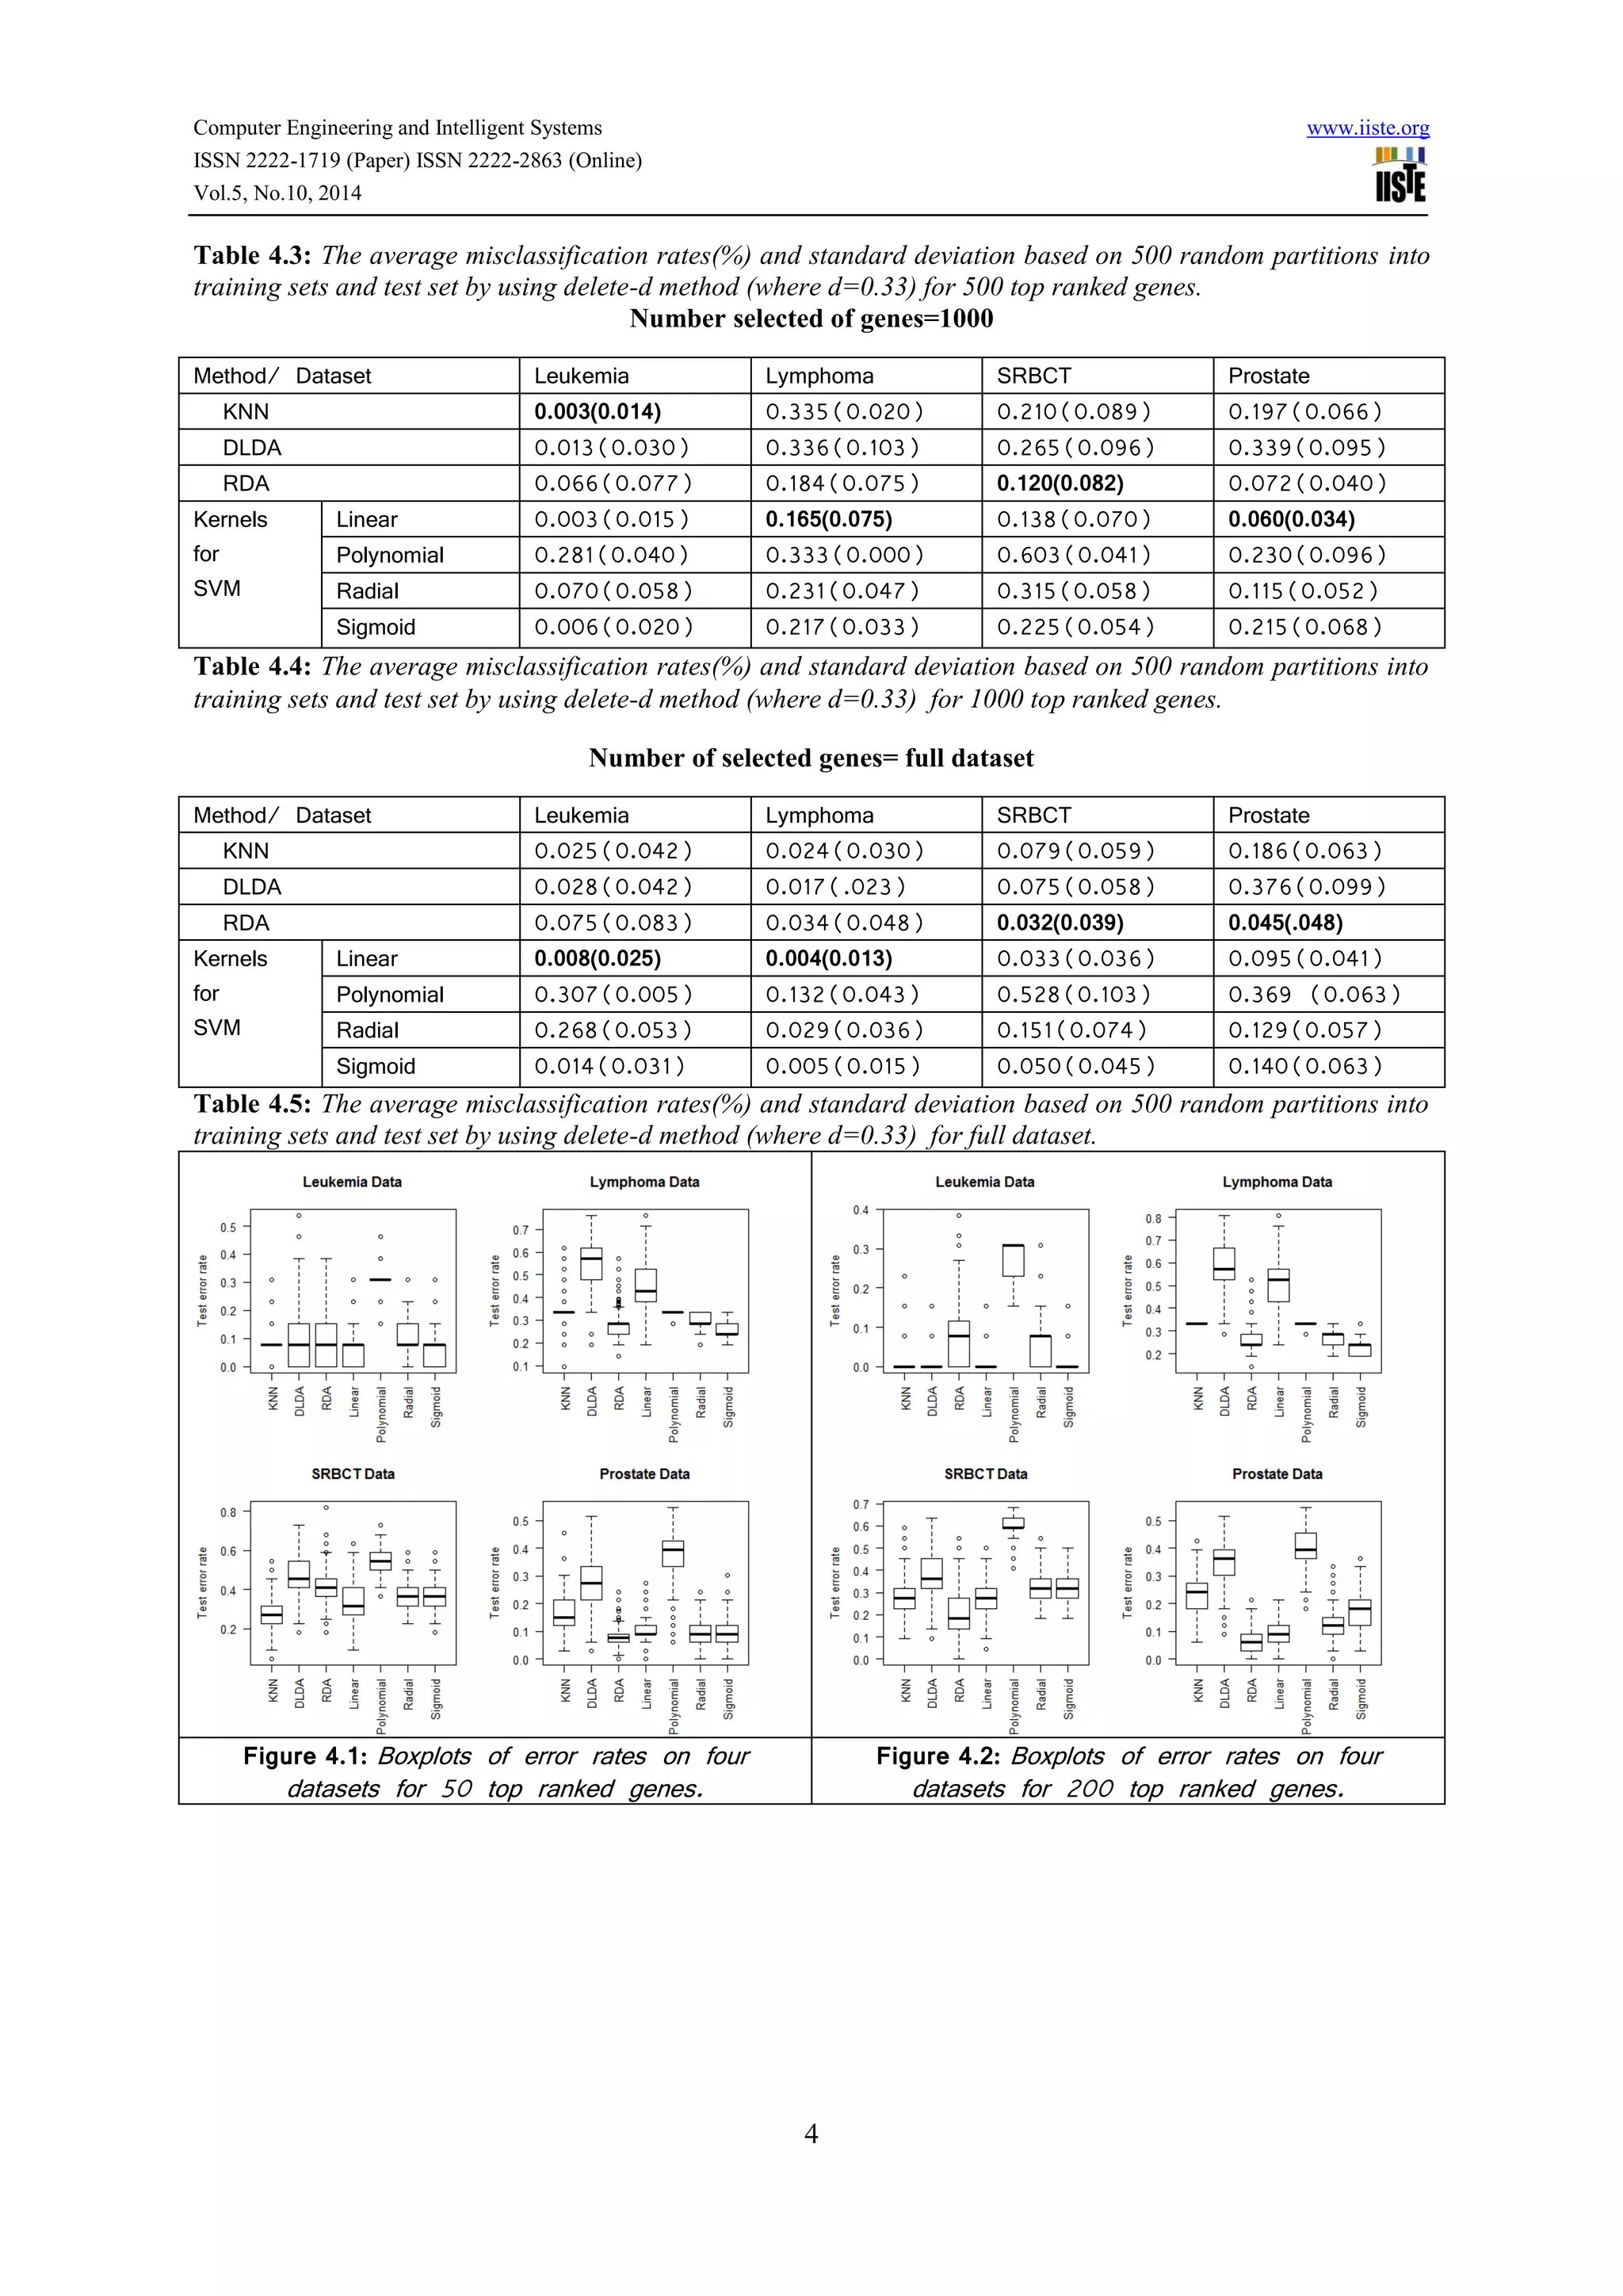
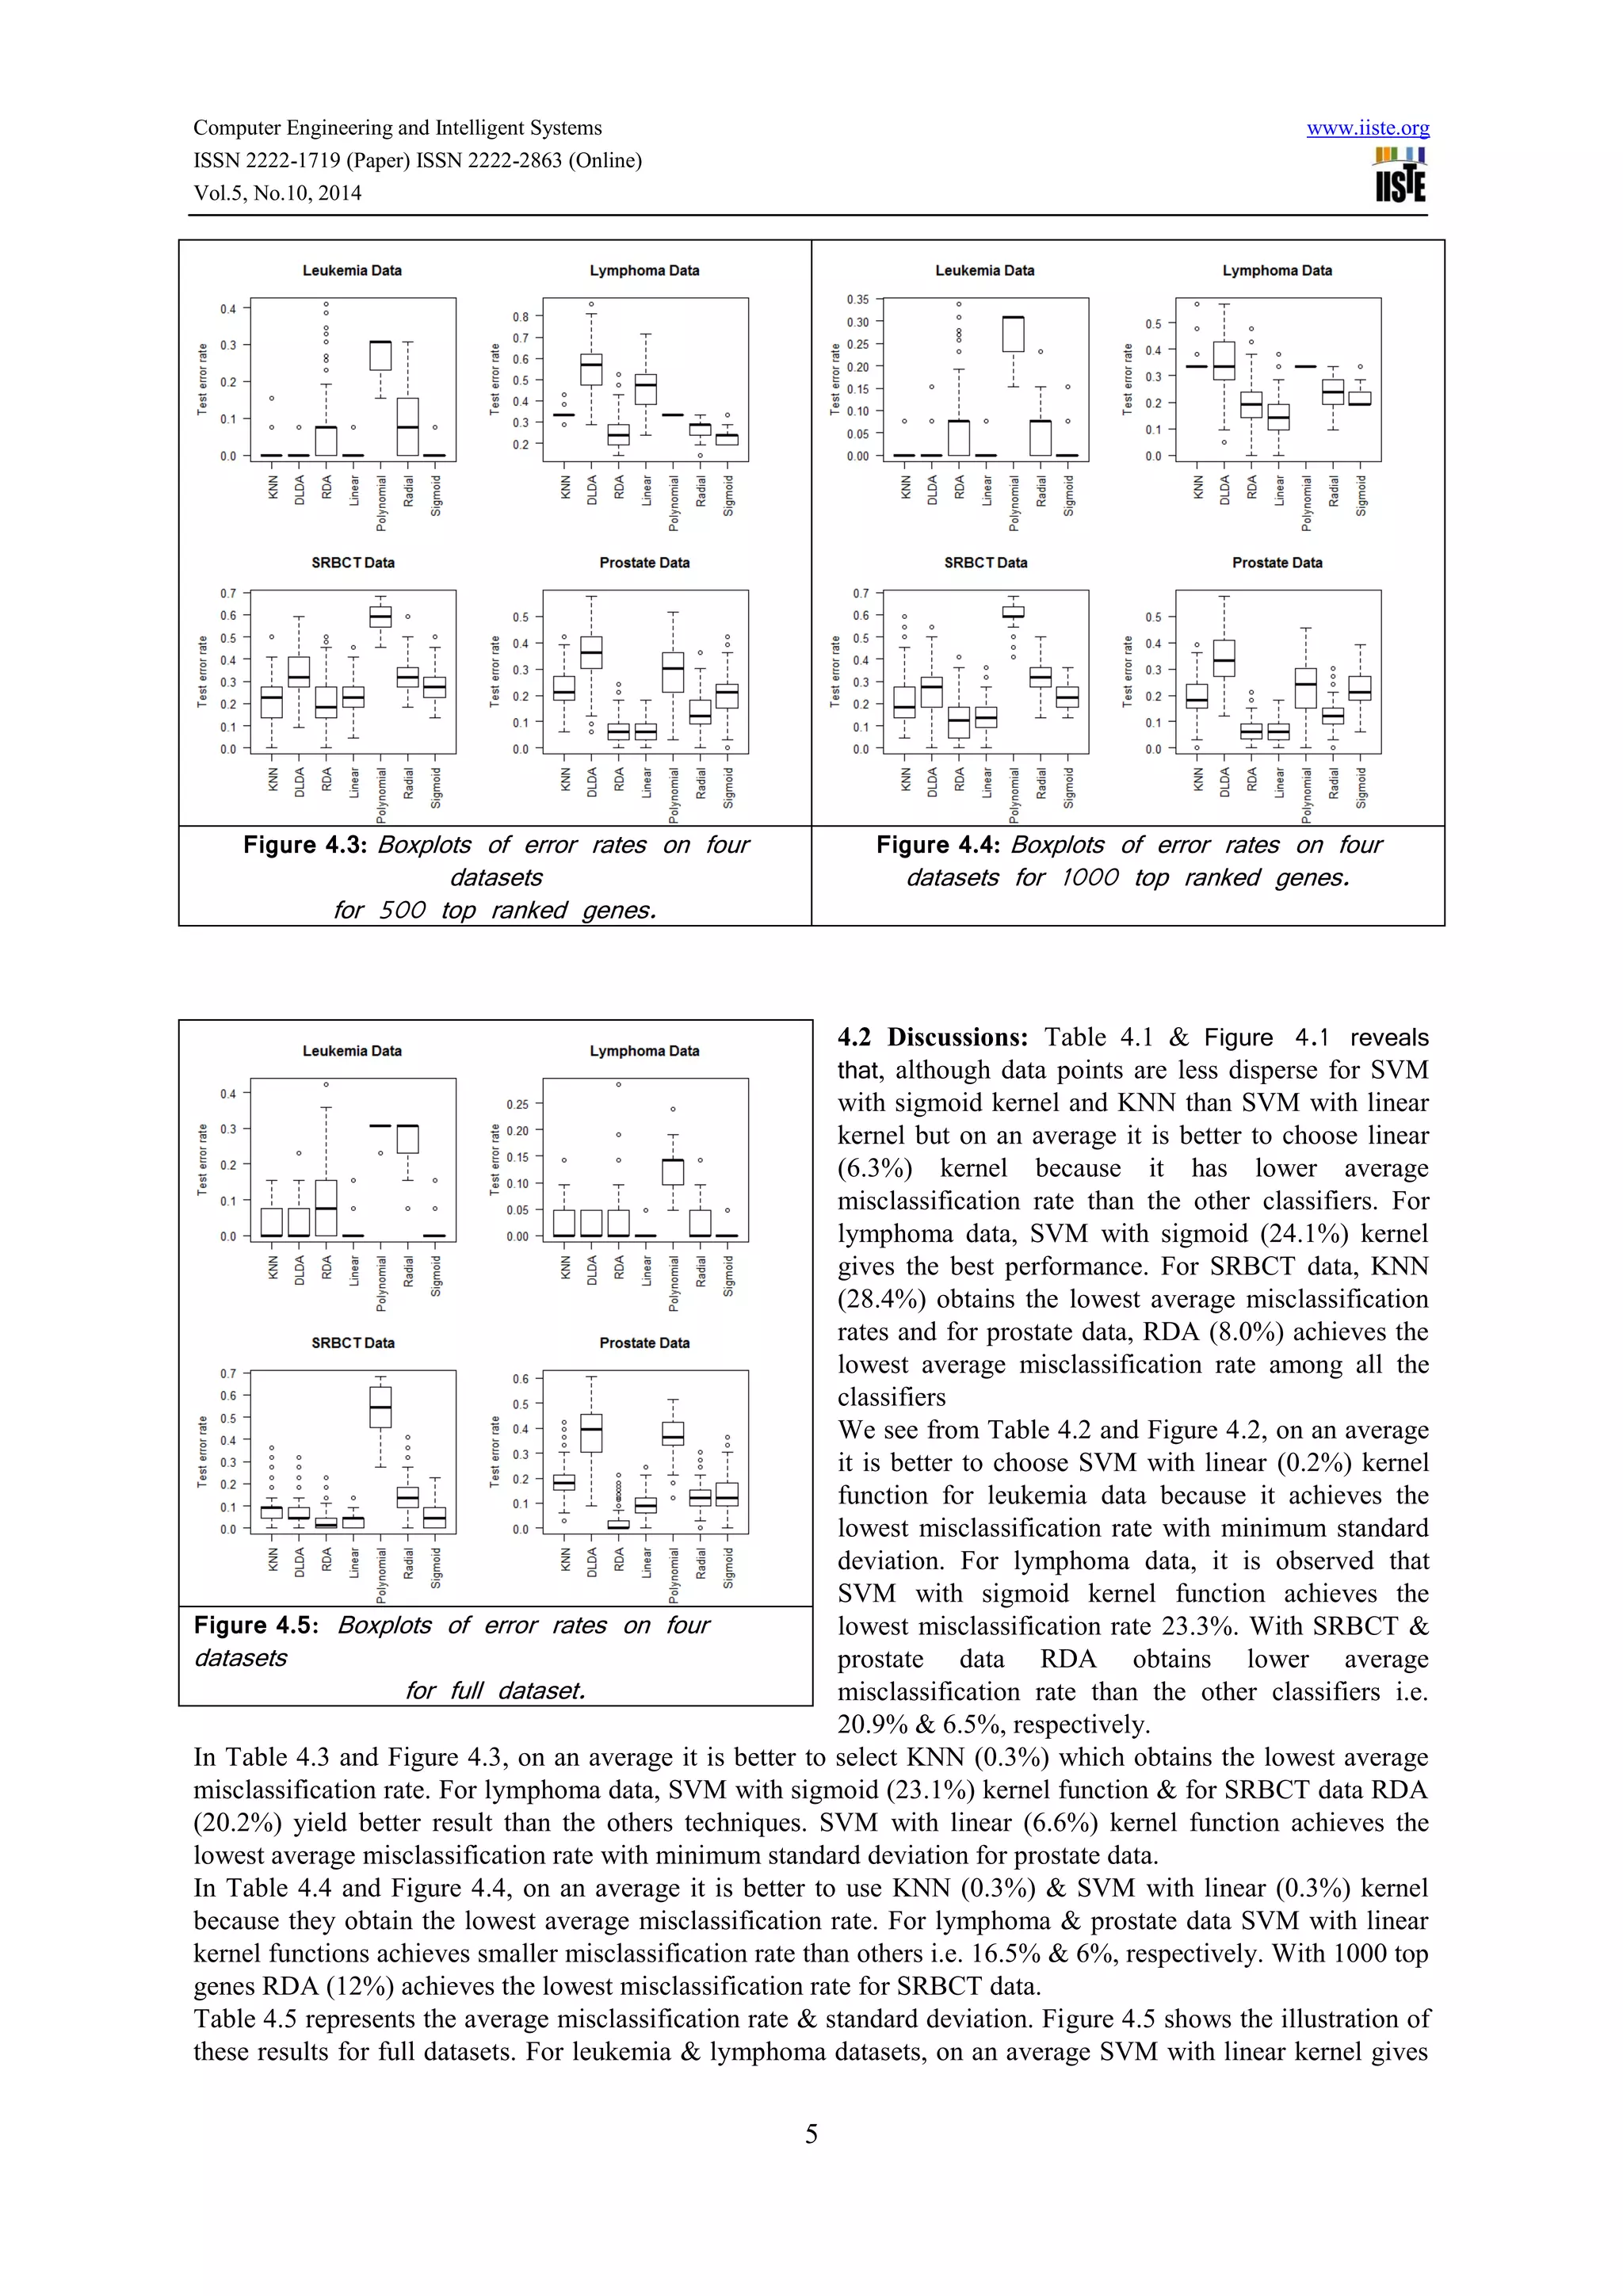
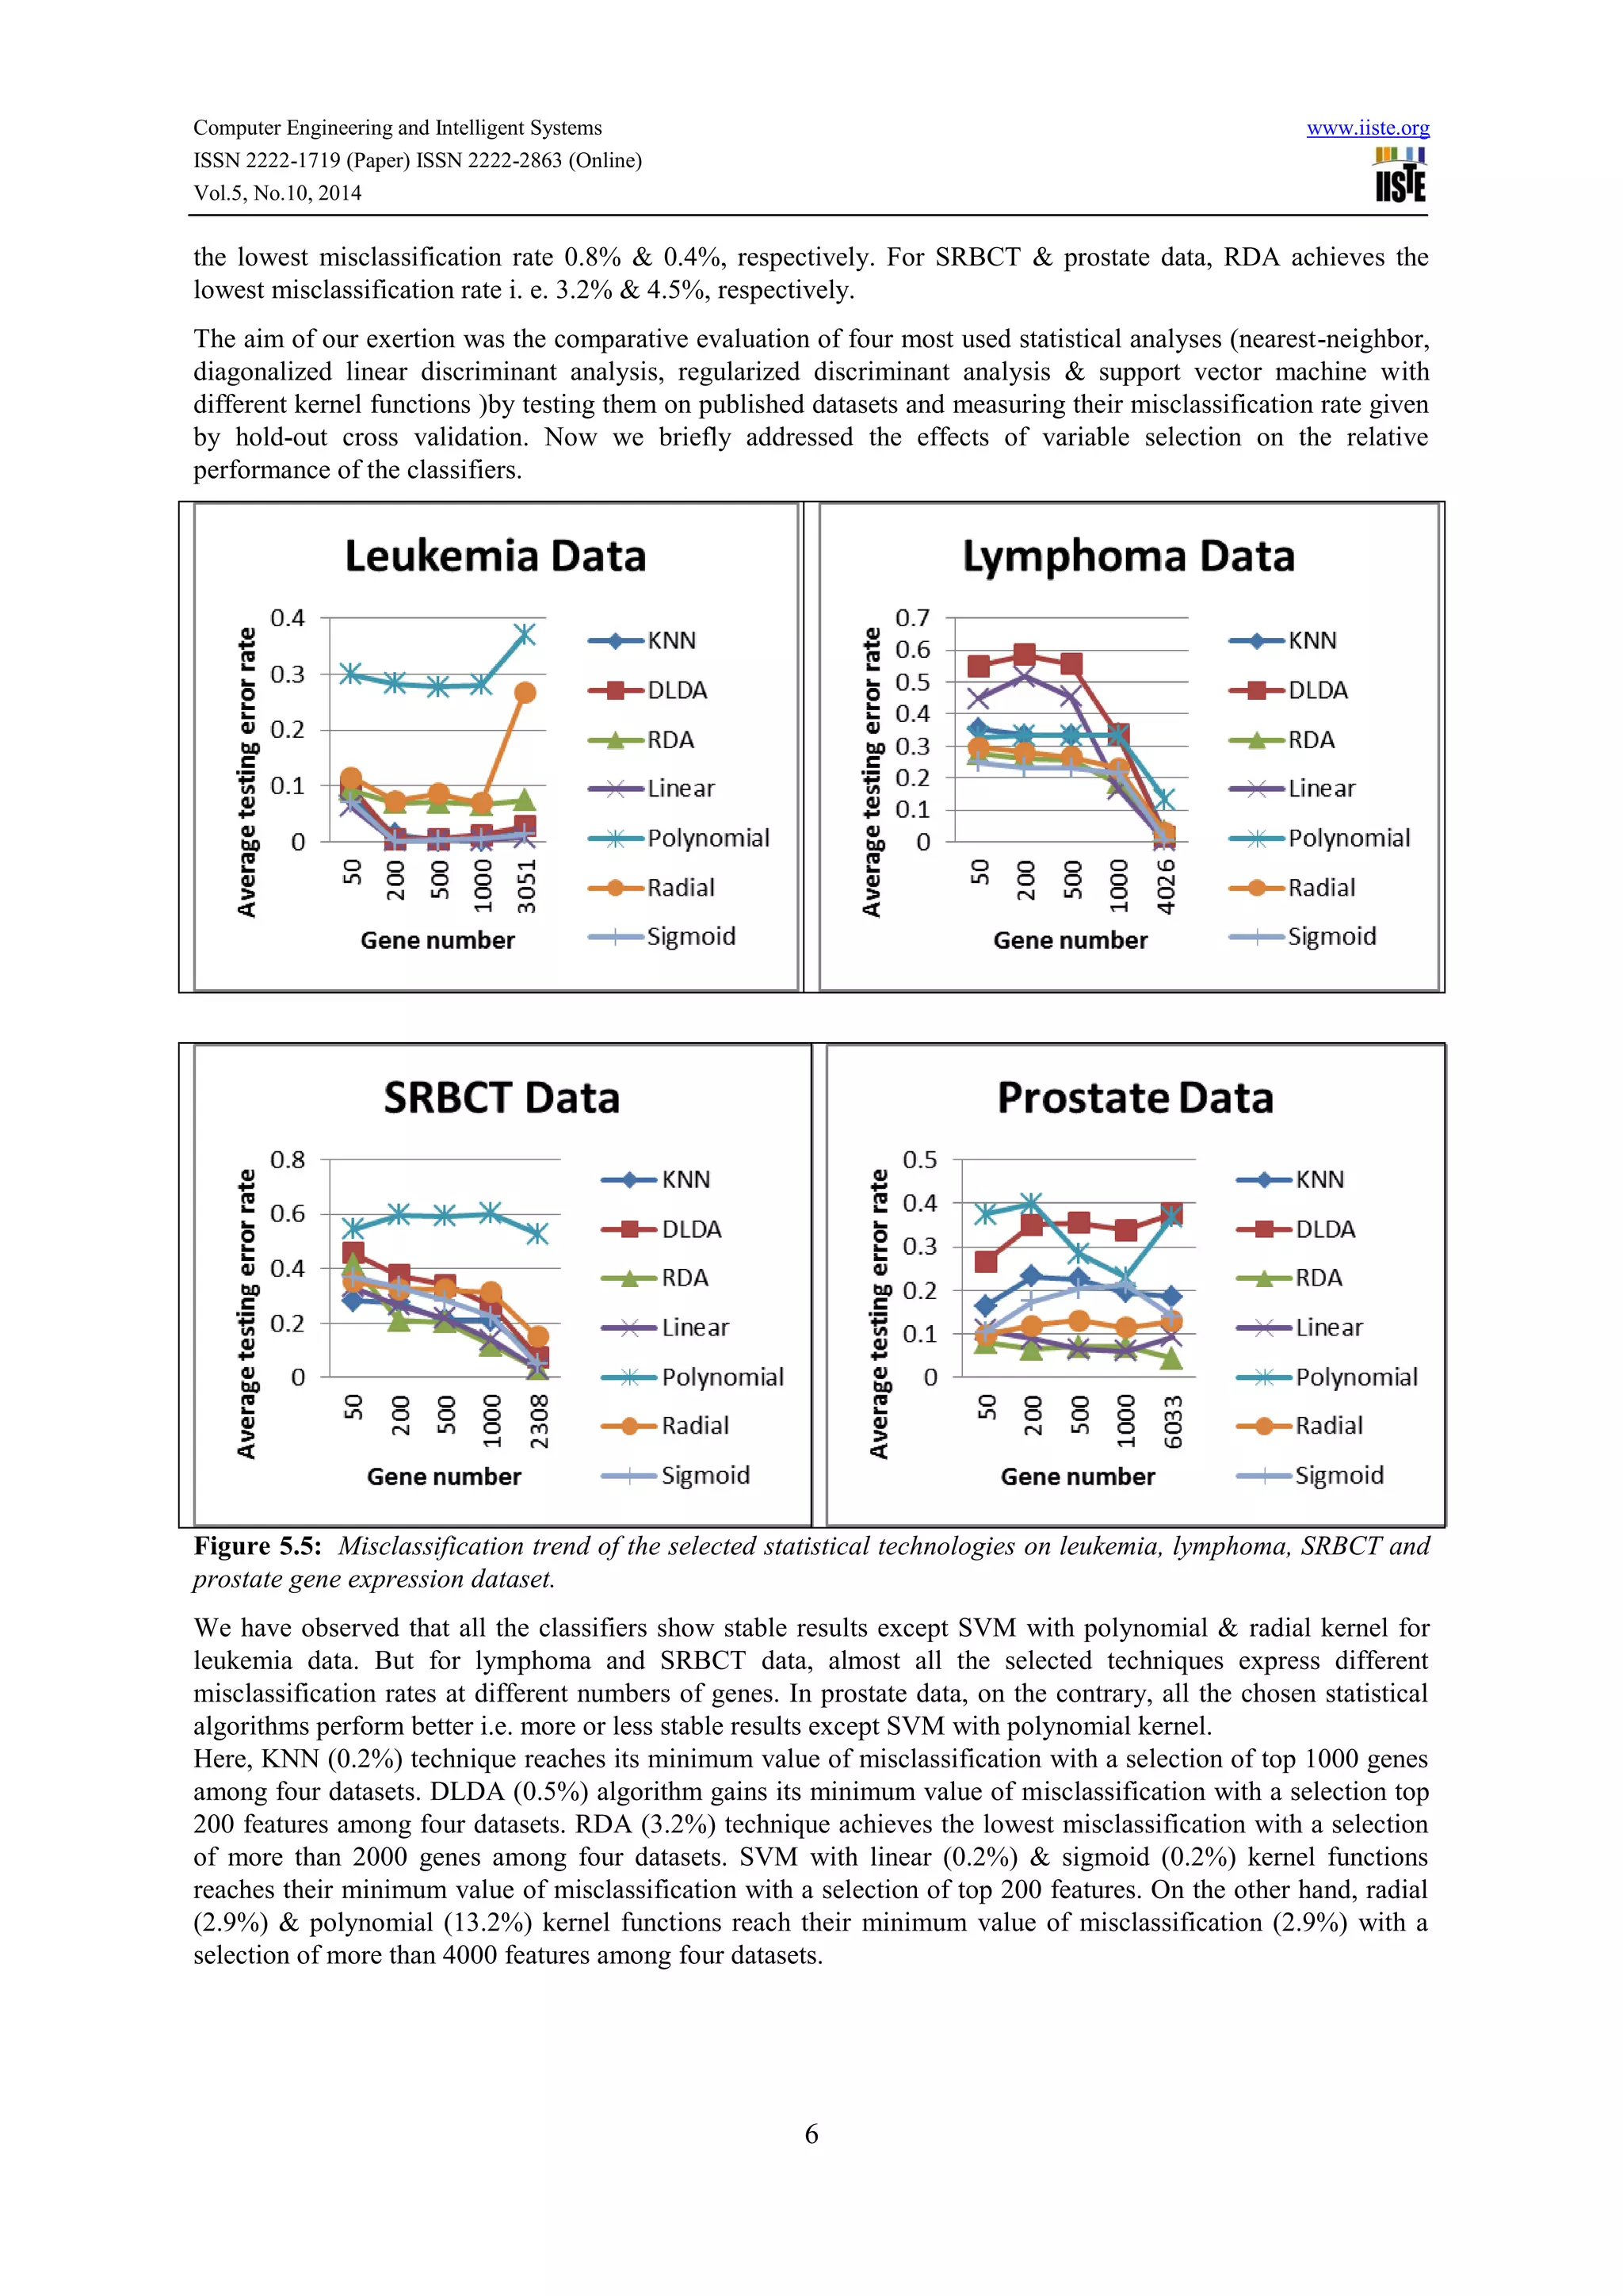
Computer Engineering and Intelligent Systems www.iiste.org
ISSN 2222-1719 (Paper) ISSN 2222-2863 (Online)
Vol.5, No.10, 2014
1
Comparing Prediction Accuracy for Machine Learning and
Other Classical Approaches in Gene Expression Data
Setu Chandra Kar
B.Sc. (Honors) and M. S. Department of Statistics, Shahjalal University of Science & Technology
Sylhet-3114, Bangladesh
Email: setu_kar@yahoo.com
Abstract
Microarray based gene expression profiling has been emerged as an efficient technique for cancer classification,
as well as for diagnosis, prognosis, and treatment purposes. The classification of different tumor types is of great
significance in cancer diagnosis and drug innovation. Using a large number of genes to classify samples based
on a small number of microarrays remains a difficult problem. Feature selection techniques can be used to
extract the marker genes which influence the classification accuracy effectively by eliminating the unwanted
noisy and redundant genes. Quite a number of methods have been proposed in recent years with promising
results. But there are still a lot of issues which need to be addressed and understood. Diagonal discriminant
analysis, regularized discriminant analysis, support vector machines and k-nearest neighbor have been suggested
as among the best methods for small sample size situations. In this paper, we have compared the performance of
different discrimination methods for the classification of tumors based on gene expression data. The methods are
applied to datasets from four recently published cancer gene expression studies. The performance of the
classification technique has been evaluated for varying number of selected features in terms of misclassification
rate using hold-out cross validation. Our study shows that KNN, RDA and SVM with linear kernel methods
have lower misclassification rate than the other algorithms.
Keywords: microarray, gene expression, KNN, DLDA, RDA, SVM
1 Introduction and objectives:
Conventional methods of monitoring and diagnosing cancer rely on a human observer to detect certain features.
Cancer diagnosis is usually achieved using an imaging system, such as X-ray, Magnetic Resonance Imaging
(MRI), Computed Tomography (CT), and ultrasonography. Microarray technology is a new tool that can
automate the diagnostic task and improve the accuracy of the traditional diagnostic techniques (Sarhan, 2009).
The classification of DNA micro array data allows the discovery of hidden patterns in expression profiles and
opens possibility for accurate cancer classification which has great value in providing better treatment and
toxicity minimization on the patients. The gene expression profiles that are obtained from particular microarray
experiments have been widely used for differentiating normal or different cancerous states by using selected
informative genes (Chuang, 2011). However, studying microarray dataset brings about some complexity due to
the huge number of features that contribute to a profile as compared to the very low number of samples. Another
challenge is the presence of biological or technical noise in the dataset, which further affects the accuracy of the
experimental results. In practice, it has been observed that a large number of features may degrade the
performance of classifiers if the number of training samples is small relative to the number of features (Jain,
2000). There are two main procedures in gene expression data classification task: feature selection and
classification. Several gene selection methods have been developed to select these predictive genes, such as t-
statistics, information gain, towing rule, the ratio of between-groups to within-groups sum of squares
(BSS/WSS), Principal Component Analysis (PCA), and Genetic Algorithm (GA). Different classification
methods from statistical and machine learning area have been applied to cancer classification such as Fisher
Linear Discrimination Analysis (FLDA), Diagonal Discriminant Analysis (DLDA), Regularized Discriminant
Analysis (RLDA), Maximum Likelihood Discriminant Rules, Classification Tree, Support Vector Machine
(SVM), K-Nearest Neighbor (KNN), and the aggregating classifiers.
Following are the objectives of our study:
 To examine the classification performance of the selected supervised algorithms using delete-d method;
 To reveal the effect of gene selection on different classification methods.
2 Theoretical backgrounds:
2.1 KNN: KNN is a distance-based approach for classification. In order to classify an observation X in the test
set, KNN takes the following steps: (i) select an integer K (i.e., by cross-validation) and find the K closest
observations in the training set; (ii) classify the observation by majority vote, that is, choose the class that is most
Computer Engineering and Intelligent Systems www.iiste.org
ISSN 2222-1719 (Paper) ISSN 2222-2863 (Online)
Vol.5, No.10, 2014
2
common among those K neighbors (Dudoit et al., 2002; Speed, 2003). The KNN method is the simplest, yet
useful approach to general pattern classification. Its error rate has been proven to be asymptotically at most twice
that of the Bayesian error rate (R.O. Duda, 2002). However, its performance deteriorates dramatically when the
input data set has a relatively low local relevance (J.H. Friedman, 1994).
2.2 DLDA: Diagonal Linear Discriminant Analysis (Dudoit, 2002) is a simplification of classical LDA, which
applies the common diagonal covariance matrix to all classes. It is computationally more efficient than other
LDA-based algorithms. Interestingly, the “weighted voting scheme” for binary classification proposed by
T.R.Golub (1999) can be shown to be a variant of DLDA.
2.3 RDA: Classical Linear Discriminant Analysis (LDA) is not applicable for small sample size problems due to
the singularity of the scatter matrices involved. Regularized LDA (RLDA) provides a simple strategy to
overcome the singularity problem by applying a regularization term, which is commonly estimated via cross-
validation from a set of candidates (Ye, J., 2006). RDA is better able to extract the relevant discriminatory
information from training data than the other classifiers tested, thus obtaining a lower error rate (Pima &
Aladjem, 2004). The RDA combines strengths of linear discriminant analysis (LDA) and quadratic discriminant
analysis (QDA). It solves the small sample size and ill-posed problems suffered from QDA and LDA through a
regularization technique (Lee et al., 2010).
2.4 SVM: The SVM has been shown to give superb performance in binary classification tasks. Intuitively, SVM
aims at searching for a hyperplane that separates the two classes of data with largest margin which is the distance
between the hyperplane and the point closest to it). For multiclass SVM, there are many decomposition
techniques that can adapt SVM to identify non-binary class divisions such as one-versus-the rest, pair wise
comparison, and error-correcting output coding. SVM was used by Park and Cho (2003) and Li et al. (2004).
3 Microarray Datasets
Four publicly available microarray data sets are used for this study, with sample sizes ranging from 38 to 102
and numbers of genes ranging from 2,308 to 6033. Gene expression values for all the datasets are available from
the Bioconductor libraries.
A. Leukemia: This dataset contains gene expression (3051 genes and 38 tumor mRNA samples) levels of n =38
patients either suffering from acute lymphoblastic leukemia (ALL, 27 cases) or acute myeloid leukemia (AML,
11 cases) where ALL and AML classes are coded in 1 and 2 respectively. It was obtained from Affymetrix
oligonucleotide microarrays. Following the protocol in Dudoit et al. (2002), it was preprocessed by thresholding,
filtering, a logarithmic transformation and standardization, so that the data finally comprise the expression values
of p=3051 genes. The data are described in Golub et al. (1999) and can be freely downloaded from http://www-
genome.wi.mit.edu/MPR/.
B. Lymphoma: The lymphoma dataset consists of 42 samples of diffuse large B-cell lymphoma (DLBCL), 9
samples of follicular lymphoma (FL), and 11 samples of chronic lymphocytic leukemia (CLL). DBLCL, FL, and
CLL classes are coded in 1, 2, and 3, respectively. The total sample size is n=62, and the expression of p =4026
well-measured genes, preferentially expressed in lymphoid cells or with known immunological or oncological
importance is documented. Matrix of gene expression data and arrays were normalized, imputed, log
transformed, and standardized to zero mean and unit variance across genes as described in Dettling (2004) and
Dettling and Beuhlmann (2002). More information on these data can be found in Alizadeh et al. (2000) and can
be freely downloaded from http://llmpp.nih.gov/lymphoma
C. SRBCT: This gene expression data (2308 genes for 83 samples) obtained from the microarray experiments of
Small Round Blue Cell Tumors (SRBCT) of childhood cancer study. This data set contains 83 samples with
2308 genes: 29 cases of Ewing sarcoma (EWS), 11 cases of Burkitt lymphoma (BL), 18 cases of neuroblastoma
(NB), 25 cases of rhabdomyosarcoma (RMS). A total of 63 training samples and 25 test samples are provided in
Khan et al. (2001) and was obtained from cDNA microarrays. Five of the test set are non-SRBCT and are not
considered here. The training sample indexes correspond to 1to 65 and the test sample indexes (without non-
SRBCT sample) correspond to 66 to 83. Each tissue sample is associated with a thoroughly preprocessed
expression profile of p= 2,308 genes, already standardized to zero mean and unit variance across genes. Data can
be freely downloaded from http://www.thep.lu.se/pub/Preprints/01/lu_tp_01_06_supp.html.
D. Prostate: The prostate dataset consists of 52 prostate tumor and 50 normal samples and obtained using the
Affymetrix technology. Normal and tumor classes are coded in 1 and 2, respectively. Matrix of gene expression
data and arrays were normalized, log transformed, and standardized to zero mean and unit variance across genes
as described in Dettling (2004) and Dettling and Beuhlmann (2002). More information on these data can be
found in Chung and Keles (2010) and can be freely downloaded from http://www-genome.wi.mit.edu/cancer.
Computer Engineering and Intelligent Systems www.iiste.org
ISSN 2222-1719 (Paper) ISSN 2222-2863 (Online)
Vol.5, No.10, 2014
3
4 Experimental Results and Discussions:
For the classification job, we have started with the gene expression values existing for cancer disease samples
obtained from the DNA microarray experiments. For identifying genes responsible for the classification of
different tumor types, the available dataset were divided into two groups: one used for the training purpose and
the other used for the testing purpose. The training set of data is utilized for learning the parameters of the
classifier, while the test set of data is utilized to measure the misclassification rate.
The essential idea of hold-out cross validation is to split the sample data into separate train and test datasets
(Webb, 2002). The classifier is trained on the training set, and its performance is estimated by applying it to the
test set. The selection of the train and test sets is done randomly, and the selected proportions are usually 70%
for training and 30% for testing. The major disadvantage of this procedure is that the classifier is unable of
making use of all data for training; however, if the sample size is large enough this could be accommodated.
(Jain et al., 2000).
4.1 Results: To study the impact of the selected gene number on the four classification algorithms, we compare
their performances when different numbers of genes are used in the classification. For each data set, experiments
are carried out with feature size 50, 200, 500, 1000 and full dataset. We choose the most discriminatory genes
according to t-test (two groups) and ANOVA (more than two groups).To reduce the variability each experiment
is repeated 500 times, and the average test error rates and their standard variances over the 500 experiments are
reported. We now present our experimental results for the four classifiers (KNN, SVM, DLDA, and RDA) with
four data sets.
Number selected of genes=50
Method/ Dataset Leukemia Lymphoma SRBCT Prostate
KNN 0.082(0.062) 0.353(0.056) 0.284(0.092) 0.165(0.059)
DLDA 0.098(0.085) 0.551(0.093) 0.459(0.096) 0.267(0.091)
RDA 0.093(0.080) 0.277(0.062) 0.415(0.083) 0.080(0.041)
Kernels
for
SVM
Linear 0.063(0.066) 0.447(0.099) 0.333(0.086) 0.109(0.044)
Polynomial 0.299(0.036) 0.328(0.015) 0.545(0.059) 0.375(0.073)
Radial 0.115(0.067) 0.297(0.030) 0.353(0.063) 0.098(0.041)
Sigmoid 0.071(0.061) 0.249(0.038) 0.369(0.060) 0.104(0.052)
Table 4.1: The average misclassification rates(%) and standard deviation based on 500 random partitions into
training sets and test set by using delete-d method (where d=0.33) for 50 top ranked genes.
Number selected of genes=200
Method/ Dataset Leukemia Lymphoma SRBCT Prostate
KNN 0.014(0.034) 0.333(0.00) 0.276(0.080) 0.232(0.068)
DLDA 0.005(0.021) 0.584(0.088) 0.377(0.097) 0.351(0.071)
RDA 0.070(0.085) 0.261(0.061) 0.209(0.100) 0.065(0.042)
Kernels
for
SVM
Linear 0.002(0.013) 0.517(0.099) 0.266(0.084) 0.089(0.038)
Polynomial 0.283(0.044) 0.332(0.005) 0.597(0.044) 0.399(0.061)
Radial 0.073(0.063) 0.281(0.033) 0.326(0.064) 0.119(0.055)
Sigmoid 0.002(0.014) 0.233(0.033) 0.334(0.064) 0.175(0.060)
Table 4.2: The average misclassification rates(%) and standard deviation based on 500 random partitions into
training sets and test set by using delete-d method (where d=0.33) for 200 top ranked genes.
Number selected of genes=500
Method/ Dataset Leukemia Lymphoma SRBCT Prostate
KNN 0.003(0.016) 0.334(0.007) 0.212(0.081) 0.226(0.071)
DLDA 0.006(0.021) 0.556(0.091) 0.339(0.094) 0.355(0.089)
RDA 0.071(0.086) 0.257(0.065) 0.202(0.089) 0.072(0.043)
Kernels
for
SVM
Linear 0.004(0.017) 0.453(0.101) 0.217(0.079) 0.066(0.036)
Polynomial 0.277(0.043) 0.333(0.000) 0.593(0.042) 0.285(0.091)
Radial 0.086(0.073) 0.265(0.040) 0.324(0.055) 0.132(0.057)
Sigmoid 0.004(0.016) 0.231(0.033) 0.282(0.059) 0.204(0.066)
Computer Engineering and Intelligent Systems www.iiste.org
ISSN 2222-1719 (Paper) ISSN 2222-2863 (Online)
Vol.5, No.10, 2014
4
Table 4.3: The average misclassification rates(%) and standard deviation based on 500 random partitions into
training sets and test set by using delete-d method (where d=0.33) for 500 top ranked genes.
Number selected of genes=1000
Method/ Dataset Leukemia Lymphoma SRBCT Prostate
KNN 0.003(0.014) 0.335(0.020) 0.210(0.089) 0.197(0.066)
DLDA 0.013(0.030) 0.336(0.103) 0.265(0.096) 0.339(0.095)
RDA 0.066(0.077) 0.184(0.075) 0.120(0.082) 0.072(0.040)
Kernels
for
SVM
Linear 0.003(0.015) 0.165(0.075) 0.138(0.070) 0.060(0.034)
Polynomial 0.281(0.040) 0.333(0.000) 0.603(0.041) 0.230(0.096)
Radial 0.070(0.058) 0.231(0.047) 0.315(0.058) 0.115(0.052)
Sigmoid 0.006(0.020) 0.217(0.033) 0.225(0.054) 0.215(0.068)
Table 4.4: The average misclassification rates(%) and standard deviation based on 500 random partitions into
training sets and test set by using delete-d method (where d=0.33) for 1000 top ranked genes.
Number of selected genes= full dataset
Method/ Dataset Leukemia Lymphoma SRBCT Prostate
KNN 0.025(0.042) 0.024(0.030) 0.079(0.059) 0.186(0.063)
DLDA 0.028(0.042) 0.017(.023) 0.075(0.058) 0.376(0.099)
RDA 0.075(0.083) 0.034(0.048) 0.032(0.039) 0.045(.048)
Kernels
for
SVM
Linear 0.008(0.025) 0.004(0.013) 0.033(0.036) 0.095(0.041)
Polynomial 0.307(0.005) 0.132(0.043) 0.528(0.103) 0.369 (0.063)
Radial 0.268(0.053) 0.029(0.036) 0.151(0.074) 0.129(0.057)
Sigmoid 0.014(0.031) 0.005(0.015) 0.050(0.045) 0.140(0.063)
Table 4.5: The average misclassification rates(%) and standard deviation based on 500 random partitions into
training sets and test set by using delete-d method (where d=0.33) for full dataset.
Figure 4.1: Boxplots of error rates on four
datasets for 50 top ranked genes.
Figure 4.2: Boxplots of error rates on four
datasets for 200 top ranked genes.
Computer Engineering and Intelligent Systems www.iiste.org
ISSN 2222-1719 (Paper) ISSN 2222-2863 (Online)
Vol.5, No.10, 2014
5
Figure 4.3: Boxplots of error rates on four
datasets
for 500 top ranked genes.
Figure 4.4: Boxplots of error rates on four
datasets for 1000 top ranked genes.
4.2 Discussions: Table 4.1 & Figure 4.1 reveals
that, although data points are less disperse for SVM
with sigmoid kernel and KNN than SVM with linear
kernel but on an average it is better to choose linear
(6.3%) kernel because it has lower average
misclassification rate than the other classifiers. For
lymphoma data, SVM with sigmoid (24.1%) kernel
gives the best performance. For SRBCT data, KNN
(28.4%) obtains the lowest average misclassification
rates and for prostate data, RDA (8.0%) achieves the
lowest average misclassification rate among all the
classifiers
We see from Table 4.2 and Figure 4.2, on an average
it is better to choose SVM with linear (0.2%) kernel
function for leukemia data because it achieves the
lowest misclassification rate with minimum standard
deviation. For lymphoma data, it is observed that
SVM with sigmoid kernel function achieves the
lowest misclassification rate 23.3%. With SRBCT &
prostate data RDA obtains lower average
misclassification rate than the other classifiers i.e.
20.9% & 6.5%, respectively.
In Table 4.3 and Figure 4.3, on an average it is better to select KNN (0.3%) which obtains the lowest average
misclassification rate. For lymphoma data, SVM with sigmoid (23.1%) kernel function & for SRBCT data RDA
(20.2%) yield better result than the others techniques. SVM with linear (6.6%) kernel function achieves the
lowest average misclassification rate with minimum standard deviation for prostate data.
In Table 4.4 and Figure 4.4, on an average it is better to use KNN (0.3%) & SVM with linear (0.3%) kernel
because they obtain the lowest average misclassification rate. For lymphoma & prostate data SVM with linear
kernel functions achieves smaller misclassification rate than others i.e. 16.5% & 6%, respectively. With 1000 top
genes RDA (12%) achieves the lowest misclassification rate for SRBCT data.
Table 4.5 represents the average misclassification rate & standard deviation. Figure 4.5 shows the illustration of
these results for full datasets. For leukemia & lymphoma datasets, on an average SVM with linear kernel gives
Figure 4.5: Boxplots of error rates on four
datasets
for full dataset.
Computer Engineering and Intelligent Systems www.iiste.org
ISSN 2222-1719 (Paper) ISSN 2222-2863 (Online)
Vol.5, No.10, 2014
6
the lowest misclassification rate 0.8% & 0.4%, respectively. For SRBCT & prostate data, RDA achieves the
lowest misclassification rate i. e. 3.2% & 4.5%, respectively.
The aim of our exertion was the comparative evaluation of four most used statistical analyses (nearest-neighbor,
diagonalized linear discriminant analysis, regularized discriminant analysis & support vector machine with
different kernel functions )by testing them on published datasets and measuring their misclassification rate given
by hold-out cross validation. Now we briefly addressed the effects of variable selection on the relative
performance of the classifiers.
Figure 5.5: Misclassification trend of the selected statistical technologies on leukemia, lymphoma, SRBCT and
prostate gene expression dataset.
We have observed that all the classifiers show stable results except SVM with polynomial & radial kernel for
leukemia data. But for lymphoma and SRBCT data, almost all the selected techniques express different
misclassification rates at different numbers of genes. In prostate data, on the contrary, all the chosen statistical
algorithms perform better i.e. more or less stable results except SVM with polynomial kernel.
Here, KNN (0.2%) technique reaches its minimum value of misclassification with a selection of top 1000 genes
among four datasets. DLDA (0.5%) algorithm gains its minimum value of misclassification with a selection top
200 features among four datasets. RDA (3.2%) technique achieves the lowest misclassification with a selection
of more than 2000 genes among four datasets. SVM with linear (0.2%) & sigmoid (0.2%) kernel functions
reaches their minimum value of misclassification with a selection of top 200 features. On the other hand, radial
(2.9%) & polynomial (13.2%) kernel functions reach their minimum value of misclassification (2.9%) with a
selection of more than 4000 features among four datasets.
Computer Engineering and Intelligent Systems www.iiste.org
ISSN 2222-1719 (Paper) ISSN 2222-2863 (Online)
Vol.5, No.10, 2014
7
5 Conclusions:
In this paper, we have shown the comparative results of SVM using different kernels, KNN, DLDA and RDA on
four different datasets. Here, we have attempted to explore the best choice among KNN, DLDA, RDA and SVM
with different kernel functions. The selected kernels are linear, polynomial, radial basis function (RBF) and
sigmoid kernels. Then, focusing on feature selection, we have compared the classification techniques for varying
number of selected features and explore the most suitable method in each situation. For different number of
informative genes, we have found that KNN, RDA and SVM with linear kernel function achieve the lowest
misclassification rate most of the cases. Sometimes other algorithms have provided the lowest misclassification
rate. The misclassification rate of the methods has fluctuated when different numbers of informative genes were
used.
Through these analyses, we can conclude that classification using gene expression data provides a promising
future for cancer research.
Acknowledgements
I would like to express my greatest appreciation to my thesis advisor Professor Dr. Mohammad Shahidul Islam
for his guidance and encouragement.
Bibliography:
Sarhan, A. M. (2009). Cancer classification based on microarray gene expression data using DCT and ANN.
Journal of Theoretical and Applied Information Technology, Vol. 6 Issue 2, p208.
Alizadeh, A., Eisen, M. B., Davis, R.E., Ma, C., Lossos, I.S., Rosenwald, A., Boldrick, J.C., Sabet, H., Tran, T.,
Yu, X., Powell, J.I., Yang, L., Marti, G.E., Moore, T., Hudson, J .Jr., Lu ,L., Lewis, D.B., Tibshirani, R.,
Sherlock, G., Chan, W.C., Greiner, T.C., Weisenburger, D.D., Armitage, J.O., Warnke, R., Levy, R.,
Wilson, W., Grever, M.R., Byrd, J.C., Botstein, D., Brown, P.O., & Staudt, L.M. (2000). Distinct types
of diffuse large B-cell lymphoma identified by gene expression profiling, Nature, Vol. 403, pp. 503–511.
Chuang, L. Y., Yang, C. H., Wu, K. C. and Yang, C. H. (2011). A hybrid feature selection method for DNA
microarray data. Computers in Biology and Medicine, vol. 41, no. 4, pp. 228–237.
Chung, D. & Keles, S. (2010). Sparse partial least squares classification for high dimensional data. Statistical
Applications in Genetics and Molecular Biology, Vol. 9, Article 17.
Dettling, M. & Beuhlmann, P. (2002). Supervised clustering of genes, Genome Biology, Vol. 3, pp.
research0069.1–0069.15.
Dettling, M (2004). BagBoosting for tumor classification with gene expression data, Bioinformatics, Vol. 20, pp.
3583–3593.
Duda, R. O., Hart, P. E. & Stork, D. G. (2000). Pattern Classification (Second Edition). A Wiley-Interscience
Publication.
Dudoit, S., Fridlyand, J. & Speed, T. P. (2002). Comparison of discrimination methods for the classification of
tumors using gene expression data. Journal of the American Statistical Association, Vol. 97, No. 457, p.
77–87.
Friedman, J. H. (1994). Flexible metric nearest neighbor classification. Technical report, Dept. of Statistics,
Stanford University.
Ghorai, S., Mukherjee, A., Sengupta, S. and Dutta, P. (2010). Multicategory cancer classification from gene
expression data by multiclass nppc ensemble. International Conference on Systems in Medicine and
Biology (ICSMB), pp. 4–48.
Golub, G. & Loan, C. F. Van. (1996). Matrix Computations. The Johns Hopkins University Press, 3rd edition.
Golub, T., Slonim, D., Tamayo, P., Huard, C., Gaasenbeek, M., Mesirov, J., Coller, H., Loh, M., Downing, J.,
and Caligiuri, M. (1999). Molecular classification of cancer: Class discovery and class prediction by
gene expression monitoring. Science, Vol. 286, 531–537.
Jain, A. K., Duin, R. P. W., & Jianchang, M. (2000). Statistical pattern recognition: a review. Pattern Analysis
and Machine Intelligence, IEEE Transactions on, 22(1), 4-37.
Khan, J. and Wei, J. S. and Ringner, M. and Saal, L. H. and Ladanyi, M. and Westermann, F. and Berthold, F.
and Schwab, M. and Antonescu, C. R. and Peterson, C. and Meltzer, P. S. (2001). Classification and
diagnostic prediction of cancers using gene expression profiling and artificial neural networks, Nature
Medecine, 7, 673–679.
Computer Engineering and Intelligent Systems www.iiste.org
ISSN 2222-1719 (Paper) ISSN 2222-2863 (Online)
Vol.5, No.10, 2014
8
Lee, C.-C.; Huang, S.-S. & Shih, C.-Y. (2010). Facial Affect Recognition Using Regularized Discriminant
Analysis-Based Algorithms, EURASIP J. Adv. Sig. Proc. 2010 .
Li, T., Zhang, C., and Ogihara, M. (2004). A comparative study of feature selection and multiclass classification
methods for tissue classification based on gene expression. Bioinformatics.
Li, H., Zhang, K. & Jiang, T. (2005). Robust and Accurate Cancer Classification with Gene Expression
Profiling. Proceedings of the 2005 IEEE Computational Systems Bioinformatics Conference, pages 320-
321.
Park, C. and Cho, S.-B. (2003). Genetic search for optimal ensemble of feature classifier pairs in dna gene
expression profiles. In Neural Networks, volume 3, pages 1702– 1707. Proceedings of the International
Joint Conference on, IEEE.
Pima, I. & Aladjem, M. (2004). Regularized discriminant analysis for face recognition. Pattern Recognition 37
(9) , 1945-1948.
Speed, T., Ed. (2003). Statistical Analysis of Gene Expression Microarray Data. Interdisciplinary Statistics
Series, Chapman & Hall/CRC.
Webb, A. R. (2002). Statistical pattern recognition. West Sussex, England; New Jersey: Wiley.
Ye, J., Xiong, T., Li, Q., Janardan, R., Bi, J., Cherkassky, V., Kambhamettu, C. (2006). Efficient Model
Selection for Regularized Linear Discriminant Analysis.
Business, Economics, Finance and Management Journals PAPER SUBMISSION EMAIL
European Journal of Business and Management EJBM@iiste.org
Research Journal of Finance and Accounting RJFA@iiste.org
Journal of Economics and Sustainable Development JESD@iiste.org
Information and Knowledge Management IKM@iiste.org
Journal of Developing Country Studies DCS@iiste.org
Industrial Engineering Letters IEL@iiste.org
Physical Sciences, Mathematics and Chemistry Journals PAPER SUBMISSION EMAIL
Journal of Natural Sciences Research JNSR@iiste.org
Journal of Chemistry and Materials Research CMR@iiste.org
Journal of Mathematical Theory and Modeling MTM@iiste.org
Advances in Physics Theories and Applications APTA@iiste.org
Chemical and Process Engineering Research CPER@iiste.org
Engineering, Technology and Systems Journals PAPER SUBMISSION EMAIL
Computer Engineering and Intelligent Systems CEIS@iiste.org
Innovative Systems Design and Engineering ISDE@iiste.org
Journal of Energy Technologies and Policy JETP@iiste.org
Information and Knowledge Management IKM@iiste.org
Journal of Control Theory and Informatics CTI@iiste.org
Journal of Information Engineering and Applications JIEA@iiste.org
Industrial Engineering Letters IEL@iiste.org
Journal of Network and Complex Systems NCS@iiste.org
Environment, Civil, Materials Sciences Journals PAPER SUBMISSION EMAIL
Journal of Environment and Earth Science JEES@iiste.org
Journal of Civil and Environmental Research CER@iiste.org
Journal of Natural Sciences Research JNSR@iiste.org
Life Science, Food and Medical Sciences PAPER SUBMISSION EMAIL
Advances in Life Science and Technology ALST@iiste.org
Journal of Natural Sciences Research JNSR@iiste.org
Journal of Biology, Agriculture and Healthcare JBAH@iiste.org
Journal of Food Science and Quality Management FSQM@iiste.org
Journal of Chemistry and Materials Research CMR@iiste.org
Education, and other Social Sciences PAPER SUBMISSION EMAIL
Journal of Education and Practice JEP@iiste.org
Journal of Law, Policy and Globalization JLPG@iiste.org
Journal of New Media and Mass Communication NMMC@iiste.org
Journal of Energy Technologies and Policy JETP@iiste.org
Historical Research Letter HRL@iiste.org
Public Policy and Administration Research PPAR@iiste.org
International Affairs and Global Strategy IAGS@iiste.org
Research on Humanities and Social Sciences RHSS@iiste.org
Journal of Developing Country Studies DCS@iiste.org
Journal of Arts and Design Studies ADS@iiste.org
The IISTE is a pioneer in the Open-Access hosting service and academic event management.
The aim of the firm is Accelerating Global Knowledge Sharing.
More information about the firm can be found on the homepage:
http://www.iiste.org
CALL FOR JOURNAL PAPERS
There are more than 30 peer-reviewed academic journals hosted under the hosting platform.
Prospective authors of journals can find the submission instruction on the following
page: http://www.iiste.org/journals/ All the journals articles are available online to the
readers all over the world without financial, legal, or technical barriers other than those
inseparable from gaining access to the internet itself. Paper version of the journals is also
available upon request of readers and authors.
MORE RESOURCES
Book publication information: http://www.iiste.org/book/
IISTE Knowledge Sharing Partners
EBSCO, Index Copernicus, Ulrich's Periodicals Directory, JournalTOCS, PKP Open
Archives Harvester, Bielefeld Academic Search Engine, Elektronische Zeitschriftenbibliothek
EZB, Open J-Gate, OCLC WorldCat, Universe Digtial Library , NewJour, Google Scholar

More Related Content

What's hot

Classification of Microarray Gene Expression Data by Gene Combinations using ...
Classification of Microarray Gene Expression Data by Gene Combinations using ...Classification of Microarray Gene Expression Data by Gene Combinations using ...
Classification of Microarray Gene Expression Data by Gene Combinations using ...IJCSEA Journal
 
Welcome to International Journal of Engineering Research and Development (IJERD)
Welcome to International Journal of Engineering Research and Development (IJERD)Welcome to International Journal of Engineering Research and Development (IJERD)
Welcome to International Journal of Engineering Research and Development (IJERD)IJERD Editor
 
Genetic Algorithm based Analysis of Rigid and Non Rigid Medical Images
Genetic Algorithm based Analysis of Rigid and Non Rigid Medical ImagesGenetic Algorithm based Analysis of Rigid and Non Rigid Medical Images
Genetic Algorithm based Analysis of Rigid and Non Rigid Medical ImagesIRJET Journal
 
MEDICAL IMAGING MUTIFRACTAL ANALYSIS IN PREDICTION OF EFFICIENCY OF CANCER TH...
MEDICAL IMAGING MUTIFRACTAL ANALYSIS IN PREDICTION OF EFFICIENCY OF CANCER TH...MEDICAL IMAGING MUTIFRACTAL ANALYSIS IN PREDICTION OF EFFICIENCY OF CANCER TH...
MEDICAL IMAGING MUTIFRACTAL ANALYSIS IN PREDICTION OF EFFICIENCY OF CANCER TH...csandit
 
IRJET- A Feature Selection Framework for DNA Methylation Analysis in Predicti...
IRJET- A Feature Selection Framework for DNA Methylation Analysis in Predicti...IRJET- A Feature Selection Framework for DNA Methylation Analysis in Predicti...
IRJET- A Feature Selection Framework for DNA Methylation Analysis in Predicti...IRJET Journal
 
Define cancer treatment using knn and naive bayes algorithms
Define cancer treatment using knn and naive bayes algorithmsDefine cancer treatment using knn and naive bayes algorithms
Define cancer treatment using knn and naive bayes algorithmsrajab ssemwogerere
 
EVOLVING EFFICIENT CLUSTERING AND CLASSIFICATION PATTERNS IN LYMPHOGRAPHY DAT...
EVOLVING EFFICIENT CLUSTERING AND CLASSIFICATION PATTERNS IN LYMPHOGRAPHY DAT...EVOLVING EFFICIENT CLUSTERING AND CLASSIFICATION PATTERNS IN LYMPHOGRAPHY DAT...
EVOLVING EFFICIENT CLUSTERING AND CLASSIFICATION PATTERNS IN LYMPHOGRAPHY DAT...ijsc
 
Filter Based Approach for Genomic Feature Set Selection (FBA-GFS)
Filter Based Approach for Genomic Feature Set Selection (FBA-GFS)Filter Based Approach for Genomic Feature Set Selection (FBA-GFS)
Filter Based Approach for Genomic Feature Set Selection (FBA-GFS)IJCSEA Journal
 
Diagnosis of Cancer using Fuzzy Rough Set Theory
Diagnosis of Cancer using Fuzzy Rough Set TheoryDiagnosis of Cancer using Fuzzy Rough Set Theory
Diagnosis of Cancer using Fuzzy Rough Set TheoryIRJET Journal
 
Multiple Features Based Two-stage Hybrid Classifier Ensembles for Subcellular...
Multiple Features Based Two-stage Hybrid Classifier Ensembles for Subcellular...Multiple Features Based Two-stage Hybrid Classifier Ensembles for Subcellular...
Multiple Features Based Two-stage Hybrid Classifier Ensembles for Subcellular...CSCJournals
 
Supervised machine learning based liver disease prediction approach with LASS...
Supervised machine learning based liver disease prediction approach with LASS...Supervised machine learning based liver disease prediction approach with LASS...
Supervised machine learning based liver disease prediction approach with LASS...journalBEEI
 
An Ensemble of Filters and Wrappers for Microarray Data Classification
An Ensemble of Filters and Wrappers for Microarray Data Classification An Ensemble of Filters and Wrappers for Microarray Data Classification
An Ensemble of Filters and Wrappers for Microarray Data Classification mlaij
 
Robust Breast Cancer Diagnosis on Four Different Datasets Using Multi-Classif...
Robust Breast Cancer Diagnosis on Four Different Datasets Using Multi-Classif...Robust Breast Cancer Diagnosis on Four Different Datasets Using Multi-Classif...
Robust Breast Cancer Diagnosis on Four Different Datasets Using Multi-Classif...ahmad abdelhafeez
 
Hybrid prediction model with missing value imputation for medical data 2015-g...
Hybrid prediction model with missing value imputation for medical data 2015-g...Hybrid prediction model with missing value imputation for medical data 2015-g...
Hybrid prediction model with missing value imputation for medical data 2015-g...Jitender Grover
 
Biological Significance of Gene Expression Data Using Similarity Based Biclus...
Biological Significance of Gene Expression Data Using Similarity Based Biclus...Biological Significance of Gene Expression Data Using Similarity Based Biclus...
Biological Significance of Gene Expression Data Using Similarity Based Biclus...CSCJournals
 

What's hot (17)

Classification of Microarray Gene Expression Data by Gene Combinations using ...
Classification of Microarray Gene Expression Data by Gene Combinations using ...Classification of Microarray Gene Expression Data by Gene Combinations using ...
Classification of Microarray Gene Expression Data by Gene Combinations using ...
 
Welcome to International Journal of Engineering Research and Development (IJERD)
Welcome to International Journal of Engineering Research and Development (IJERD)Welcome to International Journal of Engineering Research and Development (IJERD)
Welcome to International Journal of Engineering Research and Development (IJERD)
 
Genetic Algorithm based Analysis of Rigid and Non Rigid Medical Images
Genetic Algorithm based Analysis of Rigid and Non Rigid Medical ImagesGenetic Algorithm based Analysis of Rigid and Non Rigid Medical Images
Genetic Algorithm based Analysis of Rigid and Non Rigid Medical Images
 
MEDICAL IMAGING MUTIFRACTAL ANALYSIS IN PREDICTION OF EFFICIENCY OF CANCER TH...
MEDICAL IMAGING MUTIFRACTAL ANALYSIS IN PREDICTION OF EFFICIENCY OF CANCER TH...MEDICAL IMAGING MUTIFRACTAL ANALYSIS IN PREDICTION OF EFFICIENCY OF CANCER TH...
MEDICAL IMAGING MUTIFRACTAL ANALYSIS IN PREDICTION OF EFFICIENCY OF CANCER TH...
 
IRJET- A Feature Selection Framework for DNA Methylation Analysis in Predicti...
IRJET- A Feature Selection Framework for DNA Methylation Analysis in Predicti...IRJET- A Feature Selection Framework for DNA Methylation Analysis in Predicti...
IRJET- A Feature Selection Framework for DNA Methylation Analysis in Predicti...
 
Define cancer treatment using knn and naive bayes algorithms
Define cancer treatment using knn and naive bayes algorithmsDefine cancer treatment using knn and naive bayes algorithms
Define cancer treatment using knn and naive bayes algorithms
 
EVOLVING EFFICIENT CLUSTERING AND CLASSIFICATION PATTERNS IN LYMPHOGRAPHY DAT...
EVOLVING EFFICIENT CLUSTERING AND CLASSIFICATION PATTERNS IN LYMPHOGRAPHY DAT...EVOLVING EFFICIENT CLUSTERING AND CLASSIFICATION PATTERNS IN LYMPHOGRAPHY DAT...
EVOLVING EFFICIENT CLUSTERING AND CLASSIFICATION PATTERNS IN LYMPHOGRAPHY DAT...
 
Filter Based Approach for Genomic Feature Set Selection (FBA-GFS)
Filter Based Approach for Genomic Feature Set Selection (FBA-GFS)Filter Based Approach for Genomic Feature Set Selection (FBA-GFS)
Filter Based Approach for Genomic Feature Set Selection (FBA-GFS)
 
Diagnosis of Cancer using Fuzzy Rough Set Theory
Diagnosis of Cancer using Fuzzy Rough Set TheoryDiagnosis of Cancer using Fuzzy Rough Set Theory
Diagnosis of Cancer using Fuzzy Rough Set Theory
 
Multiple Features Based Two-stage Hybrid Classifier Ensembles for Subcellular...
Multiple Features Based Two-stage Hybrid Classifier Ensembles for Subcellular...Multiple Features Based Two-stage Hybrid Classifier Ensembles for Subcellular...
Multiple Features Based Two-stage Hybrid Classifier Ensembles for Subcellular...
 
Supervised machine learning based liver disease prediction approach with LASS...
Supervised machine learning based liver disease prediction approach with LASS...Supervised machine learning based liver disease prediction approach with LASS...
Supervised machine learning based liver disease prediction approach with LASS...
 
An Ensemble of Filters and Wrappers for Microarray Data Classification
An Ensemble of Filters and Wrappers for Microarray Data Classification An Ensemble of Filters and Wrappers for Microarray Data Classification
An Ensemble of Filters and Wrappers for Microarray Data Classification
 
Robust Breast Cancer Diagnosis on Four Different Datasets Using Multi-Classif...
Robust Breast Cancer Diagnosis on Four Different Datasets Using Multi-Classif...Robust Breast Cancer Diagnosis on Four Different Datasets Using Multi-Classif...
Robust Breast Cancer Diagnosis on Four Different Datasets Using Multi-Classif...
 
Hybrid prediction model with missing value imputation for medical data 2015-g...
Hybrid prediction model with missing value imputation for medical data 2015-g...Hybrid prediction model with missing value imputation for medical data 2015-g...
Hybrid prediction model with missing value imputation for medical data 2015-g...
 
B45020308
B45020308B45020308
B45020308
 
Biological Significance of Gene Expression Data Using Similarity Based Biclus...
Biological Significance of Gene Expression Data Using Similarity Based Biclus...Biological Significance of Gene Expression Data Using Similarity Based Biclus...
Biological Significance of Gene Expression Data Using Similarity Based Biclus...
 
Ijetcas14 327
Ijetcas14 327Ijetcas14 327
Ijetcas14 327
 

Similar to Comparing prediction accuracy for machine learning and

CSCI 6505 Machine Learning Project
CSCI 6505 Machine Learning ProjectCSCI 6505 Machine Learning Project
CSCI 6505 Machine Learning Projectbutest
 
Mining of Important Informative Genes and Classifier Construction for Cancer ...
Mining of Important Informative Genes and Classifier Construction for Cancer ...Mining of Important Informative Genes and Classifier Construction for Cancer ...
Mining of Important Informative Genes and Classifier Construction for Cancer ...ijsc
 
A Classification of Cancer Diagnostics based on Microarray Gene Expression Pr...
A Classification of Cancer Diagnostics based on Microarray Gene Expression Pr...A Classification of Cancer Diagnostics based on Microarray Gene Expression Pr...
A Classification of Cancer Diagnostics based on Microarray Gene Expression Pr...IJTET Journal
 
An Overview on Gene Expression Analysis
An Overview on Gene Expression AnalysisAn Overview on Gene Expression Analysis
An Overview on Gene Expression AnalysisIOSR Journals
 
A CLASSIFICATION MODEL ON TUMOR CANCER DISEASE BASED MUTUAL INFORMATION AND F...
A CLASSIFICATION MODEL ON TUMOR CANCER DISEASE BASED MUTUAL INFORMATION AND F...A CLASSIFICATION MODEL ON TUMOR CANCER DISEASE BASED MUTUAL INFORMATION AND F...
A CLASSIFICATION MODEL ON TUMOR CANCER DISEASE BASED MUTUAL INFORMATION AND F...Kiogyf
 
Innovative Technique for Gene Selection in Microarray Based on Recursive Clus...
Innovative Technique for Gene Selection in Microarray Based on Recursive Clus...Innovative Technique for Gene Selection in Microarray Based on Recursive Clus...
Innovative Technique for Gene Selection in Microarray Based on Recursive Clus...AM Publications
 
An ensemble deep learning classifier of entropy convolutional neural network ...
An ensemble deep learning classifier of entropy convolutional neural network ...An ensemble deep learning classifier of entropy convolutional neural network ...
An ensemble deep learning classifier of entropy convolutional neural network ...BASMAJUMAASALEHALMOH
 
Survey and Evaluation of Methods for Tissue Classification
Survey and Evaluation of Methods for Tissue ClassificationSurvey and Evaluation of Methods for Tissue Classification
Survey and Evaluation of Methods for Tissue Classificationperfj
 
Reconstruction and analysis of cancerspecific Gene regulatory networks from G...
Reconstruction and analysis of cancerspecific Gene regulatory networks from G...Reconstruction and analysis of cancerspecific Gene regulatory networks from G...
Reconstruction and analysis of cancerspecific Gene regulatory networks from G...ijbbjournal
 
ENHANCED BREAST CANCER RECOGNITION BASED ON ROTATION FOREST FEATURE SELECTIO...
 ENHANCED BREAST CANCER RECOGNITION BASED ON ROTATION FOREST FEATURE SELECTIO... ENHANCED BREAST CANCER RECOGNITION BASED ON ROTATION FOREST FEATURE SELECTIO...
ENHANCED BREAST CANCER RECOGNITION BASED ON ROTATION FOREST FEATURE SELECTIO...cscpconf
 
Visual Exploration of Clinical and Genomic Data for Patient Stratification
Visual Exploration of Clinical and Genomic Data for Patient StratificationVisual Exploration of Clinical and Genomic Data for Patient Stratification
Visual Exploration of Clinical and Genomic Data for Patient StratificationNils Gehlenborg
 
Evolving Efficient Clustering and Classification Patterns in Lymphography Dat...
Evolving Efficient Clustering and Classification Patterns in Lymphography Dat...Evolving Efficient Clustering and Classification Patterns in Lymphography Dat...
Evolving Efficient Clustering and Classification Patterns in Lymphography Dat...ijsc
 
Efficiency of Using Sequence Discovery for Polymorphism in DNA Sequence
Efficiency of Using Sequence Discovery for Polymorphism in DNA SequenceEfficiency of Using Sequence Discovery for Polymorphism in DNA Sequence
Efficiency of Using Sequence Discovery for Polymorphism in DNA SequenceIJSTA
 
coad_machine_learning
coad_machine_learningcoad_machine_learning
coad_machine_learningFord Sleeman
 
Developing a framework for for detection of low frequency somatic genetic alt...
Developing a framework for for detection of low frequency somatic genetic alt...Developing a framework for for detection of low frequency somatic genetic alt...
Developing a framework for for detection of low frequency somatic genetic alt...Ronak Shah
 
Impact of Classification Algorithms on Cardiotocography Dataset for Fetal Sta...
Impact of Classification Algorithms on Cardiotocography Dataset for Fetal Sta...Impact of Classification Algorithms on Cardiotocography Dataset for Fetal Sta...
Impact of Classification Algorithms on Cardiotocography Dataset for Fetal Sta...BRNSSPublicationHubI
 
Effect of Feature Selection on Gene Expression Datasets Classification Accura...
Effect of Feature Selection on Gene Expression Datasets Classification Accura...Effect of Feature Selection on Gene Expression Datasets Classification Accura...
Effect of Feature Selection on Gene Expression Datasets Classification Accura...IJECEIAES
 

Similar to Comparing prediction accuracy for machine learning and (20)

CSCI 6505 Machine Learning Project
CSCI 6505 Machine Learning ProjectCSCI 6505 Machine Learning Project
CSCI 6505 Machine Learning Project
 
Mining of Important Informative Genes and Classifier Construction for Cancer ...
Mining of Important Informative Genes and Classifier Construction for Cancer ...Mining of Important Informative Genes and Classifier Construction for Cancer ...
Mining of Important Informative Genes and Classifier Construction for Cancer ...
 
A Classification of Cancer Diagnostics based on Microarray Gene Expression Pr...
A Classification of Cancer Diagnostics based on Microarray Gene Expression Pr...A Classification of Cancer Diagnostics based on Microarray Gene Expression Pr...
A Classification of Cancer Diagnostics based on Microarray Gene Expression Pr...
 
An Overview on Gene Expression Analysis
An Overview on Gene Expression AnalysisAn Overview on Gene Expression Analysis
An Overview on Gene Expression Analysis
 
A CLASSIFICATION MODEL ON TUMOR CANCER DISEASE BASED MUTUAL INFORMATION AND F...
A CLASSIFICATION MODEL ON TUMOR CANCER DISEASE BASED MUTUAL INFORMATION AND F...A CLASSIFICATION MODEL ON TUMOR CANCER DISEASE BASED MUTUAL INFORMATION AND F...
A CLASSIFICATION MODEL ON TUMOR CANCER DISEASE BASED MUTUAL INFORMATION AND F...
 
Innovative Technique for Gene Selection in Microarray Based on Recursive Clus...
Innovative Technique for Gene Selection in Microarray Based on Recursive Clus...Innovative Technique for Gene Selection in Microarray Based on Recursive Clus...
Innovative Technique for Gene Selection in Microarray Based on Recursive Clus...
 
Msc Thesis - Presentation
Msc Thesis - PresentationMsc Thesis - Presentation
Msc Thesis - Presentation
 
Data preprocessing
Data preprocessingData preprocessing
Data preprocessing
 
An ensemble deep learning classifier of entropy convolutional neural network ...
An ensemble deep learning classifier of entropy convolutional neural network ...An ensemble deep learning classifier of entropy convolutional neural network ...
An ensemble deep learning classifier of entropy convolutional neural network ...
 
Survey and Evaluation of Methods for Tissue Classification
Survey and Evaluation of Methods for Tissue ClassificationSurvey and Evaluation of Methods for Tissue Classification
Survey and Evaluation of Methods for Tissue Classification
 
Comparison of breast cancer classification models on Wisconsin dataset
Comparison of breast cancer classification models on Wisconsin  datasetComparison of breast cancer classification models on Wisconsin  dataset
Comparison of breast cancer classification models on Wisconsin dataset
 
Reconstruction and analysis of cancerspecific Gene regulatory networks from G...
Reconstruction and analysis of cancerspecific Gene regulatory networks from G...Reconstruction and analysis of cancerspecific Gene regulatory networks from G...
Reconstruction and analysis of cancerspecific Gene regulatory networks from G...
 
ENHANCED BREAST CANCER RECOGNITION BASED ON ROTATION FOREST FEATURE SELECTIO...
 ENHANCED BREAST CANCER RECOGNITION BASED ON ROTATION FOREST FEATURE SELECTIO... ENHANCED BREAST CANCER RECOGNITION BASED ON ROTATION FOREST FEATURE SELECTIO...
ENHANCED BREAST CANCER RECOGNITION BASED ON ROTATION FOREST FEATURE SELECTIO...
 
Visual Exploration of Clinical and Genomic Data for Patient Stratification
Visual Exploration of Clinical and Genomic Data for Patient StratificationVisual Exploration of Clinical and Genomic Data for Patient Stratification
Visual Exploration of Clinical and Genomic Data for Patient Stratification
 
Evolving Efficient Clustering and Classification Patterns in Lymphography Dat...
Evolving Efficient Clustering and Classification Patterns in Lymphography Dat...Evolving Efficient Clustering and Classification Patterns in Lymphography Dat...
Evolving Efficient Clustering and Classification Patterns in Lymphography Dat...
 
Efficiency of Using Sequence Discovery for Polymorphism in DNA Sequence
Efficiency of Using Sequence Discovery for Polymorphism in DNA SequenceEfficiency of Using Sequence Discovery for Polymorphism in DNA Sequence
Efficiency of Using Sequence Discovery for Polymorphism in DNA Sequence
 
coad_machine_learning
coad_machine_learningcoad_machine_learning
coad_machine_learning
 
Developing a framework for for detection of low frequency somatic genetic alt...
Developing a framework for for detection of low frequency somatic genetic alt...Developing a framework for for detection of low frequency somatic genetic alt...
Developing a framework for for detection of low frequency somatic genetic alt...
 
Impact of Classification Algorithms on Cardiotocography Dataset for Fetal Sta...
Impact of Classification Algorithms on Cardiotocography Dataset for Fetal Sta...Impact of Classification Algorithms on Cardiotocography Dataset for Fetal Sta...
Impact of Classification Algorithms on Cardiotocography Dataset for Fetal Sta...
 
Effect of Feature Selection on Gene Expression Datasets Classification Accura...
Effect of Feature Selection on Gene Expression Datasets Classification Accura...Effect of Feature Selection on Gene Expression Datasets Classification Accura...
Effect of Feature Selection on Gene Expression Datasets Classification Accura...
 

More from Alexander Decker

Abnormalities of hormones and inflammatory cytokines in women affected with p...
Abnormalities of hormones and inflammatory cytokines in women affected with p...Abnormalities of hormones and inflammatory cytokines in women affected with p...
Abnormalities of hormones and inflammatory cytokines in women affected with p...Alexander Decker
 
A validation of the adverse childhood experiences scale in
A validation of the adverse childhood experiences scale inA validation of the adverse childhood experiences scale in
A validation of the adverse childhood experiences scale inAlexander Decker
 
A usability evaluation framework for b2 c e commerce websites
A usability evaluation framework for b2 c e commerce websitesA usability evaluation framework for b2 c e commerce websites
A usability evaluation framework for b2 c e commerce websitesAlexander Decker
 
A universal model for managing the marketing executives in nigerian banks
A universal model for managing the marketing executives in nigerian banksA universal model for managing the marketing executives in nigerian banks
A universal model for managing the marketing executives in nigerian banksAlexander Decker
 
A unique common fixed point theorems in generalized d
A unique common fixed point theorems in generalized dA unique common fixed point theorems in generalized d
A unique common fixed point theorems in generalized dAlexander Decker
 
A trends of salmonella and antibiotic resistance
A trends of salmonella and antibiotic resistanceA trends of salmonella and antibiotic resistance
A trends of salmonella and antibiotic resistanceAlexander Decker
 
A transformational generative approach towards understanding al-istifham
A transformational  generative approach towards understanding al-istifhamA transformational  generative approach towards understanding al-istifham
A transformational generative approach towards understanding al-istifhamAlexander Decker
 
A time series analysis of the determinants of savings in namibia
A time series analysis of the determinants of savings in namibiaA time series analysis of the determinants of savings in namibia
A time series analysis of the determinants of savings in namibiaAlexander Decker
 
A therapy for physical and mental fitness of school children
A therapy for physical and mental fitness of school childrenA therapy for physical and mental fitness of school children
A therapy for physical and mental fitness of school childrenAlexander Decker
 
A theory of efficiency for managing the marketing executives in nigerian banks
A theory of efficiency for managing the marketing executives in nigerian banksA theory of efficiency for managing the marketing executives in nigerian banks
A theory of efficiency for managing the marketing executives in nigerian banksAlexander Decker
 
A systematic evaluation of link budget for
A systematic evaluation of link budget forA systematic evaluation of link budget for
A systematic evaluation of link budget forAlexander Decker
 
A synthetic review of contraceptive supplies in punjab
A synthetic review of contraceptive supplies in punjabA synthetic review of contraceptive supplies in punjab
A synthetic review of contraceptive supplies in punjabAlexander Decker
 
A synthesis of taylor’s and fayol’s management approaches for managing market...
A synthesis of taylor’s and fayol’s management approaches for managing market...A synthesis of taylor’s and fayol’s management approaches for managing market...
A synthesis of taylor’s and fayol’s management approaches for managing market...Alexander Decker
 
A survey paper on sequence pattern mining with incremental
A survey paper on sequence pattern mining with incrementalA survey paper on sequence pattern mining with incremental
A survey paper on sequence pattern mining with incrementalAlexander Decker
 
A survey on live virtual machine migrations and its techniques
A survey on live virtual machine migrations and its techniquesA survey on live virtual machine migrations and its techniques
A survey on live virtual machine migrations and its techniquesAlexander Decker
 
A survey on data mining and analysis in hadoop and mongo db
A survey on data mining and analysis in hadoop and mongo dbA survey on data mining and analysis in hadoop and mongo db
A survey on data mining and analysis in hadoop and mongo dbAlexander Decker
 
A survey on challenges to the media cloud
A survey on challenges to the media cloudA survey on challenges to the media cloud
A survey on challenges to the media cloudAlexander Decker
 
A survey of provenance leveraged
A survey of provenance leveragedA survey of provenance leveraged
A survey of provenance leveragedAlexander Decker
 
A survey of private equity investments in kenya
A survey of private equity investments in kenyaA survey of private equity investments in kenya
A survey of private equity investments in kenyaAlexander Decker
 
A study to measures the financial health of
A study to measures the financial health ofA study to measures the financial health of
A study to measures the financial health ofAlexander Decker
 

More from Alexander Decker (20)

Abnormalities of hormones and inflammatory cytokines in women affected with p...
Abnormalities of hormones and inflammatory cytokines in women affected with p...Abnormalities of hormones and inflammatory cytokines in women affected with p...
Abnormalities of hormones and inflammatory cytokines in women affected with p...
 
A validation of the adverse childhood experiences scale in
A validation of the adverse childhood experiences scale inA validation of the adverse childhood experiences scale in
A validation of the adverse childhood experiences scale in
 
A usability evaluation framework for b2 c e commerce websites
A usability evaluation framework for b2 c e commerce websitesA usability evaluation framework for b2 c e commerce websites
A usability evaluation framework for b2 c e commerce websites
 
A universal model for managing the marketing executives in nigerian banks
A universal model for managing the marketing executives in nigerian banksA universal model for managing the marketing executives in nigerian banks
A universal model for managing the marketing executives in nigerian banks
 
A unique common fixed point theorems in generalized d
A unique common fixed point theorems in generalized dA unique common fixed point theorems in generalized d
A unique common fixed point theorems in generalized d
 
A trends of salmonella and antibiotic resistance
A trends of salmonella and antibiotic resistanceA trends of salmonella and antibiotic resistance
A trends of salmonella and antibiotic resistance
 
A transformational generative approach towards understanding al-istifham
A transformational  generative approach towards understanding al-istifhamA transformational  generative approach towards understanding al-istifham
A transformational generative approach towards understanding al-istifham
 
A time series analysis of the determinants of savings in namibia
A time series analysis of the determinants of savings in namibiaA time series analysis of the determinants of savings in namibia
A time series analysis of the determinants of savings in namibia
 
A therapy for physical and mental fitness of school children
A therapy for physical and mental fitness of school childrenA therapy for physical and mental fitness of school children
A therapy for physical and mental fitness of school children
 
A theory of efficiency for managing the marketing executives in nigerian banks
A theory of efficiency for managing the marketing executives in nigerian banksA theory of efficiency for managing the marketing executives in nigerian banks
A theory of efficiency for managing the marketing executives in nigerian banks
 
A systematic evaluation of link budget for
A systematic evaluation of link budget forA systematic evaluation of link budget for
A systematic evaluation of link budget for
 
A synthetic review of contraceptive supplies in punjab
A synthetic review of contraceptive supplies in punjabA synthetic review of contraceptive supplies in punjab
A synthetic review of contraceptive supplies in punjab
 
A synthesis of taylor’s and fayol’s management approaches for managing market...
A synthesis of taylor’s and fayol’s management approaches for managing market...A synthesis of taylor’s and fayol’s management approaches for managing market...
A synthesis of taylor’s and fayol’s management approaches for managing market...
 
A survey paper on sequence pattern mining with incremental
A survey paper on sequence pattern mining with incrementalA survey paper on sequence pattern mining with incremental
A survey paper on sequence pattern mining with incremental
 
A survey on live virtual machine migrations and its techniques
A survey on live virtual machine migrations and its techniquesA survey on live virtual machine migrations and its techniques
A survey on live virtual machine migrations and its techniques
 
A survey on data mining and analysis in hadoop and mongo db
A survey on data mining and analysis in hadoop and mongo dbA survey on data mining and analysis in hadoop and mongo db
A survey on data mining and analysis in hadoop and mongo db
 
A survey on challenges to the media cloud
A survey on challenges to the media cloudA survey on challenges to the media cloud
A survey on challenges to the media cloud
 
A survey of provenance leveraged
A survey of provenance leveragedA survey of provenance leveraged
A survey of provenance leveraged
 
A survey of private equity investments in kenya
A survey of private equity investments in kenyaA survey of private equity investments in kenya
A survey of private equity investments in kenya
 
A study to measures the financial health of
A study to measures the financial health ofA study to measures the financial health of
A study to measures the financial health of
 

Comparing prediction accuracy for machine learning and

  • 1. Computer Engineering and Intelligent Systems www.iiste.org ISSN 2222-1719 (Paper) ISSN 2222-2863 (Online) Vol.5, No.10, 2014 1 Comparing Prediction Accuracy for Machine Learning and Other Classical Approaches in Gene Expression Data Setu Chandra Kar B.Sc. (Honors) and M. S. Department of Statistics, Shahjalal University of Science & Technology Sylhet-3114, Bangladesh Email: setu_kar@yahoo.com Abstract Microarray based gene expression profiling has been emerged as an efficient technique for cancer classification, as well as for diagnosis, prognosis, and treatment purposes. The classification of different tumor types is of great significance in cancer diagnosis and drug innovation. Using a large number of genes to classify samples based on a small number of microarrays remains a difficult problem. Feature selection techniques can be used to extract the marker genes which influence the classification accuracy effectively by eliminating the unwanted noisy and redundant genes. Quite a number of methods have been proposed in recent years with promising results. But there are still a lot of issues which need to be addressed and understood. Diagonal discriminant analysis, regularized discriminant analysis, support vector machines and k-nearest neighbor have been suggested as among the best methods for small sample size situations. In this paper, we have compared the performance of different discrimination methods for the classification of tumors based on gene expression data. The methods are applied to datasets from four recently published cancer gene expression studies. The performance of the classification technique has been evaluated for varying number of selected features in terms of misclassification rate using hold-out cross validation. Our study shows that KNN, RDA and SVM with linear kernel methods have lower misclassification rate than the other algorithms. Keywords: microarray, gene expression, KNN, DLDA, RDA, SVM 1 Introduction and objectives: Conventional methods of monitoring and diagnosing cancer rely on a human observer to detect certain features. Cancer diagnosis is usually achieved using an imaging system, such as X-ray, Magnetic Resonance Imaging (MRI), Computed Tomography (CT), and ultrasonography. Microarray technology is a new tool that can automate the diagnostic task and improve the accuracy of the traditional diagnostic techniques (Sarhan, 2009). The classification of DNA micro array data allows the discovery of hidden patterns in expression profiles and opens possibility for accurate cancer classification which has great value in providing better treatment and toxicity minimization on the patients. The gene expression profiles that are obtained from particular microarray experiments have been widely used for differentiating normal or different cancerous states by using selected informative genes (Chuang, 2011). However, studying microarray dataset brings about some complexity due to the huge number of features that contribute to a profile as compared to the very low number of samples. Another challenge is the presence of biological or technical noise in the dataset, which further affects the accuracy of the experimental results. In practice, it has been observed that a large number of features may degrade the performance of classifiers if the number of training samples is small relative to the number of features (Jain, 2000). There are two main procedures in gene expression data classification task: feature selection and classification. Several gene selection methods have been developed to select these predictive genes, such as t- statistics, information gain, towing rule, the ratio of between-groups to within-groups sum of squares (BSS/WSS), Principal Component Analysis (PCA), and Genetic Algorithm (GA). Different classification methods from statistical and machine learning area have been applied to cancer classification such as Fisher Linear Discrimination Analysis (FLDA), Diagonal Discriminant Analysis (DLDA), Regularized Discriminant Analysis (RLDA), Maximum Likelihood Discriminant Rules, Classification Tree, Support Vector Machine (SVM), K-Nearest Neighbor (KNN), and the aggregating classifiers. Following are the objectives of our study:  To examine the classification performance of the selected supervised algorithms using delete-d method;  To reveal the effect of gene selection on different classification methods. 2 Theoretical backgrounds: 2.1 KNN: KNN is a distance-based approach for classification. In order to classify an observation X in the test set, KNN takes the following steps: (i) select an integer K (i.e., by cross-validation) and find the K closest observations in the training set; (ii) classify the observation by majority vote, that is, choose the class that is most
  • 2. Computer Engineering and Intelligent Systems www.iiste.org ISSN 2222-1719 (Paper) ISSN 2222-2863 (Online) Vol.5, No.10, 2014 2 common among those K neighbors (Dudoit et al., 2002; Speed, 2003). The KNN method is the simplest, yet useful approach to general pattern classification. Its error rate has been proven to be asymptotically at most twice that of the Bayesian error rate (R.O. Duda, 2002). However, its performance deteriorates dramatically when the input data set has a relatively low local relevance (J.H. Friedman, 1994). 2.2 DLDA: Diagonal Linear Discriminant Analysis (Dudoit, 2002) is a simplification of classical LDA, which applies the common diagonal covariance matrix to all classes. It is computationally more efficient than other LDA-based algorithms. Interestingly, the “weighted voting scheme” for binary classification proposed by T.R.Golub (1999) can be shown to be a variant of DLDA. 2.3 RDA: Classical Linear Discriminant Analysis (LDA) is not applicable for small sample size problems due to the singularity of the scatter matrices involved. Regularized LDA (RLDA) provides a simple strategy to overcome the singularity problem by applying a regularization term, which is commonly estimated via cross- validation from a set of candidates (Ye, J., 2006). RDA is better able to extract the relevant discriminatory information from training data than the other classifiers tested, thus obtaining a lower error rate (Pima & Aladjem, 2004). The RDA combines strengths of linear discriminant analysis (LDA) and quadratic discriminant analysis (QDA). It solves the small sample size and ill-posed problems suffered from QDA and LDA through a regularization technique (Lee et al., 2010). 2.4 SVM: The SVM has been shown to give superb performance in binary classification tasks. Intuitively, SVM aims at searching for a hyperplane that separates the two classes of data with largest margin which is the distance between the hyperplane and the point closest to it). For multiclass SVM, there are many decomposition techniques that can adapt SVM to identify non-binary class divisions such as one-versus-the rest, pair wise comparison, and error-correcting output coding. SVM was used by Park and Cho (2003) and Li et al. (2004). 3 Microarray Datasets Four publicly available microarray data sets are used for this study, with sample sizes ranging from 38 to 102 and numbers of genes ranging from 2,308 to 6033. Gene expression values for all the datasets are available from the Bioconductor libraries. A. Leukemia: This dataset contains gene expression (3051 genes and 38 tumor mRNA samples) levels of n =38 patients either suffering from acute lymphoblastic leukemia (ALL, 27 cases) or acute myeloid leukemia (AML, 11 cases) where ALL and AML classes are coded in 1 and 2 respectively. It was obtained from Affymetrix oligonucleotide microarrays. Following the protocol in Dudoit et al. (2002), it was preprocessed by thresholding, filtering, a logarithmic transformation and standardization, so that the data finally comprise the expression values of p=3051 genes. The data are described in Golub et al. (1999) and can be freely downloaded from http://www- genome.wi.mit.edu/MPR/. B. Lymphoma: The lymphoma dataset consists of 42 samples of diffuse large B-cell lymphoma (DLBCL), 9 samples of follicular lymphoma (FL), and 11 samples of chronic lymphocytic leukemia (CLL). DBLCL, FL, and CLL classes are coded in 1, 2, and 3, respectively. The total sample size is n=62, and the expression of p =4026 well-measured genes, preferentially expressed in lymphoid cells or with known immunological or oncological importance is documented. Matrix of gene expression data and arrays were normalized, imputed, log transformed, and standardized to zero mean and unit variance across genes as described in Dettling (2004) and Dettling and Beuhlmann (2002). More information on these data can be found in Alizadeh et al. (2000) and can be freely downloaded from http://llmpp.nih.gov/lymphoma C. SRBCT: This gene expression data (2308 genes for 83 samples) obtained from the microarray experiments of Small Round Blue Cell Tumors (SRBCT) of childhood cancer study. This data set contains 83 samples with 2308 genes: 29 cases of Ewing sarcoma (EWS), 11 cases of Burkitt lymphoma (BL), 18 cases of neuroblastoma (NB), 25 cases of rhabdomyosarcoma (RMS). A total of 63 training samples and 25 test samples are provided in Khan et al. (2001) and was obtained from cDNA microarrays. Five of the test set are non-SRBCT and are not considered here. The training sample indexes correspond to 1to 65 and the test sample indexes (without non- SRBCT sample) correspond to 66 to 83. Each tissue sample is associated with a thoroughly preprocessed expression profile of p= 2,308 genes, already standardized to zero mean and unit variance across genes. Data can be freely downloaded from http://www.thep.lu.se/pub/Preprints/01/lu_tp_01_06_supp.html. D. Prostate: The prostate dataset consists of 52 prostate tumor and 50 normal samples and obtained using the Affymetrix technology. Normal and tumor classes are coded in 1 and 2, respectively. Matrix of gene expression data and arrays were normalized, log transformed, and standardized to zero mean and unit variance across genes as described in Dettling (2004) and Dettling and Beuhlmann (2002). More information on these data can be found in Chung and Keles (2010) and can be freely downloaded from http://www-genome.wi.mit.edu/cancer.
  • 3. Computer Engineering and Intelligent Systems www.iiste.org ISSN 2222-1719 (Paper) ISSN 2222-2863 (Online) Vol.5, No.10, 2014 3 4 Experimental Results and Discussions: For the classification job, we have started with the gene expression values existing for cancer disease samples obtained from the DNA microarray experiments. For identifying genes responsible for the classification of different tumor types, the available dataset were divided into two groups: one used for the training purpose and the other used for the testing purpose. The training set of data is utilized for learning the parameters of the classifier, while the test set of data is utilized to measure the misclassification rate. The essential idea of hold-out cross validation is to split the sample data into separate train and test datasets (Webb, 2002). The classifier is trained on the training set, and its performance is estimated by applying it to the test set. The selection of the train and test sets is done randomly, and the selected proportions are usually 70% for training and 30% for testing. The major disadvantage of this procedure is that the classifier is unable of making use of all data for training; however, if the sample size is large enough this could be accommodated. (Jain et al., 2000). 4.1 Results: To study the impact of the selected gene number on the four classification algorithms, we compare their performances when different numbers of genes are used in the classification. For each data set, experiments are carried out with feature size 50, 200, 500, 1000 and full dataset. We choose the most discriminatory genes according to t-test (two groups) and ANOVA (more than two groups).To reduce the variability each experiment is repeated 500 times, and the average test error rates and their standard variances over the 500 experiments are reported. We now present our experimental results for the four classifiers (KNN, SVM, DLDA, and RDA) with four data sets. Number selected of genes=50 Method/ Dataset Leukemia Lymphoma SRBCT Prostate KNN 0.082(0.062) 0.353(0.056) 0.284(0.092) 0.165(0.059) DLDA 0.098(0.085) 0.551(0.093) 0.459(0.096) 0.267(0.091) RDA 0.093(0.080) 0.277(0.062) 0.415(0.083) 0.080(0.041) Kernels for SVM Linear 0.063(0.066) 0.447(0.099) 0.333(0.086) 0.109(0.044) Polynomial 0.299(0.036) 0.328(0.015) 0.545(0.059) 0.375(0.073) Radial 0.115(0.067) 0.297(0.030) 0.353(0.063) 0.098(0.041) Sigmoid 0.071(0.061) 0.249(0.038) 0.369(0.060) 0.104(0.052) Table 4.1: The average misclassification rates(%) and standard deviation based on 500 random partitions into training sets and test set by using delete-d method (where d=0.33) for 50 top ranked genes. Number selected of genes=200 Method/ Dataset Leukemia Lymphoma SRBCT Prostate KNN 0.014(0.034) 0.333(0.00) 0.276(0.080) 0.232(0.068) DLDA 0.005(0.021) 0.584(0.088) 0.377(0.097) 0.351(0.071) RDA 0.070(0.085) 0.261(0.061) 0.209(0.100) 0.065(0.042) Kernels for SVM Linear 0.002(0.013) 0.517(0.099) 0.266(0.084) 0.089(0.038) Polynomial 0.283(0.044) 0.332(0.005) 0.597(0.044) 0.399(0.061) Radial 0.073(0.063) 0.281(0.033) 0.326(0.064) 0.119(0.055) Sigmoid 0.002(0.014) 0.233(0.033) 0.334(0.064) 0.175(0.060) Table 4.2: The average misclassification rates(%) and standard deviation based on 500 random partitions into training sets and test set by using delete-d method (where d=0.33) for 200 top ranked genes. Number selected of genes=500 Method/ Dataset Leukemia Lymphoma SRBCT Prostate KNN 0.003(0.016) 0.334(0.007) 0.212(0.081) 0.226(0.071) DLDA 0.006(0.021) 0.556(0.091) 0.339(0.094) 0.355(0.089) RDA 0.071(0.086) 0.257(0.065) 0.202(0.089) 0.072(0.043) Kernels for SVM Linear 0.004(0.017) 0.453(0.101) 0.217(0.079) 0.066(0.036) Polynomial 0.277(0.043) 0.333(0.000) 0.593(0.042) 0.285(0.091) Radial 0.086(0.073) 0.265(0.040) 0.324(0.055) 0.132(0.057) Sigmoid 0.004(0.016) 0.231(0.033) 0.282(0.059) 0.204(0.066)
  • 4. Computer Engineering and Intelligent Systems www.iiste.org ISSN 2222-1719 (Paper) ISSN 2222-2863 (Online) Vol.5, No.10, 2014 4 Table 4.3: The average misclassification rates(%) and standard deviation based on 500 random partitions into training sets and test set by using delete-d method (where d=0.33) for 500 top ranked genes. Number selected of genes=1000 Method/ Dataset Leukemia Lymphoma SRBCT Prostate KNN 0.003(0.014) 0.335(0.020) 0.210(0.089) 0.197(0.066) DLDA 0.013(0.030) 0.336(0.103) 0.265(0.096) 0.339(0.095) RDA 0.066(0.077) 0.184(0.075) 0.120(0.082) 0.072(0.040) Kernels for SVM Linear 0.003(0.015) 0.165(0.075) 0.138(0.070) 0.060(0.034) Polynomial 0.281(0.040) 0.333(0.000) 0.603(0.041) 0.230(0.096) Radial 0.070(0.058) 0.231(0.047) 0.315(0.058) 0.115(0.052) Sigmoid 0.006(0.020) 0.217(0.033) 0.225(0.054) 0.215(0.068) Table 4.4: The average misclassification rates(%) and standard deviation based on 500 random partitions into training sets and test set by using delete-d method (where d=0.33) for 1000 top ranked genes. Number of selected genes= full dataset Method/ Dataset Leukemia Lymphoma SRBCT Prostate KNN 0.025(0.042) 0.024(0.030) 0.079(0.059) 0.186(0.063) DLDA 0.028(0.042) 0.017(.023) 0.075(0.058) 0.376(0.099) RDA 0.075(0.083) 0.034(0.048) 0.032(0.039) 0.045(.048) Kernels for SVM Linear 0.008(0.025) 0.004(0.013) 0.033(0.036) 0.095(0.041) Polynomial 0.307(0.005) 0.132(0.043) 0.528(0.103) 0.369 (0.063) Radial 0.268(0.053) 0.029(0.036) 0.151(0.074) 0.129(0.057) Sigmoid 0.014(0.031) 0.005(0.015) 0.050(0.045) 0.140(0.063) Table 4.5: The average misclassification rates(%) and standard deviation based on 500 random partitions into training sets and test set by using delete-d method (where d=0.33) for full dataset. Figure 4.1: Boxplots of error rates on four datasets for 50 top ranked genes. Figure 4.2: Boxplots of error rates on four datasets for 200 top ranked genes.
  • 5. Computer Engineering and Intelligent Systems www.iiste.org ISSN 2222-1719 (Paper) ISSN 2222-2863 (Online) Vol.5, No.10, 2014 5 Figure 4.3: Boxplots of error rates on four datasets for 500 top ranked genes. Figure 4.4: Boxplots of error rates on four datasets for 1000 top ranked genes. 4.2 Discussions: Table 4.1 & Figure 4.1 reveals that, although data points are less disperse for SVM with sigmoid kernel and KNN than SVM with linear kernel but on an average it is better to choose linear (6.3%) kernel because it has lower average misclassification rate than the other classifiers. For lymphoma data, SVM with sigmoid (24.1%) kernel gives the best performance. For SRBCT data, KNN (28.4%) obtains the lowest average misclassification rates and for prostate data, RDA (8.0%) achieves the lowest average misclassification rate among all the classifiers We see from Table 4.2 and Figure 4.2, on an average it is better to choose SVM with linear (0.2%) kernel function for leukemia data because it achieves the lowest misclassification rate with minimum standard deviation. For lymphoma data, it is observed that SVM with sigmoid kernel function achieves the lowest misclassification rate 23.3%. With SRBCT & prostate data RDA obtains lower average misclassification rate than the other classifiers i.e. 20.9% & 6.5%, respectively. In Table 4.3 and Figure 4.3, on an average it is better to select KNN (0.3%) which obtains the lowest average misclassification rate. For lymphoma data, SVM with sigmoid (23.1%) kernel function & for SRBCT data RDA (20.2%) yield better result than the others techniques. SVM with linear (6.6%) kernel function achieves the lowest average misclassification rate with minimum standard deviation for prostate data. In Table 4.4 and Figure 4.4, on an average it is better to use KNN (0.3%) & SVM with linear (0.3%) kernel because they obtain the lowest average misclassification rate. For lymphoma & prostate data SVM with linear kernel functions achieves smaller misclassification rate than others i.e. 16.5% & 6%, respectively. With 1000 top genes RDA (12%) achieves the lowest misclassification rate for SRBCT data. Table 4.5 represents the average misclassification rate & standard deviation. Figure 4.5 shows the illustration of these results for full datasets. For leukemia & lymphoma datasets, on an average SVM with linear kernel gives Figure 4.5: Boxplots of error rates on four datasets for full dataset.
  • 6. Computer Engineering and Intelligent Systems www.iiste.org ISSN 2222-1719 (Paper) ISSN 2222-2863 (Online) Vol.5, No.10, 2014 6 the lowest misclassification rate 0.8% & 0.4%, respectively. For SRBCT & prostate data, RDA achieves the lowest misclassification rate i. e. 3.2% & 4.5%, respectively. The aim of our exertion was the comparative evaluation of four most used statistical analyses (nearest-neighbor, diagonalized linear discriminant analysis, regularized discriminant analysis & support vector machine with different kernel functions )by testing them on published datasets and measuring their misclassification rate given by hold-out cross validation. Now we briefly addressed the effects of variable selection on the relative performance of the classifiers. Figure 5.5: Misclassification trend of the selected statistical technologies on leukemia, lymphoma, SRBCT and prostate gene expression dataset. We have observed that all the classifiers show stable results except SVM with polynomial & radial kernel for leukemia data. But for lymphoma and SRBCT data, almost all the selected techniques express different misclassification rates at different numbers of genes. In prostate data, on the contrary, all the chosen statistical algorithms perform better i.e. more or less stable results except SVM with polynomial kernel. Here, KNN (0.2%) technique reaches its minimum value of misclassification with a selection of top 1000 genes among four datasets. DLDA (0.5%) algorithm gains its minimum value of misclassification with a selection top 200 features among four datasets. RDA (3.2%) technique achieves the lowest misclassification with a selection of more than 2000 genes among four datasets. SVM with linear (0.2%) & sigmoid (0.2%) kernel functions reaches their minimum value of misclassification with a selection of top 200 features. On the other hand, radial (2.9%) & polynomial (13.2%) kernel functions reach their minimum value of misclassification (2.9%) with a selection of more than 4000 features among four datasets.
  • 7. Computer Engineering and Intelligent Systems www.iiste.org ISSN 2222-1719 (Paper) ISSN 2222-2863 (Online) Vol.5, No.10, 2014 7 5 Conclusions: In this paper, we have shown the comparative results of SVM using different kernels, KNN, DLDA and RDA on four different datasets. Here, we have attempted to explore the best choice among KNN, DLDA, RDA and SVM with different kernel functions. The selected kernels are linear, polynomial, radial basis function (RBF) and sigmoid kernels. Then, focusing on feature selection, we have compared the classification techniques for varying number of selected features and explore the most suitable method in each situation. For different number of informative genes, we have found that KNN, RDA and SVM with linear kernel function achieve the lowest misclassification rate most of the cases. Sometimes other algorithms have provided the lowest misclassification rate. The misclassification rate of the methods has fluctuated when different numbers of informative genes were used. Through these analyses, we can conclude that classification using gene expression data provides a promising future for cancer research. Acknowledgements I would like to express my greatest appreciation to my thesis advisor Professor Dr. Mohammad Shahidul Islam for his guidance and encouragement. Bibliography: Sarhan, A. M. (2009). Cancer classification based on microarray gene expression data using DCT and ANN. Journal of Theoretical and Applied Information Technology, Vol. 6 Issue 2, p208. Alizadeh, A., Eisen, M. B., Davis, R.E., Ma, C., Lossos, I.S., Rosenwald, A., Boldrick, J.C., Sabet, H., Tran, T., Yu, X., Powell, J.I., Yang, L., Marti, G.E., Moore, T., Hudson, J .Jr., Lu ,L., Lewis, D.B., Tibshirani, R., Sherlock, G., Chan, W.C., Greiner, T.C., Weisenburger, D.D., Armitage, J.O., Warnke, R., Levy, R., Wilson, W., Grever, M.R., Byrd, J.C., Botstein, D., Brown, P.O., & Staudt, L.M. (2000). Distinct types of diffuse large B-cell lymphoma identified by gene expression profiling, Nature, Vol. 403, pp. 503–511. Chuang, L. Y., Yang, C. H., Wu, K. C. and Yang, C. H. (2011). A hybrid feature selection method for DNA microarray data. Computers in Biology and Medicine, vol. 41, no. 4, pp. 228–237. Chung, D. & Keles, S. (2010). Sparse partial least squares classification for high dimensional data. Statistical Applications in Genetics and Molecular Biology, Vol. 9, Article 17. Dettling, M. & Beuhlmann, P. (2002). Supervised clustering of genes, Genome Biology, Vol. 3, pp. research0069.1–0069.15. Dettling, M (2004). BagBoosting for tumor classification with gene expression data, Bioinformatics, Vol. 20, pp. 3583–3593. Duda, R. O., Hart, P. E. & Stork, D. G. (2000). Pattern Classification (Second Edition). A Wiley-Interscience Publication. Dudoit, S., Fridlyand, J. & Speed, T. P. (2002). Comparison of discrimination methods for the classification of tumors using gene expression data. Journal of the American Statistical Association, Vol. 97, No. 457, p. 77–87. Friedman, J. H. (1994). Flexible metric nearest neighbor classification. Technical report, Dept. of Statistics, Stanford University. Ghorai, S., Mukherjee, A., Sengupta, S. and Dutta, P. (2010). Multicategory cancer classification from gene expression data by multiclass nppc ensemble. International Conference on Systems in Medicine and Biology (ICSMB), pp. 4–48. Golub, G. & Loan, C. F. Van. (1996). Matrix Computations. The Johns Hopkins University Press, 3rd edition. Golub, T., Slonim, D., Tamayo, P., Huard, C., Gaasenbeek, M., Mesirov, J., Coller, H., Loh, M., Downing, J., and Caligiuri, M. (1999). Molecular classification of cancer: Class discovery and class prediction by gene expression monitoring. Science, Vol. 286, 531–537. Jain, A. K., Duin, R. P. W., & Jianchang, M. (2000). Statistical pattern recognition: a review. Pattern Analysis and Machine Intelligence, IEEE Transactions on, 22(1), 4-37. Khan, J. and Wei, J. S. and Ringner, M. and Saal, L. H. and Ladanyi, M. and Westermann, F. and Berthold, F. and Schwab, M. and Antonescu, C. R. and Peterson, C. and Meltzer, P. S. (2001). Classification and diagnostic prediction of cancers using gene expression profiling and artificial neural networks, Nature Medecine, 7, 673–679.
  • 8. Computer Engineering and Intelligent Systems www.iiste.org ISSN 2222-1719 (Paper) ISSN 2222-2863 (Online) Vol.5, No.10, 2014 8 Lee, C.-C.; Huang, S.-S. & Shih, C.-Y. (2010). Facial Affect Recognition Using Regularized Discriminant Analysis-Based Algorithms, EURASIP J. Adv. Sig. Proc. 2010 . Li, T., Zhang, C., and Ogihara, M. (2004). A comparative study of feature selection and multiclass classification methods for tissue classification based on gene expression. Bioinformatics. Li, H., Zhang, K. & Jiang, T. (2005). Robust and Accurate Cancer Classification with Gene Expression Profiling. Proceedings of the 2005 IEEE Computational Systems Bioinformatics Conference, pages 320- 321. Park, C. and Cho, S.-B. (2003). Genetic search for optimal ensemble of feature classifier pairs in dna gene expression profiles. In Neural Networks, volume 3, pages 1702– 1707. Proceedings of the International Joint Conference on, IEEE. Pima, I. & Aladjem, M. (2004). Regularized discriminant analysis for face recognition. Pattern Recognition 37 (9) , 1945-1948. Speed, T., Ed. (2003). Statistical Analysis of Gene Expression Microarray Data. Interdisciplinary Statistics Series, Chapman & Hall/CRC. Webb, A. R. (2002). Statistical pattern recognition. West Sussex, England; New Jersey: Wiley. Ye, J., Xiong, T., Li, Q., Janardan, R., Bi, J., Cherkassky, V., Kambhamettu, C. (2006). Efficient Model Selection for Regularized Linear Discriminant Analysis.
  • 9. Business, Economics, Finance and Management Journals PAPER SUBMISSION EMAIL European Journal of Business and Management EJBM@iiste.org Research Journal of Finance and Accounting RJFA@iiste.org Journal of Economics and Sustainable Development JESD@iiste.org Information and Knowledge Management IKM@iiste.org Journal of Developing Country Studies DCS@iiste.org Industrial Engineering Letters IEL@iiste.org Physical Sciences, Mathematics and Chemistry Journals PAPER SUBMISSION EMAIL Journal of Natural Sciences Research JNSR@iiste.org Journal of Chemistry and Materials Research CMR@iiste.org Journal of Mathematical Theory and Modeling MTM@iiste.org Advances in Physics Theories and Applications APTA@iiste.org Chemical and Process Engineering Research CPER@iiste.org Engineering, Technology and Systems Journals PAPER SUBMISSION EMAIL Computer Engineering and Intelligent Systems CEIS@iiste.org Innovative Systems Design and Engineering ISDE@iiste.org Journal of Energy Technologies and Policy JETP@iiste.org Information and Knowledge Management IKM@iiste.org Journal of Control Theory and Informatics CTI@iiste.org Journal of Information Engineering and Applications JIEA@iiste.org Industrial Engineering Letters IEL@iiste.org Journal of Network and Complex Systems NCS@iiste.org Environment, Civil, Materials Sciences Journals PAPER SUBMISSION EMAIL Journal of Environment and Earth Science JEES@iiste.org Journal of Civil and Environmental Research CER@iiste.org Journal of Natural Sciences Research JNSR@iiste.org Life Science, Food and Medical Sciences PAPER SUBMISSION EMAIL Advances in Life Science and Technology ALST@iiste.org Journal of Natural Sciences Research JNSR@iiste.org Journal of Biology, Agriculture and Healthcare JBAH@iiste.org Journal of Food Science and Quality Management FSQM@iiste.org Journal of Chemistry and Materials Research CMR@iiste.org Education, and other Social Sciences PAPER SUBMISSION EMAIL Journal of Education and Practice JEP@iiste.org Journal of Law, Policy and Globalization JLPG@iiste.org Journal of New Media and Mass Communication NMMC@iiste.org Journal of Energy Technologies and Policy JETP@iiste.org Historical Research Letter HRL@iiste.org Public Policy and Administration Research PPAR@iiste.org International Affairs and Global Strategy IAGS@iiste.org Research on Humanities and Social Sciences RHSS@iiste.org Journal of Developing Country Studies DCS@iiste.org Journal of Arts and Design Studies ADS@iiste.org
  • 10. The IISTE is a pioneer in the Open-Access hosting service and academic event management. The aim of the firm is Accelerating Global Knowledge Sharing. More information about the firm can be found on the homepage: http://www.iiste.org CALL FOR JOURNAL PAPERS There are more than 30 peer-reviewed academic journals hosted under the hosting platform. Prospective authors of journals can find the submission instruction on the following page: http://www.iiste.org/journals/ All the journals articles are available online to the readers all over the world without financial, legal, or technical barriers other than those inseparable from gaining access to the internet itself. Paper version of the journals is also available upon request of readers and authors. MORE RESOURCES Book publication information: http://www.iiste.org/book/ IISTE Knowledge Sharing Partners EBSCO, Index Copernicus, Ulrich's Periodicals Directory, JournalTOCS, PKP Open Archives Harvester, Bielefeld Academic Search Engine, Elektronische Zeitschriftenbibliothek EZB, Open J-Gate, OCLC WorldCat, Universe Digtial Library , NewJour, Google Scholar