PERSONALITY AND SOCIAL PSYCHOLOGY BULLETIN
Diekman, Eagly / STEREOTYPES AS DYNAMIC CONSTRUCTS
SPSP Student Publication Award For 1999
Stereotypes as Dynamic Constructs:
Women and Men of the
Past, Present, and Future
Amanda B. Diekman
Alice H. Eagly
Northwestern University
Dynamic stereotypes characterize social groups that are thought
to have changed from the attributes they manifested in the past
and even to continue to change in the future. According to social
role theory’s assumption that the role behavior of group members
shapes their stereotype, groups should have dynamic stereotypes
to the extent that their typical social roles are perceived to change
over time. Applied to men and women, this theory makes two pre-
dictions about perceived change: (a) perceivers should think that
sex differences are eroding because of increasing similarity of the
roles of men and women and (b) the female stereotype should be
particularly dynamic because of greater change in the roles of
women than of men. This theory was tested and confirmed in
five experiments that examined perceptions of the roles and the
personality, cognitive, and physical attributes of men and
women of the past, present, and future.
Many theories of stereotyping emphasize that stereo-
types restrict the opportunities of members of disadvan-
taged groups and justify the societal arrangements by
which these groups have low status (Jackman, 1994; Jost &
Banaji, 1994; Sidanius, 1993). Our research challenges
the completeness of this perspective by arguing that ste-
reotypes can include beliefs that a group’s characteristics
are changing in a direction that erodes its members’ dis-
advantage. Stereotypic beliefs would have less power to
justify the social system to the extent that people believe
that a society is changing in a direction that erodes the
differences between less-advantaged and more-advan-
taged groups. We thus introduce the novel claim that
some stereotypes are dynamic because they incorporate
beliefs about changing characteristics. Although previ-
ous research has addressed actual change in stereotypic
content over a number of years by comparing earlier and
later data sets (e.g., Karlins, Coffman, & Walters, 1969;
Lueptow, Garovich, & Lueptow, 1995), our research is
different because it examines current perceptions of the
characteristics possessed by group members in the past,
present, and future.
Our theory of perceived change in group members’
attributes is that these dynamic aspects of stereotypes fol-
low from perceived change in the placement of the
group in the social structure. In general, a group’s ste-
reotypic characteristics are congruent with the activities
required by its typical social roles. To the extent that
observers reason as implicit role theorists, they should
believe that change in personal characteristics follows
from change in roles. This approach to determining ste-
reotype content thus reflects a social structural view of
stereotyping that.
PERSONALITY AND SOCIAL PSYCHOLOGY BULLETINDiekman, Eagly S.docx
1. PERSONALITY AND SOCIAL PSYCHOLOGY BULLETIN
Diekman, Eagly / STEREOTYPES AS DYNAMIC
CONSTRUCTS
SPSP Student Publication Award For 1999
Stereotypes as Dynamic Constructs:
Women and Men of the
Past, Present, and Future
Amanda B. Diekman
Alice H. Eagly
Northwestern University
Dynamic stereotypes characterize social groups that are thought
to have changed from the attributes they manifested in the past
and even to continue to change in the future. According to
social
role theory’s assumption that the role behavior of group
members
shapes their stereotype, groups should have dynamic stereotypes
to the extent that their typical social roles are perceived to
change
over time. Applied to men and women, this theory makes two
pre-
dictions about perceived change: (a) perceivers should think
that
sex differences are eroding because of increasing similarity of
the
roles of men and women and (b) the female stereotype should be
particularly dynamic because of greater change in the roles of
women than of men. This theory was tested and confirmed in
2. five experiments that examined perceptions of the roles and the
personality, cognitive, and physical attributes of men and
women of the past, present, and future.
Many theories of stereotyping emphasize that stereo-
types restrict the opportunities of members of disadvan-
taged groups and justify the societal arrangements by
which these groups have low status (Jackman, 1994; Jost &
Banaji, 1994; Sidanius, 1993). Our research challenges
the completeness of this perspective by arguing that ste-
reotypes can include beliefs that a group’s characteristics
are changing in a direction that erodes its members’ dis-
advantage. Stereotypic beliefs would have less power to
justify the social system to the extent that people believe
that a society is changing in a direction that erodes the
differences between less-advantaged and more-advan-
taged groups. We thus introduce the novel claim that
some stereotypes are dynamic because they incorporate
beliefs about changing characteristics. Although previ-
ous research has addressed actual change in stereotypic
content over a number of years by comparing earlier and
later data sets (e.g., Karlins, Coffman, & Walters, 1969;
Lueptow, Garovich, & Lueptow, 1995), our research is
different because it examines current perceptions of the
characteristics possessed by group members in the past,
present, and future.
Our theory of perceived change in group members’
attributes is that these dynamic aspects of stereotypes fol-
low from perceived change in the placement of the
group in the social structure. In general, a group’s ste-
reotypic characteristics are congruent with the activities
required by its typical social roles. To the extent that
observers reason as implicit role theorists, they should
believe that change in personal characteristics follows
4. Inc.
1171
at WALDEN UNIVERSITY on March 1,
2016psp.sagepub.comDownloaded from
http://psp.sagepub.com/
also enjoyed popularity in relation to stereotypes based
on ethnicity (e.g., Brewer & Campbell, 1976; LeVine &
Campbell, 1972), race (Feldman, 1972; Smedley &
Bayton, 1978; Stephan & Rosenfeld, 1982), and age
(Kite, 1996).
Social role theory argues that differential role occu-
pancy in the family and occupations fosters gender ste-
reotypes by which each sex is expected to have character-
istics that equip it to function adequately in its typical
roles. Gender stereotypes are thus emergents from
role-bound activities, and the characteristics favored by
these roles become stereotypic of each sex and facilitate
its typical activities. Consistent with this perspective,
Hoffman and Hurst (1990) demonstrated that stereo-
types about novel groups stem from the type of work
each group typically performs. To the extent that gender
stereotypes reflect observations of men and women in
social roles, perceivers should believe that their charac-
teristics change as their distributions into social roles
change. If perceivers believe that these distributions
have become more equivalent, they should also believe
that the characteristics of women and men have become
more similar. Moreover, if perceivers project into the
future this trend toward greater role similarity, they
should also project the continued erosion of sex
5. differences.
The roles of women and men have become more simi-
lar, mainly because of women’s increased participation
in the paid labor force. Specifically, women’s labor force
participation increased from 34% to 60% between 1950
and 1998 and men’s decreased from 86% to 75% (U.S.
Department of Labor, 1999). Because the modal situa-
tion for women now incorporates paid employment
along with domestic responsibilities (Hayghe, 1990),
perceivers should believe that women’s attributes have
shifted to incorporate the characteristics identified with
employees. As Eagly and Steffen (1984, 1986) showed,
these attributes are more agentic (e.g., competitive, indi-
vidualistic) and less communal (e.g., kind, nurturing)
than those identified with the domestic role.
Change in men’s roles is far more limited. Husbands
have only slightly increased their participation in domes-
tic work, even in dual-earner couples (Biernat &
Wortman, 1991; Steil, 1997). Men have thus not
increased their occupancy of the domestic role to the
extent that women have increased their occupancy of
the employee role (Shelton, 1992). Moreover, men have
not entered female-dominated occupations to the same
extent that women have entered male-dominated occu-
pations (Reskin & Roos, 1990). Therefore, because the
roles of women have changed more than those of men,
perceivers should think that the typical attributes of
women have changed more than those of men.
Our theory suggests that perceivers function as
implicit role theorists by noting change in role distribu-
tions and inferring corresponding change in stereotypic
characteristics. Relevant to inferences about change
over time is research by Ross (1989; Ross & Newby-Clark,
6. 1998) on people’s perceptions of their own personal his-
tories. This research suggests that people first evaluate
their present tendencies and then gauge their past by
invoking an implicit theory of stability or change,
depending on the available cues. Entrance into roles
cues theories of personal change because of the expecta-
tion that a new role evokes new behaviors. Similarly, role
entrance should also suggest change at the group level.
Because recognition of women’s entry into the
employee role should cue a theory of change, perceivers
should view women as different in the past than the pres-
ent. In contrast, because perception of a relative lack of
change in men’s roles should cue a theory of stability,
perceivers should view men as similar in the past and the
present. The projection of these trends into the future
would be consistent with Jones’s (1988) argument that
future states are generally perceived as progressing from
present states in a linear fashion.
DESIGN OF THE EXPERIMENTS
To assess perceptions of change and stability in
women and men, Experiments 1, 2, 3, and 4 directed
participants to imagine the average woman or man in
the present or in a specific past or future year. These
years spanned the century from 1950 to 2050. Partici-
pants then estimated the target individual’s masculine
and feminine characteristics and the traditionalism of
the social roles of men and women. To further explore
whether assumptions about social roles mediate infer-
ences about the characteristics of men and women,
Experiment 5 fixed participants’ assumptions about
social roles and then asked them to estimate each sex’s
characteristics.
The stereotype measures included several compo-
7. nents that may be perceived as relevant to carrying out
role-related activities. Consistent with Cejka and Eagly’s
(1999) research on the gender-stereotypic attributes
perceived as necessary for occupational success, our
experiments investigated personality, cognitive, and
physical attributes. Of primary interest were the agentic
and communal personality attributes first described by
Bakan (1966). The agentic attributes pertain to self-pro-
motion and individualism and tend to be associated with
men and employees, whereas the communal attributes
reflect connection with other people and tend to be asso-
ciated with women and homemakers (Eagly & Steffen,
1984). More exploratory was our inclusion of cognitive
and physical dimensions of gender stereotypes, which
1172 PERSONALITY AND SOCIAL PSYCHOLOGY
BULLETIN
at WALDEN UNIVERSITY on March 1,
2016psp.sagepub.comDownloaded from
http://psp.sagepub.com/
have received less attention in research. The masculine
cognitive stereotype emphasizes rationality and mathe-
matical reasoning, whereas the feminine cognitive ste-
reotype emphasizes intuition and creativity. The mascu-
line physical stereotype focuses on strength and
athleticism, whereas the feminine physical stereotype
focuses on beauty and sensuality (Deaux & Lewis, 1983,
1984).
In general, the perceived similarity of women and
men should increase from the past to the present and
from the present to the future. The stereotype of women
8. should be dynamic in the form of increasing masculinity
and, to a lesser extent, decreasing femininity. The stereo-
type of men should be less dynamic, although some
change in a feminine direction is expected. These pre-
dictions are held most confidently for the personality
dimensions of gender stereotypes because of their
known association with social roles. The prediction of
similar patterns of change over time on the cognitive
dimensions is more tenuous because of their much
weaker relationship to sex distributions into occupa-
tional roles (Cejka & Eagly, 1999). Also, the amount of
change perceived should be smaller on the physical than
the personality dimensions because some physical differ-
ences are intrinsic to the sexes (e.g., in size). Yet, actual
changes in athleticism and strength are surely possible,
and some of the physical characteristics included in our
scales are malleable because they are tinged with per-
sonal style (e.g., cute).
The roles of men and women also should be per-
ceived to converge. If the root of gender stereotypes is
observations of role distributions, perceived change in
roles should mediate the effects of the target year on the
characteristics ascribed to each sex.
EXPERIMENTS 1 AND 2
Method
PARTICIPANTS AND PROCEDURE
Among the 301 Experiment 1 participants (156
women, 144 men, 1 sex unreported), 214 attended a
Midwestern private university and 87 a regional exten-
sion campus of a Midwestern public university. The 188
Experiment 2 participants (85 women, 99 men, 4 sex
9. unreported) had a median age of 40 years, with 66.5%
holding at least a college degree. The samples for Exper-
iments 1 and 2, respectively, were 73.4% and 86.2%
European American, 18.3% and 3.2% Asian American,
5.0% and 8.0% African American, 0.3% and 1.1% His-
panic American, and 3.0% and 1.6% unidentified by
race.
For the Experiment 1 public university sample, a
female surveyor distributed the questionnaires to stu-
dents in a classroom setting. She informed them that
they were under no obligation to participate, and 2
declined. For the other samples, surveyors randomly
selected participants by asking every fifth person who
was sitting alone at campus locations (Experiment 1) or
in the waiting lounges at a large metropolitan airport
(Experiment 2). Those who consented (Experiment 1:
85.6%; Experiment 2: 68.3%) received a questionnaire
from the surveyor, who collected it approximately 5 min-
utes later. For Experiment 2, 17 respondents were dis-
carded because they reported citizenship other than the
United States. All participants completed the stereotype
measure, followed by the role nontraditionalism mea-
sure, and then received a written debriefing.1
INDEPENDENT VARIABLES
The questionnaire asked the participant to focus on
one target person, described as average. In Experiment
1, the target’s other attributes were manipulated accord-
ing to a 2 (target sex) × 3 (year) between-subjects facto-
rial design, resulting in an average man or woman in
1950, the present, or 2050. In Experiment 2, the years
1975 and 2025 were added, resulting in a 2 (target sex) ×
5 (year) between-subjects factorial design. For targets in
10. the present condition, no year was specified (e.g., the
average woman), whereas for all other year conditions, a
year was specified (e.g., the average man in 2050).
MEASURING INSTRUMENTS
Participant demographics. For the private university par-
ticipants, the surveyor noted the sex and visible majority
versus minority status of each participant (e.g., Euro-
pean American, African American). The public univer-
sity participants reported their race or ethnicity and sex
as the last items on the questionnaire; Experiment 2 par-
ticipants also reported their sex, age, educational level,
and citizenship, and the surveyor noted the visible
majority versus minority status.
Perceived role nontraditionalism. The perceived sex dis-
tributions for traditionally male-dominated or
female-dominated occupations and household activities
were assessed for the experimental conditions’ year. Par-
ticipants estimated the percentages of (a) workers who
are male versus female in six occupations (lawyer, physi-
cian, automobile mechanic, flight attendant, elemen-
tary school teacher, and homemaker) and (b) activities
performed by the husband/father versus wife/mother
for six household tasks (taking care of the car, mowing
the lawn, fixing things around the house, cleaning, laun-
dry, and cooking). For the Experiment 1 public univer-
sity participants and the Experiment 2 participants, the
activity “caring for children” was added. With each item
represented by the percentage estimated for the
Diekman, Eagly / STEREOTYPES AS DYNAMIC
CONSTRUCTS 1173
at WALDEN UNIVERSITY on March 1,
11. 2016psp.sagepub.comDownloaded from
http://psp.sagepub.com/
counterstereotypic sex (e.g., female auto mechanics,
cooking performed by the husband/father), the role
nontraditionalism measure produced by averaging over
the items showed high internal consistency (alphas = .91
for Experiment 1 and .89 for Experiment 2).2
Gender-stereotypic characteristics. On a 7-point scale rang-
ing from very likely to very unlikely, participants rated the
likelihood that the target person would possess each of
36 predominantly positive characteristics. For Experi-
ment 2, the instrument was shortened to 24 characteris-
tics to simplify responding for the general public (see
the appendix for all items). These characteristics repre-
sented the personality, cognitive, and physical compo-
nents of the male and female stereotypes, which were
factor analytically derived by Cejka and Eagly (1999).
With each of these six variables represented by six items
in Experiment 1 and four items in Experiment 2, the
scales produced by averaging responses across the items
had high internal consistency, as assessed by alphas, for
the first and second experiments, respectively: .85 and
.81 for masculine personality, .92 and .89 for masculine
cognitive, .88 and .81 for masculine physical, .93 and .92
for feminine personality, .84 and .84 for feminine cogni-
tive, and .88 and .86 for feminine physical.
Results
Analyses of variance (ANOVAs) are reported for each
dependent variable separately. Mixed ANOVAs that
treated gender typing of dimension (masculine or femi-
12. nine) and stereotypic component (personality, cogni-
tive, physical) as repeated measures produced results
similar to those reported. Trend analyses are included to
show whether perceptions changed over the year condi-
tions in linear or nonlinear (e.g., quadratic, cubic) pat-
terns (see Keppel, 1991).
PERCEPTIONS OF ROLES
Because men and women should be thought to
change only if their roles are perceived to change, we
first present estimates of role nontraditionalism.3 The
main effect of year for Experiments 1 and 2 was signifi-
cant, F(2, 293) = 291.85, p < .0001, and F(4, 164) = 62.21,
p < .0001, respectively (see Table 1 for means). Partici-
pants perceived roles as much more egalitarian with the
passage of time, as shown by the linear increases in
nontraditionalism, F(1, 293) = 576.43, p < .0001, and F(1,
164) = 225.05, p < .0001. In Experiment 1, a much
smaller quadratic trend, F(1, 293) = 6.38, p < .025,
reflected the greater shift from 1950 to the present than
from the present to 2050. In Experiment 2, a cubic
trend, F(1, 164) = 21.68, p < .0001, reflected little growth
of nontraditionalism between 1950 and 1975 and
between 2025 and 2050.4
GENDER-STEREOTYPIC CHARACTERISTICS
Experiment 1. The critical analyses were Target Sex ×
Year ANOVAs. Demonstrating the stereotypicality of the
dimensions was the significant main effect of target sex
on all six dimensions, ps < .005 or smaller. The ratings
were higher for female targets on the feminine dimen-
sions and for male targets on the masculine dimensions.
The main effect of year, which was significant, ps < .005 or
smaller, on all dimensions except feminine personality,
13. should be interpreted in the context of the Target Sex ×
Year interaction.
As implied by our prediction of convergence in the
perceived characteristics of women and men, the Target
Sex × Year interaction was significant on the measures,
although not on the feminine cognitive dimension (see
Table 2 for means). Consistent with this interaction on
the masculine personality dimension, F(2, 294) = 36.24,
p < .0001, participants perceived female targets as
increasing sharply in these characteristics and male tar-
gets as remaining stable. The significant Target Sex ×
Year linear interaction, F(1, 294) = 72.36, p < .0001, indi-
cated that the linear trends over the year conditions dif-
fered for male and female targets (see Keppel, 1991).
Simple effects analyses within levels of target sex
revealed only a significant linear increase for female tar-
gets, F(1, 294) = 120.39, p < .0001.
The masculine cognitive dimension also showed a sig-
nificant Target Sex × Year interaction, F(2, 294) = 8.26,
p < .0005, such that participants perceived female targets
as increasing substantially and male targets as remaining
relatively unchanged. The significant effects in the trend
analyses were a Target Sex × Year linear interaction, F(1,
294) = 15.33, p < .0001; a linear increase for female tar-
gets, F(1, 294) = 47.28, p < .0001; and a much weaker qua-
dratic trend for male targets, F(1, 294) = 4.24, p < .05.
Consistent with the interaction on the masculine
physical dimension, F(2, 294) = 4.29, p < .025, partici-
pants perceived female targets as increasing and male
1174 PERSONALITY AND SOCIAL PSYCHOLOGY
BULLETIN
14. TABLE 1: Experiments 1 Through 4: Role Nontraditionalism by
Year
Experiment 1 Experiment 2 Experiment 3 Experiment 4
Year M SD M SD M SD M SD
1950 11.06 6.25 13.61 8.89 14.70 8.49 15.47 10.43
1975 13.81 6.43 16.40 8.19
Present 25.36 7.82 25.37 7.27 23.63 5.54 28.56 6.13
2025 33.83 8.40 34.72 6.65
2050 34.86 7.54 34.79 7.79 35.79 6.63 38.39 6.69
NOTE: Mean perceived nontraditionalism is presented on a
scale on
which 0% indicates complete sex segregation in the traditional
direc-
tion and 50% indicates equal representation of the sexes.
at WALDEN UNIVERSITY on March 1,
2016psp.sagepub.comDownloaded from
http://psp.sagepub.com/
targets as not changing. The significant effects in the
trend analyses were a Target Sex × Year linear interac-
tion, F(1, 294) = 5.07, p < .025, and a linear increase for
female targets, F(1, 294) = 20.75, p < .0001.
Consistent with the interaction on the feminine per-
sonality dimension, F(2, 294) = 19.53, p < .0001, partici-
pants perceived female targets as decreasing and male
targets as increasing. The significant effects revealed by
trend analyses were a Target Sex × Year linear interac-
tion, F(1, 294) = 38.85, p < .0001; a linear decrease for
15. female targets, F(1, 294) = 24.27, p < .0001; and a linear
increase for male targets, F(1, 294) = 15.06, p < .0001.
Consistent with the interaction on the feminine physi-
cal dimension, F(2, 294) = 10.52, p < .0001, participants
perceived female targets as stable and male targets as
increasing. The significant effects in the trend analyses
were a Target Sex × Year linear interaction, F(1, 294) =
21.01, p < .0001, and for male targets, a linear increase,
F(1, 294) = 23.42, p < .0001, and a smaller quadratic
trend, F(1, 294) = 3.96, p < .05.
Consistent with the absence of a significant interac-
tion on the feminine cognitive dimension, participants
perceived male and female targets to be increasing simi-
larly in these characteristics. The linear increase for the
year main effect was significant, F(1, 294) = 13.58, p <
.0005.
Experiment 2. Stereotypic sex differences yielded a sig-
nificant main effect for target sex on all dimensions, ps <
.05 or smaller, except for masculine cognitive, on which
female targets had very high ratings in 2050. The main
effect of year, which was significant, ps < .05 or smaller, on
all dimensions except feminine physical, p < .10, should
be interpreted in the context of the Target Sex × Year
interaction.
The significant interaction obtained on all of the mas-
culine dimensions and none of the feminine dimensions
showed that convergence in gender-stereotypic charac-
teristics was limited to the masculine dimensions (see
means in Table 3). Consistent with the significant inter-
action on the masculine personality dimension, F(4,
172) = 4.67, p < .001, participants perceived female tar-
16. gets as increasing sharply over the years and male targets
as remaining unchanged. The significant effects in the
trend analyses were the Target Sex × Year linear interac-
tion, F(1, 172) = 18.41, p < .0001, and a linear increase for
female targets, F(1, 172) = 50.79, p < .0001.
For masculine cognitive characteristics, the interac-
tion was significant, F(4, 172) = 6.61, p < .0001. The sig-
nificant effects in the trend analyses were the linear
interaction, F(1, 172) = 21.91, p < .0001; a linear increase
for female targets, F(1, 172) = 46.96, p < .0001; and a
much smaller cubic trend for male targets, F(1, 172) =
5.63, p < .05.
For masculine physical characteristics, the interac-
tion was significant, F(4, 172) = 4.80, p < .001. The signifi-
cant effects in the trend analyses were the linear interac-
tion, F(1, 172) = 16.85, p < .0001, and a linear increase for
female targets, F(1, 172) = 25.74, p < .0001.
F o r a l l o f t h e f e m i n i n e d i m e n s i o n s , t h e
nonsignificant interaction indicated similar effects of
year on female and male targets. The trend analyses for
the year main effect yielded a linear decrease and a cubic
trend for feminine personality, a linear increase for femi-
nine cognitive, and a quadratic trend for feminine physi-
cal, ps < .05.
MEDIATION OF THE EFFECTS OF YEAR ON
GENDER-STEREOTYPIC CHARACTERISTICS
Path analyses tested a simple mediational model that
assumed that inferences about roles accounted for the
relation between the context year and beliefs about gen-
der-stereotypic characteristics (Baron & Kenny, 1986).
17. To obtain the appropriate statistical power, we aggre-
Diekman, Eagly / STEREOTYPES AS DYNAMIC
CONSTRUCTS 1175
TABLE 2: Experiment 1: Mean Ratings on Gender-Stereotypic
Dimensions by Target Sex and Year
Masculine Feminine
Personality Cognitive Physical Personality Cognitive Physical
Target Sex and Year M SD M SD M SD M SD M SD M SD
Female
1950 3.35 1.13 3.89 1.31 3.21 1.35 5.92 0.90 4.80 1.07 4.90
1.28
Present 4.56 0.96 4.52 0.96 3.45 0.93 5.54 0.89 5.18 0.76 4.42
0.98
2050 5.35 0.84 5.33 1.08 4.18 1.04 5.02 1.03 5.16 1.01 4.56
1.09
Overall 4.41 1.28 4.57 1.26 3.61 1.19 5.50 1.01 5.05 0.97 4.63
1.14
Male
1950 5.10 0.76 4.93 1.06 4.31 1.09 3.74 0.91 3.82 0.79 3.13
0.92
Present 5.31 0.71 4.70 0.75 4.70 0.80 4.05 0.75 3.98 0.62 3.26
0.83
2050 4.92 0.97 5.22 0.98 4.60 1.08 4.43 0.91 4.37 0.91 4.09
0.86
Overall 5.11 0.83 4.95 0.96 4.54 1.01 4.07 0.90 4.06 0.81 3.50
0.97
NOTE: Ratings were on a 7-point scale on which higher scores
indicate greater likelihood of possessing each characteristic.
18. Cell ns ranged from 49
to 51 participants.
at WALDEN UNIVERSITY on March 1,
2016psp.sagepub.comDownloaded from
http://psp.sagepub.com/
gated the data for 1950, the present, and 2050 from
Experiments 1 and 2. We performed the analyses sepa-
rately for male and female targets on each gender-stereo-
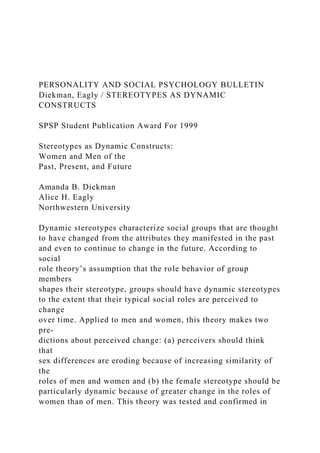
typic dimension with the data merged across years.
The results for female targets suggested that infer-
ences about roles mediated the effects of year on all
three masculine dimensions, although the direct path
between year and the stereotypic characteristics
remained significant on the masculine personality and
cognitive dimensions (see Figure 1). The strength of the
direct path is not surprising given that the measure of
role nontraditionalism included only a few occupations
and domestic activities and thus was no doubt highly
imperfect. More important is the demonstration of the
indirect effect of year on the female targets’ characteris-
tics as mediated by role nontraditionalism. According to
Sobel’s test of significance of this mediation, role
nontraditionalism mediated the relationship between
year and women’s masculine personality characteristics,
Z = 4.83, p < .0001, masculine cognitive characteristics, Z =
3.51, p < .0005, and masculine physical characteristics, Z =
3.10, p < .001. For models assessing female targets’
change on the feminine dimensions, one or more of the
relevant paths were nonsignificant and thus failed to
meet the criteria for mediation.
19. For male targets, the path-analytic results suggested
that inferences about roles mediated the effects of year
only on the feminine personality dimension (see Figure 2),
and Sobel’s test was significant, Z = 3.66, p < .0005. For
models assessing male targets’ change on the other five
dimensions, one or more of the relevant paths were
nonsignificant and thus failed to meet the criteria for
mediation.
Discussion
These experiments confirmed our hypotheses about
dynamic stereotypes by demonstrating perceptions of
increasing role equality and a corresponding conver-
gence in the perceived characteristics of women and
men over 100 years. This convergence was primarily
accounted for by increasing ascription of masculine
characteristics to women. Also contributing to conver-
gence in Experiment 1 were men’s gains in feminine
personality and physical characteristics and women’s
losses of feminine personality characteristics. In Experi-
ment 2, these additional changes were somewhat weaker
and failed to reach significance with the smaller sample
size.
The perception of women’s increase in masculine
characteristics generalized to Experiment 2’s sample of
older participants and within this sample showed no vari-
ation accounted for by participants’ age. This consensus
is impressive given that contemporary college students’
relatively egalitarian gender-role attitudes (Twenge,
1997a) might have enhanced the perception of increas-
ing similarity of the sexes. Instead, our findings suggest
that knowledge of the role transition of women and its
implications for personal qualities is widely shared in the
culture. Moreover, there is considerable consensus
20. about future changes.
The dramatic perceived increase in women’s mascu-
line personality characteristics is compatible with our
reasoning that the greatest change in roles is women’s
entry into traditionally male-dominated occupations.
The more modest, albeit still very substantial, tendency
for women to be perceived as increasing in masculine
1176 PERSONALITY AND SOCIAL PSYCHOLOGY
BULLETIN
TABLE 3: Experiment 2: Mean Ratings on Gender-Stereotypic
Dimensions by Target Sex and Year
Masculine Feminine
Personality Cognitive Physical Personality Cognitive Physical
Target Sex and Year M SD M SD M SD M SD M SD M SD
Female
1950 3.56 1.32 3.75 1.26 2.87 1.49 5.71 1.43 4.75 1.26 4.96
1.21
1975 4.02 1.04 3.96 1.26 3.04 1.01 5.73 0.85 5.43 0.97 5.12
1.07
Present 4.82 0.89 4.92 0.72 3.72 1.16 5.69 0.75 5.30 0.78 4.46
0.91
2025 5.28 1.66 5.34 1.76 3.80 1.35 4.37 1.66 5.32 1.56 4.25
1.28
2050 5.72 0.97 5.90 1.10 4.53 0.96 5.14 1.25 5.69 0.94 5.03
1.00
Overall 4.62 1.43 4.71 1.48 3.55 1.33 5.36 1.31 5.29 1.15 4.79
1.13
Male
21. 1950 4.81 0.82 4.88 0.80 4.19 0.66 4.01 0.83 3.86 0.66 3.45
0.66
1975 4.93 0.79 4.70 1.04 4.19 1.15 4.22 0.85 4.24 1.21 3.49
1.01
Present 5.26 0.84 4.95 0.91 4.64 0.80 4.25 1.03 4.03 1.14 3.08
1.04
2025 5.17 0.90 5.53 0.96 4.10 1.04 3.95 1.15 4.60 0.89 3.84
1.05
2050 5.06 1.23 4.50 1.27 3.89 1.14 4.14 1.42 4.33 1.24 3.85
1.08
Overall 5.04 0.94 4.89 1.06 4.18 1.00 4.11 1.07 4.23 1.05 3.56
1.00
NOTE: Ratings were on a 7-point scale on which higher scores
indicate greater likelihood of possessing each characteristic.
Cell ns ranged from 15
to 21 participants.
at WALDEN UNIVERSITY on March 1,
2016psp.sagepub.comDownloaded from
http://psp.sagepub.com/
cognitive characteristics may reflect these attributes’
association with at least a subset of male-dominated
roles. Also, the tendencies for men’s increase in femi-
nine personality and physical characteristics to be more
modest may reflect the very limited movement of men
into female-dominated roles. Women’s corresponding
tendency to retain female-dominated roles, especially
the domestic role, may have restricted their decrease in
feminine personality qualities and dampened change in
feminine cognitive and physical qualities as well.
In general, the path analyses supported the assump-
22. tion that perceptions of role distributions mediate the
impact of the context year on beliefs about targets’ char-
acteristics. This argument does not imply that partici-
pants necessarily invoked their beliefs about roles’ sex
distributions at the moment that they estimated the
characteristics of men or women. Rather, through exten-
sive prior observation, they had learned implicitly that
movement into roles generally produces a shift toward
the characteristics required for effective functioning in
the roles. When participants observed substantial
changes in social roles, they thus inferred that role occu-
pants’ characteristics changed to accommodate these
roles. That this evidence for mediation was consistently
obtained for female targets’ masculine characteristics is
compatible with the consistent effects of the context year
on these characteristics and with the underlying ten-
dency for women to assume traditionally male-domi-
nated roles. Nonetheless, the path analyses also sug-
gested that the impact of context year on inferences
about men’s feminine personality attributes followed
from perceptions of role nontraditionalism.
EXPERIMENT 3
Although Experiments 1 and 2 provide considerable
evidence that the stereotype of women is dynamic due to
perceived change in women’s roles, limitation of these
demonstrations to evaluatively positive qualities might
mean that they are contaminated by optimism. Because
people are optimistic about their personal futures (Ross &
Newby-Clark, 1998), they may also hold positive expecta-
tions about the future of society and therefore think that
women progressively adopt desirable masculine charac-
teristics. However, women’s entry into male-dominated
roles should lead to perceived increases in all of the
23. attributes associated with occupants of these roles.
Therefore, an even more convincing demonstration
that the dynamic stereotype of women is driven by per-
ceived changes in roles would include the increasing
Diekman, Eagly / STEREOTYPES AS DYNAMIC
CONSTRUCTS 1177
Figure 1 Path analyses of the effects of year on masculine
charac-
teristics and its mediation by perceived role nontradition-
alism for female targets.
NOTE: Regression coefficients are shown, with standardized
coeffi-
cients in parentheses.
*p < .05. **p < .01. ***p < .001.
Figure 2 Path analysis of the effect of year on feminine
personality
characteristics and its mediation by perceived role
nontraditionalism for male targets.
NOTE: Regression coefficients are shown, with standardized
coeffi-
cients in parentheses.
***p < .001.
at WALDEN UNIVERSITY on March 1,
2016psp.sagepub.comDownloaded from
http://psp.sagepub.com/
ascription to women of undesirable as well as desirable
masculine characteristics.
24. Useful for this demonstration is Spence, Helmreich,
and Holahan’s (1979) negative masculinity scale con-
taining items concerned with self-aggrandizement (e.g.,
boastful, egotistical) and abuse of power (e.g., arrogant,
hostile). Because many male-dominated roles are associ-
ated with various sources of power, such as status, exper-
tise, and resources, perceivers may believe that some
occupants of these roles become egotistical and abuse
this power. Male-dominated roles may thus be associated
in people’s minds with these negative qualities.
Also useful is Spence et al.’s (1979) negative feminin-
ity scale, which pertains mainly to self-subordination
(e.g., spineless, servile) and indirect, disagreeable meth-
ods of influence (e.g., nagging, whiny). Because women
have been concentrated in less powerful roles, self-sub-
ordination is an understandable consequence of their
social position, along with indirect methods of social
influence (Johnson, 1976; Lips, 1991). Therefore, these
negative characteristics may become associated with the
occupants of female-dominated roles.
As women enter male-dominated roles, they should
be perceived as possessing negative masculine character-
istics in greater measure, along with positive masculine
characteristics. Consistent with the weaker trends in
Experiments 1 and 2, we are less confident that male tar-
gets will be perceived as increasing in negative or positive
feminine characteristics. Negative feminine characteris-
tics should decrease in female targets to the extent that
women’s role shift is perceived to raise their status and
reduce their reliance on the indirect influence strategies
featured in this measure.
Method
25. PARTICIPANTS AND PROCEDURE
Three female surveyors, following the survey proce-
dure described for Experiment 1, recruited a total of 264
participants (130 women, 126 men, 8 sex unreported)
from a Midwestern private university. Of those ap-
proached, 87.1% agreed to participate. The sample was
56.8% European American, 27.6% Asian American,
5.7% African American, 1.1% Hispanic American, and
5.3% unidentified by race. One participant was dropped
for inappropriate responding.
INDEPENDENT VARIABLES
Using the same design as Experiment 2, the question-
naire asked the participant to focus on one target per-
son, whose attributes were manipulated according to
a 2 (target sex) × 5 (year) between-subjects factorial
design.
MEASURING INSTRUMENTS
Participant demographics. The surveyor noted each par-
ticipant’s sex and visible minority versus majority status.
P e r c e i v e d r o l e n o n t r a d i t i o n a l i s m . T h e r o l
e
nontraditionalism measure from Experiments 1 and 2
showed high internal consistency (alpha = .90).
Gender-stereotypic characteristics. The instrument in-
cluded 8 positive feminine personality items and 8 posi-
tive masculine personality items. The negative feminine
and masculine personality dimensions were each repre-
sented by 8 items drawn from Spence et al. (1979) (see
26. the appendix for all items). The four resulting scales had
satisfactory alphas: .78 for positive masculine, .85 for
negative masculine, .93 for positive feminine, and .77 for
negative feminine.
Results and Discussion
PERCEPTIONS OF ROLES
The main effect of year on role nontraditionalism was
again significant, F(4, 246) = 98.50, p < .0001 (see Table 1
for means). The significant effects in the trend analyses
were again a very large linear increase, F(1, 246) =
364.48, p < .0001, and a smaller cubic trend, F(1, 246) =
27.20, p < .0001, reflecting less growth in nontradi-
tionalism between 1950 and 1975 and between 2025 and
2050.5
GENDER-STEREOTYPIC CHARACTERISTICS
Confirming the stereotypicality of the measures was
the significant main effect for target sex on all four
dimensions (ps < .05 or smaller). The main effect of year,
which was significant, ps < .05 or smaller, on the two mas-
culine dimensions and the negative feminine dimen-
sion, should be interpreted in the context of the Target
Sex × Year interaction.
Consistent with our hypothesis of perceived conver-
gence of the sexes, the critical Target Sex × Year interac-
tion was significant or marginally significant on all four
dimensions (see Table 4 for means). On the positive mas-
culine dimension, this interaction was significant, F(4,
248) = 13.41, p < .0001. The significant effects in the
trend analyses were the linear interaction, F(1, 248) =
45.34, p < .0001; a very large linear increase, F(1, 248) =
27. 122.75, p < .0001, and a smaller quartic trend for female
targets, F(1, 248) = 5.62, p < .025; and a cubic trend for
male targets, F(1, 248) = 4.56, p < .05. On the negative
masculine dimension, the interaction was marginal, F(4,
248) = 2.20, p < .10. The significant effects in the trend
analyses were the linear interaction, F(1, 248) = 8.09, p <
.005; a large linear increase for female targets, F(1, 248) =
36.36, p < .0001; and a smaller linear increase for male
targets, F(1, 248) = 4.21, p < .05.
1178 PERSONALITY AND SOCIAL PSYCHOLOGY
BULLETIN
at WALDEN UNIVERSITY on March 1,
2016psp.sagepub.comDownloaded from
http://psp.sagepub.com/
On the positive feminine dimension, the interaction
was marginal, F(4, 248) = 2.05, p < .10. The only signifi-
cant effects in the trend analyses were the linear interac-
tion, F(1, 248) = 5.62, p < .025, and a quadratic trend for
male targets, F(1, 248) = 3.92, p < .05. On the negative
feminine dimension, the interaction was significant, F(4,
248) = 3.83, p < .005. The significant effects in the trend
analyses were the linear interaction, F(1, 248) = 13.61, p <
.0005, and a substantial linear decrease for female tar-
gets, F(1, 248) = 17.92, p < .0001.
In summary, consistent with Experiments 1 and 2, the
stereotype of women proved to be far more dynamic
than the stereotype of men. As predicted, women’s nega-
tive masculine characteristics increased along with their
positive masculine characteristics, although the increase
in these positive characteristics was larger. A smaller, yet
28. still notable erosion of women’s negative feminine char-
acteristics suggested that women are perceived to relin-
quish weaker methods of influence and to subordinate
themselves less as they enter male-dominated roles. In
general, rather than reflecting an optimistic hope that
women are becoming more like ideal men, participants’
beliefs approximated social role theory’s prediction that
women are increasingly perceived as manifesting men’s
worst qualities as well as their best qualities.
EXPERIMENT 4
Our first three experiments demonstrated belief in
the convergence of the attributes of men and women,
primarily through women taking on the characteristics
traditionally associated with men. However, an apparent
tendency to perceive that some sex differences com-
pletely disappear or even reverse their traditional direc-
tion may be contaminated by the shifting standards phe-
nomenon (Biernat, 1995; Biernat & Manis, 1994), by
which implicit stereotypes shape within-sex standards
for evaluating men and women on sex-typed attributes.
For example, a level of assertiveness that would be con-
sidered “somewhat assertive” for a man might be consid-
ered “very assertive” for a woman because a higher level
of assertiveness is thought to be typical of men and both
sexes are judged in relation to their own group.
Although such shifting standards would not compro-
mise the perceived convergence that we demonstrated,
our experiments would have overestimated the per-
ceived similarity of male and female targets and in some
instances (e.g., positive masculine characteristics in the
future) would have incorrectly produced the appear-
ance that women’s masculine characteristics were
thought to exceed men’s.
29. To minimize shifting standards, Biernat and Manis
(1994) recommended that raters judge groups accord-
ing to a common standard. Such a common standard
can be achieved by having participants compare the
groups with one another on the same scale or rate the
groups separately according to a standard that is objec-
tively or externally anchored. In the prior experiments
in this series, we avoided asking for direct comparisons
of men and women in an effort to reduce demand char-
acteristics and self-presentational concerns. Although
our between-subjects manipulation of target sex thus has
advantages, it allows participants to use different stan-
dards in rating men and women. Therefore, Experiment
4 required that participants directly compare men and
women on each characteristic. In addition, participants
judged the sexes on an externally anchored standard by
estimating their average annual earnings. These esti-
mates would provide an alternative, less direct measure
of the distribution of the sexes into social roles because
similar roles should produce similar earnings. Of course,
the role nontraditionalism measure produced from par-
ticipants’ estimates of sex distributions is also externally
anchored.
Method
PARTICIPANTS AND PROCEDURE
A male and a female surveyor recruited 97 students
(55 women, 42 men) at a private Midwestern university
according to the survey procedure described in Experi-
ment 1. Of those approached, 85.8% agreed to complete
the survey. This sample was 73.2% European American,
18.5% Asian American, 4.1% African American, 1.0%
Hispanic American, and 3.1% unidentified by race.
30. Diekman, Eagly / STEREOTYPES AS DYNAMIC
CONSTRUCTS 1179
TABLE 4: Experiment 3: Mean Ratings on Positive and
Negative
Gender-Stereotypic Personality Dimensions by Target
Sex and Year
Masculine Feminine
Target Sex
Positive Negative Positive Negative
and Year M SD M SD M SD M SD
Female
1950 3.29 0.69 3.00 0.64 5.34 0.77 4.08 0.70
1975 3.97 0.85 3.47 0.68 5.18 0.69 3.88 0.71
Present 4.06 0.65 3.50 0.69 5.39 0.77 4.03 0.77
2025 4.87 0.65 4.11 0.63 4.94 0.84 3.63 0.74
2050 5.13 0.39 4.22 1.05 5.04 0.86 3.16 0.90
Overall 4.24 0.93 3.64 0.86 5.19 0.79 3.77 0.82
Male
1950 4.85 0.68 4.31 1.07 4.13 1.08 3.37 1.00
1975 4.49 0.72 4.44 0.79 3.92 0.79 3.55 0.78
Present 4.81 0.68 4.53 0.70 4.06 0.87 3.57 0.79
2025 4.97 0.50 4.73 1.00 4.06 1.14 3.65 0.66
2050 4.94 0.66 4.68 0.77 4.56 0.89 3.56 0.86
Overall 4.80 0.67 4.53 0.88 4.15 0.97 3.54 0.82
NOTE: Ratings were on a 7-point scale on which higher scores
indicate
greater likelihood of possessing each characteristic. Cell ns
ranged
31. from 24 to 27 participants.
at WALDEN UNIVERSITY on March 1,
2016psp.sagepub.comDownloaded from
http://psp.sagepub.com/
INDEPENDENT VARIABLE
The questionnaire indicated one of the three years
used in Experiment 1 (1950, the present, or 2050). The
experiment had a one-way between-subjects factorial
design because participants focused on both men and
women (e.g., the average man and the average woman
i n 1 9 5 0 ; t h e o r d e r o f m a n a n d w o m a n w a s
counterbalanced).
MEASURING INSTRUMENTS
Participant demographics. The surveyor noted each par-
ticipant’s sex and visible minority versus majority status.
Perceived role nontraditionalism. The role nontradi-
tionalism measure again showed high internal consis-
tency (alpha = .91).
Earnings. Participants estimated the salaries (in 1997
dollars) for the average man and woman in the specified
year as the last items on the questionnaire.
Gender-stereotypic characteristics. These characteristics
were the same 36 used in Experiment 1 (see the appen-
dix for items). On a 7-point scale anchored by men
extremely more and women extremely more (with counterbal-
ancing of the end of the scale anchored by men vs.
32. women), participants rated the comparative likelihood
of men and women possessing each characteristic in the
specified year. For example, instructions for the future
condition stated, “Please rate how the average man and
the average woman in 2050 will compare with each other
on the following characteristics.” The six scales had satis-
factory alphas: .90 for masculine personality, .89 for mas-
culine cognitive, .90 for masculine physical, .85 for femi-
nine personality, .75 for feminine cognitive, and .81 for
feminine physical.
Results and Discussion
PERCEPTIONS OF ROLES
The effect of year on role nontraditionalism was sig-
nificant, F(2, 91) = 65.51, p < .0001 (see Table 1 for
means). Participants perceived female- and male-domi-
nated roles as becoming more egalitarian, as shown by
the linear increase in nontraditionalism, F(1, 91) =
130.33, p < .0001.
Earnings estimates were entered into a mixed
ANOVA, with male and female targets treated as a
within-subjects factor and year as a between-subjects fac-
tor. Consistent with the main effect for target sex, F(1,
83) = 159.40, p < .0001, men were perceived to have
higher salaries than women. Also, as shown by the main
effect for year, F(2, 83) = 22.12, p < .0001, salaries were
believed to increase over the century defined by the
experimental conditions. Confirming our prediction of
convergence of the sexes was the Target Sex × Year inter-
action, F(2, 83) = 3.83, p < .05. Trend analyses performed
within levels of target sex revealed a linear increase for
male salaries, F(1, 83) = 27.18, p < .0001, as well as a larger
33. linear increase for female salaries, F(1, 83) = 67.09, p <
.0001. Thus, estimates of women’s earnings as a percent-
age of men’s increased from 45.4% in 1950 to 74.5% in
the present and to 82.2% in 2050.
GENDER-STEREOTYPIC CHARACTERISTICS
The critical analysis was the one-way ANOVA testing
for effects of year on estimates of sex differences in gen-
der-stereotypic characteristics. A movement toward
equality is shown by an increase in masculine characteris-
tics or a decrease in feminine characteristics toward the
scale midpoint of 4. On all of the masculine dimensions
and the feminine personality dimension, perceived
equality increased (see Table 5 for means). Thus, for
masculine personality characteristics, the effect of year
was significant, F(2, 91) = 14.81, p < .0001, with a signifi-
cant linear shift toward equality, F(1, 91) = 29.48, p <
.0001. For masculine cognitive characteristics, the effect
of year also was significant, F(2, 91) = 3.48, p < .05, as was
the linear shift toward equality, F(1, 91) = 6.90, p < .01.
For masculine physical characteristics, the effect of year
was again significant, F(2, 91) = 3.08, p < .05, as was the
linear shift toward equality, F(1, 91) = 5.92, p < .05.
Although the effect of year did not attain significance on
feminine cognitive or physical characteristics, it was sig-
nificant on feminine personality characteristics, F(2, 91) =
1180 PERSONALITY AND SOCIAL PSYCHOLOGY
BULLETIN
TABLE 5: Experiment 4: Mean Comparative Ratings on Gender-
Stereotypic Dimensions by Target Sex and Year
Masculine Feminine
34. Personality Cognitive Physical Personality Cognitive Physical
Year M SD M SD M SD M SD M SD M SD
1950 2.60 0.93 3.19 1.10 2.37 1.13 5.51 0.80 4.63 0.86 4.99
0.93
Present 3.19 0.64 3.45 0.71 2.58 0.73 5.11 0.63 4.64 0.57 5.14
1.02
2050 3.93 1.23 3.80 0.90 3.00 1.15 4.93 0.97 4.69 0.71 4.96
0.81
NOTE: Ratings were on a 7-point scale on which higher scores
indicate greater likelihood of women possessing each
characteristic, and a score of 4
indicates perceived equality. Cell ns ranged from 31 to 32
participants.
at WALDEN UNIVERSITY on March 1,
2016psp.sagepub.comDownloaded from
http://psp.sagepub.com/
4.14, p < .05, as was the linear shift toward equality, F(1,
91) = 7.97, p < .01.
In summary, participants again perceived roles as
becoming more egalitarian and the sexes as becoming
more similar in their characteristics. Participants also
estimated a decreasing gender gap in earnings, reflect-
ing their perceptions of increased equality on this exter-
nally anchored measure. Yet, even for 2050, men’s earn-
ings were estimated to be higher than women’s, and
roles departed from the 50% value that would indicate
equality, ps < .0001.
35. The distinctive contribution of this fourth experi-
ment is to show that when participants directly
compared men and women, they perceived the sexes
as attaining virtual equality in masculine personality
and cognitive characteristics, as shown by the nonsignifi-
cance of the comparison between their estimate of simi-
larity for 2050 and the scale midpoint that indicated
exact equality. Because they did not view women as
exceeding men on these two dimensions in 2050, the
findings from the prior experiments of higher ratings of
women than men on these dimensions probably
reflected the use of different standards for women and
men, as Biernat (1995) has argued. Also in Experiment
4, the substantial shift toward perceived equality in mas-
culine physical characteristics as well as feminine person-
ality characteristics fell significantly short of the scale
midpoint in the 2050 condition, ps < .0001. As in the
three prior experiments, the largest effect occurred on
masculine personality characteristics. In general, requir-
ing direct comparisons showed that the perceived con-
vergence in the characteristics of men and women is
robust in relation to this important variation of experi-
mental design.
EXPERIMENT 5
Although we have consistently argued that the per-
ceived trajectory of the attributes of women and men was
mediated by perceived change in role distributions, our
demonstrations have been correlational. Therefore, we
augmented this demonstration of mediation by an
experiment that fixed role distributions in participants’
minds rather than leaving them free to vary. To achieve
this goal, we directed participants to assume a specified
division of labor existing in the future and then asked
them to rate the likelihood that the typical man or
36. woman living in such a society would possess gender-ste-
reotypic characteristics. We expected that participants
would perceive these characteristics as conforming to
the role system described, especially on the masculine
dimensions and the feminine personality dimension,
which in the earlier experiments showed the most con-
vergence as role similarity increased from 1950 to 2050.
Method
PARTICIPANTS AND PROCEDURE
One male and three female surveyors, following the
procedure described in Experiment 1, recruited a total
of 104 participants (50 women, 54 men) from a private
Midwestern university. Of those approached, 88.9%
agreed to participate. The sample was 64.4% European
American, 26.9% Asian American, 5.8% African Ameri-
can, 1.9% Hispanic American, and 1.0% unidentified by
race.
INDEPENDENT VARIABLES
In a 2 (target sex) × 3 (division of labor) between-sub-
jects design, participants were asked to imagine a future
society in which the target sex occupied certain kinds of
roles. The division of labor was described in one of three
ways: traditional roles, roles similar to those of today, and
equal roles. For example, instructions for the same-as-
today role condition read as follows:
Imagine that it is the year 2050. Please assume that men
occupy basically the same roles as they do now, even if
this outcome seems unlikely to you. For example, most
auto mechanics and high-level business executives are
men, and very few secretaries or elementary school
37. teachers are men. Tasks such as fixing the car and mow-
ing the lawn are usually done by men, and men are not
generally responsible for household jobs such as child
care or cooking.
In the traditional condition, roles were described as
more extremely segregated by sex (e.g., “almost all auto
mechanics are men . . . extremely few secretaries are
men”) and as comparable to the roles of 1950. In the
equal condition, men and women were described as
occupying similar roles (e.g., “only half of auto mechan-
ics are men . . . half of secretaries are men”). For the con-
ditions describing the female target sex, the adjectives
modifying the roles were switched to convey the desig-
nated division of labor (e.g., “very few auto mechanics
are women . . . most secretaries are women”; “half of auto
mechanics are women . . . only half of secretaries are
women”).
MEASURING INSTRUMENTS
Participant demographics. Participants reported sex,
age, U.S. citizenship, and level of education as the last
items on the questionnaire. The surveyor noted the visi-
ble majority versus minority status of the participant.
Earnings. Participants estimated the salary (in 1998
dollars) for an average man or woman living in the soci-
ety described.
Diekman, Eagly / STEREOTYPES AS DYNAMIC
CONSTRUCTS 1181
at WALDEN UNIVERSITY on March 1,
2016psp.sagepub.comDownloaded from
38. http://psp.sagepub.com/
Likelihood of role change. On a 7-point scale, participants
estimated the likelihood that the specified division of
labor would be in place in 2050.
Gender-stereotypic characteristics. Participants completed
the abbreviated version of the instrument, as in Experi-
ment 2 (see the appendix for items). The six scales had sat-
isfactory alphas: .86 for masculine personality, .88 for mas-
culine cognitive, .87 for masculine physical, .93 for
feminine personality, .81 for feminine cognitive, and .87
for feminine physical.
Results
PERCEPTIONS OF ROLES
Ratings of the likelihood of the roles that were
described showed a marginal main effect of division of
labor, F(2, 93) = 2.87, p < .075. Participants rated a shift
toward equal roles as most likely (M = 3.54), maintenance
of today’s roles as less likely (M = 3.17), and a return to tra-
ditional roles as least likely (M = 2.52). Contrasts revealed
that the traditional role system was seen as significantly less
likely than the equal role system, F(1, 93) = 5.54, p < .025.
The higher salaries estimated for men yielded a main
effect of target sex, F(1, 88) = 15.00, p < .0005 (one outlier
was removed). Consistent with our prediction of conver-
gence is the significant Target Sex × Division of Labor
interaction, F(2, 88) = 13.44, p < .0001, by which the shift
toward equal roles was perceived to produce increased
earnings for women, F(2, 94) = 12.00, p < .0001, and
decreased earnings for men, F(2, 94) = 3.77, p < .05.
39. Women’s earnings as a percentage of men’s were esti-
mated to be 31.7% in a traditional role system, 76.5% in a
system maintaining today’s division of labor, and 117.1%
in an equal role system.
GENDER-STEREOTYPIC CHARACTERISTICS
The 2 (target sex) × 3 (division of labor) ANOVAs
demonstrated the stereotypicality of all dimensions,
except for the masculine cognitive, by significant main
effects of target sex, ps < .005 or smaller. The main
effect of division of labor also was significant on mascu-
line personality, masculine cognitive, and feminine cog-
nitive, ps < .05, but should be interpreted within the
context of the Target Sex × Division of Labor interac-
tion. Consistent with our hypotheses, this interaction
was significant on those dimensions that showed the
strongest relationships to year in Experiments 1
through 4—specifically, the masculine dimensions
and the feminine personality dimension (see means
and contrasts in Table 6).
For masculine personality characteristics, the inter-
action was significant, F(2, 98) = 17.49, p < .0001.6 Sim-
ple effects analyses within target sex showed a large,
significant increase in these characteristics for female
targets as the division of labor shifted toward equality,
F(2, 98) = 21.87, p < .0001. For masculine cognitive
characteristics, the interaction also was significant,
F(2, 98) = 28.03, p < .0001. Simple effects analyses
revealed that as roles moved toward equality, these
characteristics were perceived to increase sharply in
female targets, F(2, 98) = 25.02, p < .0001, and to
decrease moderately in male targets, F(2, 98) = 6.55,
p < .005. For masculine physical characteristics, the
interaction was again significant, F(2, 98) = 7.42, p <
40. .001. Simple effects analyses showed an increase in
these characteristics in female targets as roles shifted
toward equality, F(2, 98) = 8.51, p < .0005.
The interaction was also significant on feminine
personality characteristics, F(2, 98) = 8.36, p < .0005.
Simple effects analyses revealed that as roles moved
1182 PERSONALITY AND SOCIAL PSYCHOLOGY
BULLETIN
TABLE 6: Experiment 5: Mean Ratings on Gender-Stereotypic
Dimensions by Target Sex and Division of Labor
Masculine Feminine
Target Sex and
Personality Cognitive Physical Personality Cognitive Physical
Division of Labor M SD M SD M SD M SD M SD M SD
Female
Traditional 2.85a 1.39 3.44a 1.01 2.81a 1.32 5.38a 0.84 4.26a
0.89 4.35a 1.19
Same as today 4.32b 0.79 4.57b 0.92 3.75ab 1.17 5.44a 1.10
4.96ab 0.78 4.43a 1.34
Equal 5.44c 1.25 5.79c 1.10 4.46b 1.50 4.90a 1.38 5.29b 1.00
5.01a 1.20
Male
Traditional 5.22a 1.00 5.44a 0.75 4.78a 1.32 2.99a 0.84 3.65a
0.93 3.32a 1.00
Same as today 4.94a 1.47 4.57ab 1.21 4.48a 1.17 3.40a 1.12
3.60a 1.00 3.39a 1.22
Equal 4.53a 0.93 4.28b 0.83 4.25a 1.50 4.53b 1.25 3.90a 1.13
3.19a 1.16
41. NOTE: Ratings were on a 7-point scale on which higher scores
indicate greater likelihood of possessing each characteristic.
Cell ns ranged from 17
to 18 participants. Means within the same target and column
with different subscripts were significantly different as tested
using Bonferroni con-
trasts with a familywise error rate of .05.
at WALDEN UNIVERSITY on March 1,
2016psp.sagepub.comDownloaded from
http://psp.sagepub.com/
toward equality, these characteristics increased in male
targets, F(2, 98) = 9.12, p < .0005. The interaction did not
reach significance on the feminine cognitive or physical
dimensions.
Consistent with our earlier experiments and with the
predictions of social role theory, participants perceived
the characteristics of women and men as malleable. By
manipulating roles rather than allowing participants to
generate their own ideas about role distributions, this
experiment lends additional credence to our assump-
tion that people view women and men as accommodat-
ing their attributes to their social roles. Although the
mention of specific past and present times in the tradi-
tional and same-as-today conditions of the manipulation
of division of labor might have contributed to our find-
ings, this manipulation included detailed information
concerning role distributions. Compared with the ear-
lier experiments’ manipulations of year, this role manip-
ulation produced more extreme findings on some
dimensions, particularly women’s increase and men’s
42. decrease in masculine cognitive characteristics and
men’s increase in feminine personality characteristics.
These results probably occurred because, compared
with the future condition of Experiments 1 through 4,
the role distribution in the condition with an equal divi-
sion of labor was perceived as more nontraditional, pro-
ducing estimates of women’s wages as higher than men’s
wages.
As in previous experiments, our strongest effects were
women’s adoption of masculine characteristics and
men’s adoption of feminine personality characteristics.
The lack of convergence on the feminine physical and
cognitive dimensions is generally consistent with our
first four experiments and suggests that these attributes
are not perceived as under the control of social roles.
Instead, these feminine characteristics may be regarded
as relatively intrinsic to women or at least not easily
shaped by participation in domestic labor and paid
labor.
GENERAL DISCUSSION
These experiments applied social role theory to one of
the most neglected aspects of research on stereotyping—
the question of why stereotypes have certain content—and
moreover revealed the complexity of this content by
showing that perceivers incorporate the implications of
social change into groups’ images. These studies thus
established that stereotypes about social groups can be
dynamic or static. Rather than presenting an image of a
group merely as having certain characteristics, a stereo-
type can portray a group as having a trajectory over the
years as its qualities change. Stereotypes about women
thus portrayed them as extremely dynamic, whereas ste-
43. reotypes about men portrayed them as relatively
unchanging. Specifically, people believe that women of
the present are more masculine than are women of the
past and that women of the future will be more mascu-
line than women of the present, especially in personality
characteristics. This perceived shift in women’s attrib-
utes was not confined to masculine qualities that are
favorably evaluated but encompassed masculine quali-
ties that are unfavorably evaluated.
Belief in complementary change by which men
increase their femininity was not consistently demon-
strated. Although the student participants perceived a
moderate increase in men’s feminine personality quali-
ties, the older participants recruited from airport depar-
ture lounges did not agree. There was more consensus
about the decline of feminine personality characteristics
in women than about their growth in men. Because a
relatively larger tendency for men to take on these com-
munal qualities was projected for the role equality condi-
tion of Experiment 5, perceivers may reason that the
assumption of domestic tasks is necessary to enhance these
qualities. Also, convergence was not consistently projected
for feminine cognitive and physical characteristics.
In general, women and men were perceived to be con-
verging strongly in their masculine personality charac-
teristics and somewhat in their masculine cognitive and
physical characteristics as well as their feminine person-
ality characteristics. These perceived changes are not
arbitrary but reflect the association of male-dominated
occupations with masculine personality characteristics
and the movement of women into these occupations
(Cejka & Eagly, 1999). These results can be viewed with
clarity in Table 7’s quantitative summary of the five
experiments. Valid comparison of the effects across the
44. experiments requires expressing their findings in terms
of a common metric that is independent of number of
participants. The most appropriate metric is the correla-
tion coefficient, r, that corresponds to the linear trends
for the year variable in Experiments 1 through 4 and to
the contrast between the traditional and the equal divi-
sion of labor conditions in Experiment 5 (see Rosenthal &
Rosnow, 1985).
This display of effect sizes shows that the increase in
women’s masculine personality characteristics consis-
tently produced the largest effect sizes. In general,
change in women’s masculine personality, cognitive,
and physical characteristics was more substantial than
was change in men’s or women’s feminine characteris-
tics or men’s masculine characteristics. To summarize
this aspect of the findings, we computed mean effect
sizes (using the r-to-Z transformation) across the three
masculine dimensions and across the three feminine
dimensions separately for each sex of target. Each of
these means included the seven available effect sizes
Diekman, Eagly / STEREOTYPES AS DYNAMIC
CONSTRUCTS 1183
at WALDEN UNIVERSITY on March 1,
2016psp.sagepub.comDownloaded from
http://psp.sagepub.com/
from Experiments 1 through 3 (see Table 7) and
excluded Experiment 3’s effect sizes for negative mascu-
line and feminine characteristics. The means for the lin-
ear trends for female targets’ masculine and feminine
characteristics were .44 and –.05, respectively, and for
45. male targets’ masculine and feminine characteristics
were .03 and .15, respectively. The increase in female tar-
gets’ masculine characteristics was much greater than the
increase in male targets’ masculine characteristics, Z =
5.97, p < .0001, or feminine characteristics, Z = 4.40, p <
.0001. Corresponding to these findings, Experiments 4
and 5 also demonstrated perceived convergence in men
and women on the masculine dimensions, although also
on the feminine personality dimension. Overall, the
data from the five experiments show the perception of
sharp convergence of masculine characteristics, follow-
ing predominantly from women adopting these
characteristics.
Despite the perception of change demonstrated by
these experiments, the division of labor projected for
2050 stopped somewhat short of equality. Also, as shown
most clearly by Experiment 4’s comparative judgments,
equality on masculine and feminine characteristics was
projected for 2050 only on masculine personality and
cognitive qualities and not on feminine qualities or mas-
culine physical qualities. This lack of equality in most
domains, even in 2050, is consistent with much empirical
evidence showing that some aspects of role segregation,
especially occupational segregation and the division of
labor in the home, have changed at what might be con-
sidered a modest pace (e.g., Jacobs, 1989; Shelton, 1992;
Steil, 1997). Our participants thus believed that even
given steady social change, in 2050, women will still be
somewhat overrepresented in roles traditionally held by
women.
IMPLICIT THEORIES OF CHANGE
In the Introduction of this article, we suggested that
to infer the past or future characteristics of group mem-
46. bers, perceivers may first evaluate members’ present
characteristics and then invoke a theory of stability or
change, depending on cues that come to mind. Both
social role theory (Eagly, 1987) and Ross’s (1989)
approach assume that entrance into roles provides an
important cue that guides perceivers’ implicit theories.
Several aspects of our findings support the importance
of roles in participants’ reasoning—in particular, (a) the
parallelism of the findings on role nontraditionalism
and gender-stereotypic characteristics, (b) the success-
ful path models suggesting that inferences about roles
mediated the effects of year on the perceived character-
istics of each sex, and (c) Experiment 5’s demonstration
that differing assumptions about the division of labor
produced different beliefs about these characteristics.
Beliefs about the present characteristics of women
and men can derive from a mix of direct and indirect
observations. In contrast, inferences about the past are
likely based in part on a theory of stability or change, and
inferences about the future would be strongly based on
such a theory. This assumption that implicit theories are
used to draw conclusions about the past and the future
suggests a rather demanding inference process for pro-
jecting group members’ characteristics backward or for-
ward in time, which should be reflected in more consen-
sus about group members’ present characteristics than
about their past or future characteristics. To test this idea
about consensus, we compared the variances of the past,
present, and future experimental conditions for the data
aggregated from Experiments 1 and 2. Within levels of
target sex, variance ratios were computed using the vari-
1184 PERSONALITY AND SOCIAL PSYCHOLOGY
BULLETIN
47. TABLE 7: Summary of Effect Sizes on Gender-Stereotypic
Dimensions
Gender-Stereotypic Experiment 1 Experiment 2 Experiment 3
Experiment 4 Experiment 5
Dimension Female Male Female Male Female Male Comparison
Female Male
Masculine
Personality .54 –.06 .48 .07 .58 .10 .49 .56 –.18
Cognitive .37 .08 .46 .01 .26 .58 –.33
Physical .26 .08 .36 –.06 .25 .38 –.13
Feminine
Personality –.28 .22 –.22 .00 –.10 .12 .28 –.13 .38
Cognitive .12 .18 .17 .12 –.03 .30 .08
Physical –.10 .27 .08 .11 .01 .16 –.03
NOTE: For Experiments 1, 2, and 3, a positive sign for the rs
corresponds to a linear increase in the characteristics across the
years of the design and
a negative sign corresponds to a linear decrease. For
Experiment 4, a positive sign corresponds to a linear increase in
the similarity of the female and
male targets. For Experiment 5, the rs were calculated from the
contrast between the traditional and equal role conditions; a
positive sign corre-
sponds to an increase from traditional roles to equal roles and a
negative sign corresponds to a decrease. Also, for Experiment 3,
on the negative
masculine personality dimension, r = .36 for female targets and
r = .13 for male targets; on the negative feminine personality
dimension, r = –.26 for
female targets and r = .06 for male targets.
48. at WALDEN UNIVERSITY on March 1,
2016psp.sagepub.comDownloaded from
http://psp.sagepub.com/
ance of the present year in the denominator and the vari-
ance of either 1950 or 2050 in the numerator. As
expected, these variance ratios were larger than 1.00 (Ms
of 1.62 for future conditions and 1.62 for past condi-
tions), showing that there was less consensus about the
past or the future than the present.
CONSIDERATIONS OF METHOD
These experiments relied on explicit rather than
implicit measures because people most likely do not pos-
sess as extensive learned associations about men and
women of the past and future as about men and women
of the present, and implicit measures are based on such
associations (e.g., Greenwald, McGhee, & Schwartz,
1998). Given that our methods of assessing gender ste-
reotypes were therefore direct rather than indirect, it is
important to consider the possibility that demand char-
acteristics might have contaminated our findings. The
major concern is that asking about a past or future year
suggested to participants that they should respond in
terms of changed characteristics. If this demand were
inherent in our year manipulation, participants should
have responded in terms of changed characteristics for
both sexes instead of predominantly for women.
Another concern is that responding to the stereotype
measure in terms of changed characteristics might have
suggested corresponding shifts in roles, producing an
artifactual association between stereotypes and roles.
Contrary to this reasoning, even when participants rated
49. men, whom they perceived as changing rather little, they
indicated that role distributions were different in the
past and will be different in the future. There was thus no
general tendency for the past or future cue to cause par-
ticipants to ascribe changed characteristics to the target
sex or for responding in terms of changed or changeless
characteristics to produce a corresponding perception
of changed or changeless social roles. We therefore con-
clude that our methods were appropriate to test our
hypotheses.
THE QUESTION OF ACCURACY
Whether perceivers have an accurate theory of
change in men and women from the past to the present
is an interesting question. The extent to which there is
empirical evidence that North American men and women
have actually converged in their gender-stereotypic
attributes is controversial. Twenge’s (1997b) meta-analy-
sis of self-report measures of masculine and feminine
traits found that women’s masculinity increased linearly
with the studies’ year of publication. Men’s masculinity
showed a somewhat weaker increase with year, and their
femininity increased slightly as well (see also Spence &
Buckner, 2000). Thus, in Twenge’s meta-analysis, as in
our experiments, the greatest change over time was
women’s increase in masculine qualities of personality.
However, Feingold’s (1994) examination of secular
change in sex differences in various personality traits did
not confirm this outcome. Similarly, evidence of conver-
gence in male and female cognitive ability is mixed (see
review by Halpern, 1997). Although actual convergence
in the physical characteristics of the sexes would be diffi-
cult to assess, the marked increase in women’s athletic
participation (National Collegiate Athletic Association,
50. 1997) suggests that women may be physically stronger
than in the past.
Also relevant to accuracy in perceiving change is evi-
dence that gender stereotypes are generally accurate
descriptors of average current sex differences (Eagly &
Diekman, 1997; Hall & Carter, 1999; Swim, 1994). Even
in the context of overall stereotypic accuracy, bias can
occur (Judd & Park, 1993; Jussim, 1991; Lee, Jussim, &
McCauley, 1995). Such systematic bias has been docu-
mented even for gender stereotypes (Beyer, 1999; Eagly,
Diekman, & Kulesa, 2000), for which accuracy may be
especially high because of the extensive contact between
the sexes. Nevertheless, social role theory argues that to
the extent that roles do produce corresponding behav-
iors and that people are accurate observers of the past
and present roles of women and men, they are likely to
be reasonably accurate about changes that have
occurred in the characteristics of women and men.
EXPANDING THINKING ABOUT
STEREOTYPES TO INCLUDE DYNAMISM
This research shows that perceivers do not necessarily
see social groups as having static characteristics. Rather,
perceivers take into account that a group’s situation has
changed, and their best estimate of the future may be
that additional change will occur. This dynamic way of
thinking about women was captured by responses to the
Gallup poll’s question, “In the past 5 years, do you think
that the overall position of women compared to men in
this country has improved, worsened, or remained about
the same?” (Gallup, 1995). A solid majority of Americans
(74% of men and 65% of women) saw the position of
women as improving. This perception presumably
51. reflects changes in women’s roles toward greater equal-
ity and less sex segregation. Given that change in
women’s situation is thus thought to be proceeding
moderately quickly, people are likely to think that society
needs to accommodate this shift in multiple ways.
Because people believe that women are becoming more
assertive, independent, egotistical, dictatorial, rational,
mathematical, and strong, women may even be thought
to be an unstoppable force. The impact of belief in
women’s changes is enhanced by the considerable con-
sensus that exists about these changes. Our experiments
thus showed that these beliefs were shared among public
Diekman, Eagly / STEREOTYPES AS DYNAMIC
CONSTRUCTS 1185
at WALDEN UNIVERSITY on March 1,
2016psp.sagepub.comDownloaded from
http://psp.sagepub.com/
and private university students, women and men, and
students and older adults.
Social psychologists have theorized that stereotypes
act as conservative forces that justify and maintain the
existing relations between dominant and subordinate
groups (Jackman, 1994; Jost & Banaji, 1994; Sidanius,
1993). Our research demonstrates that at least some ste-
reotypes readily encompass the complexity of change
over time. Surely, stereotypes of groups are marked by
their current status (Conway et al., 1996) and by the work
that their members currently do (Cejka & Eagly, 1999;
Eagly & Steffen, 1984; Glick, 1991), but they are also
marked by change in group members’ typical roles and
52. responsibilities. This awareness of change could foster
public policy and private actions that accommodate
these changed characteristics.
Despite the dynamic character of some stereotypes, a
conservative reaction—or backlash—can be triggered
by shifts in role distributions. A group’s rise ordinarily
elicits ambivalence because it poses a threat to society’s
existing norms and arrangements. In the case of women,
considerable research has demonstrated that women’s
adoption of male-dominated roles and masculine behav-
iors is not greeted with universal enthusiasm. Attitudinal
research has shown ambivalence toward women, with
hostile attitudes directed mainly toward nontraditional
women (Glick, Diebold, Bailey-Werner, & Zhu, 1997;
Glick & Fiske, 1996; Haddock & Zanna, 1994). People
who are attitudinally sexist may particularly disapprove
of change on the part of women, consistent with the find-
ing that sexism is associated with negative attitudes
toward feminists (Swim & Cohen, 1997). Also, women
tend to be penalized when adopting the assertive and
self-promoting traits associated with men’s personalities
(see review by Carli & Eagly, 1999). For example, as
shown in Eagly, Makhijani, and Klonsky’s (1992)
meta-analysis of studies examining evaluations of male
and female leadership behavior that was experimentally
equated, women were evaluated less favorably than men
when using directive and autocratic styles. Carli (1990)
demonstrated that female speakers were less persuasive
with male listeners when speaking in an assertive rather
than tentative manner. As research thus demonstrates,
some degree of negative evaluation is surely one of the
penalties that members of dynamic groups are made to
pay as they shed their disadvantage and rise in the social
structure.
53. In conclusion, our findings concerning stereotypes
about women and men of the past, present, and future
are consistent with the assumption that people are
implicit role theorists who believe that personal charac-
teristics, especially personality, adapt to social structure.
When this structure undergoes change, such as women’s
entrance into the paid workforce in large numbers dur-
ing the 20th century, the perceived characteristics of
these new role occupants are believed to change. Very
important are perceivers’ extrapolations of these
changes into the future. Despite some resistance to
change in women’s roles and characteristics, the belief
that women’s personality, cognitive, and physical attrib-
utes will continue to become more like those of men
should increase women’s access to male-dominated
roles and to socialization and training opportunities that
will allow them to assume these roles. Stereotypes can
thus be dynamic forces functioning in the service of
social change.
1186 PERSONALITY AND SOCIAL PSYCHOLOGY
BULLETIN
at WALDEN UNIVERSITY on March 1,
2016psp.sagepub.comDownloaded from
http://psp.sagepub.com/
NOTES
1. For all of the experiments, if participants failed to follow
instruc-
tions appropriately or responded to half or fewer items in a
section,
54. their data were omitted for the relevant measures.
2. A factor analysis performed on the role nontraditionalism
mea-
sure, with data aggregated from Experiments 1 and 2, revealed a
large
first factor (male-dominated roles) and a weak second factor
(female-dominated roles). Because the separate scales produced
from
these factors yielded very similar results in all analyses, we
report find-
ings only on the aggregate measure.
3. In all experiments, additional variables (e.g., sex of
participant,
surveyor, public or private university, age) rarely interacted
with year
on the role nontraditionalism measure or with the crucial Target
Sex ×
Year interaction on the gender-stereotypic dimensions.
Therefore, the
reported analyses were combined across these variables, except
where
noted in the text.
4. Although Experiment 1 revealed a Participant Sex × Year
interac-
tion, F(2, 293) = 12.30, p < .0001, such that the increase in
perceived
nontraditionalism was more pronounced for the female
participants,
this interaction was not replicated in Experiment 2.
5. The perceived shift toward nontraditionalism was more pro-
nounced for female participants, consistent with the significant
Partici-
55. pant Sex × Year interaction, F(4, 246) = 3.29, p < .025, and
congruent
with the similar interaction obtained in Experiment 1.
6. The three-way Target Sex × Division of Labor × Participant
Sex
interaction was significant for masculine personality
characteristics,
F(2, 92) = 3.01, p < .05, and marginal for masculine cognitive
character-
istics, F(2, 92) = 2.54, p < .10. In both cases, female
participants
estimated more extreme change for female targets than did male
participants.
REFERENCES
Bakan, D. (1966). The duality of human existence. Chicago:
Rand
McNally.
Baron, R. M., & Kenny, D. A. (1986). The moderator-mediator
variable
distinction in social psychological research: Conceptual,
strategic,
and statistical considerations. Journal of Personality and Social
Psychol-
ogy, 51, 1173-1182.
Beyer, S. (1999). The accuracy of academic gender stereotypes.
Sex
Roles, 40, 787-813.
Biernat, M. (1995). The shifting standards model: Implications
of stereo-
type accuracy for social judgment. In Y. Lee, L. Jussim, & C. R.
56. McCauley
(Eds.), Stereotype accuracy: Toward appreciating group
differences
(pp. 87-114). Washington, DC: American Psychological
Association.
Biernat, M., & Manis, M. (1994). Shifting standards and
stereotype-
based judgments. Journal of Personality and Social Psychology,
66, 5-20.
Biernat, M., & Wortman, C. (1991). Sharing of home
responsibilities
between professionally employed women and their husbands.
Jour-
nal of Personality and Social Psychology, 60, 844-860.
Brewer, M. B., & Campbell, D. T. (1976). Ethnocentrism and
intergroup
attitudes: East African evidence. New York: Russell Sage.
Carli, L. L. (1990). Gender, language, and influence. Journal of
Personal-
ity and Social Psychology, 59, 941-951.
Carli, L. L., & Eagly, A. H. (1999). Gender effects on influence
and
emergent leadership. In G. N. Powell (Ed.), Handbook of gender
&
work (pp. 203-222). Thousand Oaks, CA: Sage.
Cejka, M. A., & Eagly, A. H. (1999). Gender-stereotypic images
of occu-
pations correspond to the sex segregation of employment.
Personal-
ity and Social Psychology Bulletin, 25, 413-423.
57. Conway, M., Pizzamiglio, M. T., & Mount, L. (1996). Status,
com-
munality, and agency: Implications for stereotypes of gender
and
other groups. Journal of Personality and Social Psychology, 71,
25-38.
Deaux, K., & Lewis, L. L. (1983). Components of gender
stereotypes.
Psychological Documents, 13, 25. (Manuscript no. 2583)
Diekman, Eagly / STEREOTYPES AS DYNAMIC
CONSTRUCTS 1187
APPENDIX
Items in Gender-Stereotypic Dimensions
Masculine Feminine
Negative Negative
Personality Cognitive Physical Personality Personality
Cognitive Physical Personality
competitive good with rugged egotistical affectionate
imaginative cute spineless
numbers
daring analytical muscular hostile sympathetic intuitive
gorgeous gullible
adventurous good at physically cynical gentle artistic beautiful
servile
problem strong
solving
58. aggressive quantitatively burly arrogant sensitive creative pretty
subordinates
skilled self to others
courageousa good at physically boastful supportivea expressivea
petitea whiny
reasoninga vigorousa
dominanta mathematicala brawnya greedy kinda tastefula sexya
complaining
unexcitableb dictatorial nurturingb nagging
stands up under unprincipled warmb fussy
pressureb
NOTE: Unmarked personality, cognitive, and physical items
formed the 4-item scales used in Experiments 2 and 5. The
masculine and feminine
negative personality items were used in Experiment 3 only.
a. These items were added for Experiments 1 and 4’s 6-item
scales.
b. These items were added for Experiment 3’s 8-item scales.
at WALDEN UNIVERSITY on March 1,
2016psp.sagepub.comDownloaded from
http://psp.sagepub.com/
Deaux, K., & Lewis, L. L. (1984). Structure of gender
stereotypes: Inter-
relationships among components and gender label. Journal of
Per-
sonality and Social Psychology, 46, 991-1004.
59. Eagly, A. H. (1987). Sex differences in social behavior: A
social-role interpreta-
tion. Hillsdale, NJ: Lawrence Erlbaum.
Eagly, A. H., & Diekman, A. B. (1997). The accuracy of gender
stereo-
types: A dilemma for feminism. Revue Internationale de
Psychologie
Sociale/International Review of Social Psychology, 10, 11-30.
Eagly, A. H., Diekman, A. B., & Kulesa, P. (2000). Accuracy
and bias in ste-
reotypes about the social and political attitudes of women and
men. Manu-
script submitted for publication.
Eagly, A. H., & Kite, M. E. (1987). Are stereotypes of
nationalities
applied to both women and men? Journal of Personality and
Social Psy-
chology, 53, 451-462.
Eagly, A. H., Makhijani, M. G., & Klonsky, B. G. (1992).
Gender and the
evaluation of leaders: A meta-analysis. Psychological Bulletin,
111,
3-22.
Eagly, A. H., & Steffen, V .J. (1984). Gender stereotypes stem
from the
distribution of women and men into social roles. Journal of
Personal-
ity and Social Psychology, 46, 735-754.
Eagly, A. H., & Steffen, V. J. (1986). Gender stereotypes,
occupational
60. roles, and beliefs about part-time employees. Psychology of
Women
Quarterly, 10, 252-262.
Eagly, A. H., Wood, W., & Diekman, A. B. (2000). Social role
theory of
sex differences and similarities: A current appraisal. In T. Eckes
&
H. M. Trautner (Eds.), The developmental social psychology of
gender
(pp. 123-174). Mahwah, NJ: Lawrence Erlbaum.
Feingold, A. (1994). Gender differences in personality: A meta-
analy-
sis. Psychological Bulletin, 116, 429-456.
Feldman, J. M. (1972). Stimulus characteristics and subject
prejudice
as determinants of stereotype attribution. Journal of Personality
and
Social Psychology, 21, 333-340.
Gallup, G., Jr. (1995). The Gallup poll. Wilmington, DE:
Scholarly
Resources.
Glick, P. (1991). Trait-based and sex-based discrimination in
occupa-
tional prestige, occupational salary, and hiring. Sex Roles, 25,
351-378.
Glick, P., Diebold, J., Bailey-Werner, B., & Zhu, L. (1997). The
two faces
of Adam: Ambivalent sexism and polarized attitudes toward
women. Personality and Social Psychology Bulletin, 23, 1323-
1334.
61. Glick, P., & Fiske, S. T. (1996). The Ambivalent Sexism
Inventory: Dif-
ferentiating hostile and benevolent sexism. Journal of
Personality and
Social Psychology, 70, 491-512.
Greenwald, A. G., McGhee, D. E., & Schwartz, J.L.K. (1998).
Measuring
individual differences in implicit cognition: The Implicit
Associa-
tion Test. Journal of Personality and Social Psychology, 74,
1464-1480.
Haddock, G., & Zanna, M. P. (1994). Preferring “housewives”
to “femi-
nists.” Psychology of Women Quarterly, 18, 25-52.
Hall, J. A., & Carter, J. D. (1999). Gender-stereotype accuracy
as an indi-
vidual difference. Journal of Personality and Social Psychology,
77,
350-359.
Halpern, D. F. (1997). Sex differences in intelligence:
Implications for
education. American Psychologist, 52, 1091-1102.
Hayghe, H. (1990). Family members in the work force. Monthly
Labor
Review, 113(3), 14-19.
Hoffman, C., & Hurst, N. (1990). Gender stereotypes:
Perception or
rationalization? Journal of Personality and Social Psychology,
58,
62. 197-208.
Jackman, M. R. (1994). The velvet glove: Paternalism and
conflict in gender,
class, and race relations. Berkeley: University of California
Press.
Jacobs, J. A. (1989). Revolving doors: Sex segregation and
women’s careers.
Stanford, CA: Stanford University Press.
Johnson, P. (1976). Women and power: Toward a theory of
effective-
ness. Journal of Social Issues, 32, 99-110.
Jones, J. M. (1988). Cultural differences in temporal
perspectives:
Instrumental and expressive behaviors in time. In J. E. McGrath
(Ed.), The social psychology of time: New perspectives (pp. 21-
38).
Newbury Park, CA: Sage.
Jost, J. T., & Banaji, M. R. (1994). The role of stereotyping in
system-
justification and the production of false consciousness. British
Jour-
nal of Social Psychology, 33, 1-27.
Judd, C. M., & Park, B. (1993). Definition and assessment of
accuracy
in social stereotypes. Psychological Review, 100, 109-128.
Jussim, L. (1991). Social perception and social reality: A
reflection-con-
struction model. Psychological Review, 98, 54-73.
63. Karlins, M., Coffman, T. L., & Walters, G. (1969). On the
fading of
social stereotypes: Studies in three generations of college
students.
Journal of Personality and Social Psychology, 13, 1-16.
Keppel, G. (1991). Design and analysis: A researcher’s
handbook.
Englewood Cliffs, NJ: Prentice Hall.
Kite, M. E. (1996). Age, gender, and occupational label: A test
of social
role theory. Psychology of Women Quarterly, 20, 361-374.
Lee, Y., Jussim, L. J., & McCauley, C. R. (1995). Stereotype
accuracy:
Toward appreciating group differences. Washington, DC:
American Psy-
chological Association.
LeVine, R. A., & Campbell, D. T. (1972). Ethnocentrism:
Theories of con-
flict, ethnic attitudes, and group behavior. New York: John
Wiley.
Lips, H. M. (1991). Women, men, and power. Mountain View,
CA:
Mayfield.
Lueptow, L. B., Garovich, L., & Lueptow, M. B. (1995). The
persistence
of gender stereotypes in the face of changing sex roles:
Evidence
contrary to the sociocultural model. Ethology and Sociobiology,
16,
509-530.
64. National Collegiate Athletic Association. (1997). Participation
statistics
report: 1982-1996. Overland Park, KS: Author.
Reskin, B. F., & Roos, P. A. (1990). Job queues, gender queues:
Explaining
women’s inroads into male occupations. Philadelphia: Temple
Univer-
sity Press.
Rosenthal, R., & Rosnow, R. (1985). Contrast analysis: Focused
compari-
sons in the analysis of variance. New York: Cambridge
University Press.
Ross, M. (1989). Relation of implicit theories to the
construction of
personal histories. Psychological Review, 96, 341-357.
Ross, M., & Newby-Clark, I. R. (1998). Construing the past and
the
future. Social Cognition, 16, 133-150.
Shelton, B. A. (1992). Women, men, and time: Gender
differences in paid
work, housework, and leisure. New York: Greenwood.
Sidanius, J. (1993). The psychology of group conflict and the
dynam-
ics of oppression: A social dominance perspective. In S. Iyengar
&
W. J. McGuire (Eds.), Explorations in political psychology (pp.
183-219).
Durham, NC: Duke University Press.
65. Smedley, J. W., & Bayton, J. A. (1978). Evaluative race-class
stereotypes
by race and perceived class of subjects. Journal of Personality
and
Social Psychology, 36, 530-535.
Spence, J. T., & Buckner, C. E. (2000). Instrumental and
expressive
traits, trait stereotypes, and sexist attitudes: What do they
signify?
Psychology of Women Quarterly, 24, 44-62.
Spence, J. T., Helmreich, R. L., & Holahan, C. K. (1979).
Negative and
positive components of psychological masculinity and
femininity
and their relationships to self-reports of neurotic and acting out
behaviors. Journal of Personality and Social Psychology, 37,
1673-1682.
Steil, J. M. (1997). Marital equality: Its relationship to the well-
being of hus-
bands and wives. Thousand Oaks, CA: Sage.
Stephan, W. G., & Rosenfeld, D. (1982). Racial and ethnic
stereotypes.
In A. G. Miller (Ed.), In the eye of the beholder: Contemporary
issues in ste-
reotyping (pp. 92-136). New York: Praeger.
Swim, J. K. (1994). Perceived versus meta-analytic effect sizes:
An assess-
ment of the accuracy of gender stereotypes. Journal of
Personality and
Social Psychology, 66, 21-36.
66. Swim, J. K., & Cohen, L. L. (1997). Overt, covert, and subtle
sexism: A
comparison between the Attitudes Toward Women and Modern
Sexism Scales. Psychology of Women Quarterly, 21, 103-118.
Twenge, J. M. (1997a). Attitudes toward women, 1970-1995.
Psychology
of Women Quarterly, 21, 35-51.
Twenge, J. M. (1997b). Changes in masculine and feminine
traits over
time: A meta-analysis. Sex Roles, 36, 305-325.
U.S. Department of Labor. (1999). Labor force statistics from
the current
population survey. Retrieved May 25, 1999, from Bureau of
Labor Sta-
tistics database (series IDs LFU600001 and LFU600002) on the
World Wide Web: http://146.142.4.24/cgi-bin/srgate.
Received March 3, 1999
Revision accepted May 19, 1999
1188 PERSONALITY AND SOCIAL PSYCHOLOGY
BULLETIN
at WALDEN UNIVERSITY on March 1,
2016psp.sagepub.comDownloaded from
http://psp.sagepub.com/
Course MAT510_Week 8: Business Statistics- Using Process
Experimentation to Build Models
Slide #
Slide Title
Slide Narration
67. Slide 1
Introduction
Welcome to Business Statistics.
In this lesson, we will learn about building and using models.
Slide 2
Topics
The following topics will be covered in this lesson:
Why Do We Need a Statistical Approach?
Examples of Process Experiments;
Statistical Approach to Experimentation;
Two-Factor Experiments: A Case Study;
Three-Factor Experiments: A Case Study;
Larger Experiments, and
Blocking, Randomization, and Center Points
Slide 3
Why Do We Need a Statistical Approach?
One of the most critical steps to understanding the process and
providing improvement to the process is to gather quality data
of the process. Using existing data may not be adequate for the
process improvement objective. Therefore, we will design a
process improvement experiment so that we can collect the data
needed and sample frequency desired for process improvement
tasks. We call this the design of experiment. The purpose of
the design of experiment is to collect quality data. In addition,
the design of experiment provides a systematic approach on data
collection and controls nuisance variables. Nuisance variables
are variables that affect the process outcomes, but are not a
regular part of the process. For example, if you want to record
a voice-over in a home studio and have a next door neighbor
that makes a lot of noise, the nuisance variable is the noise
being made by your neighbor, which is affecting the recording.
In design of experiment, we can also identify key drivers of the
process and quantify their effects to the process results. In
68. analyzing data collected from the experiment, we can measure
uncertainties and characterize interactions among drivers.
Traditionally, we use a one-factor-at-a-time approach for
evaluating responses caused by process variables. This
approach could be very time consuming. More importantly, it
assumes that there is only one maximum or one minimum on the
response curve and there is no interaction among process
variables. As we know that is not necessarily true in many
business processes.
Slide 4
Examples of Process Experiments
Let us use an example to illustrate the concept of design of
experiment. In this example, we will try to make the best
chocolate drink. Three factors are considered in this
experiment: the level of chocolate from very low content (0) to
extremely high (overpowering, 10), the creaminess of the drink,
and the thickness of the drink. We will use a two-level
experiment, which means we will use two levels in each of the
three factors. For example, if we choose a medium high
chocolate content (7) and medium low (3) for the first
experiment, we then need a taster to taste the drink and score
how much he/she likes the drink. The results are shown on the
left table. We note that the best results from experiment #1 are
test #8 where the chocolate is 7, creaminess is 7 and thickness
is 5. The score for the best tasting chocolate drink is 78. We
can repeat the experiment for the second time based on results
from the first experiment. Please note, we always repeat the
best result from the previous experiment in the following
experiment so that we can further confirm the result. We
repeated the experiment for three rounds and found the drink
mixes with the best score. In this experiment, the best score
reached 93. The creaminess of the drink is 8, chocolate power
is 6 and the thickness is 4.
Slide 5
Statistical Approach to Experimentation
Interaction Slide
69. Introduction: Before conducting the experiment, we need to
carefully plan the test. Key steps in planning the experiment
include the following: Click on each tab to learn more about the
key steps.
1.Clear statement of the problem. We need to design our
experiment to answer the questions we have on process
improvement.
2. Control our budget in each experiment. As seen in the
previous example, we may need to perform sequential
experiments to reach our objective, we must allow budgets for
further experiments, (typically, we should allow no more than
20% of the budget for our first experiment).
3. Collect background information so that we do not waste time
re-inventing the wheel.
4. When we design the experiment, we need to get all parties to
buy-in. They need to review the design and voice their
concerns.
5. Provide clear instructions on conducting the experiment and
collect experimental data.
6. Provide knowledge and tools to analyze the data and report
our findings in the experiment.
Slide 6
Two-Factor Experiments: A Case Study
We will use an example to illustrate detailed steps in
performing a two level and two factor (factorial) design of
experiment. In this example, we want to find out whether
providing scripts and/or training to the callers are helpful to
improve telemarketing sales. The two factors are scripts and
training. The two levels are yes and no. All possible
combinations are shown on the upper left table. The test is
conducted by 4 groups and each group has 5 people. The result
of their sales success rates is shown in the lower right table.
For example, test group 1 received no script and no training;
their success rate is 10.8%. Test group #4 received both scripts