Download to read offline
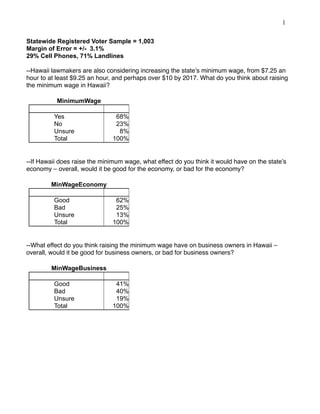

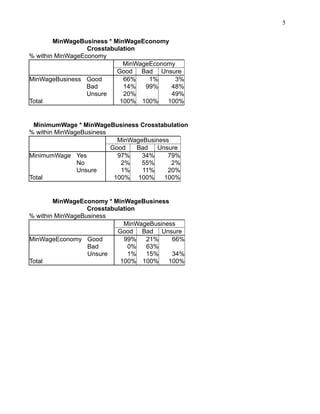
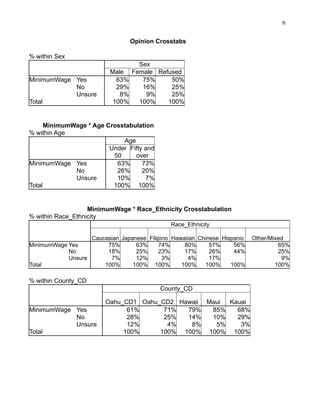
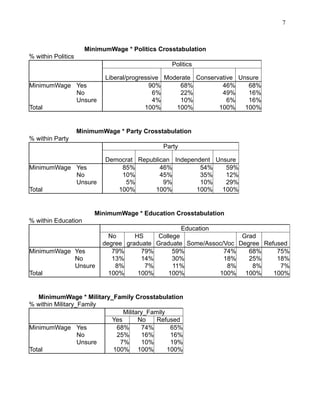
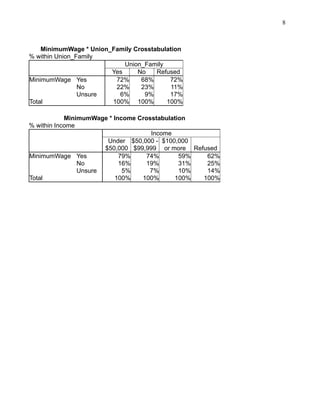
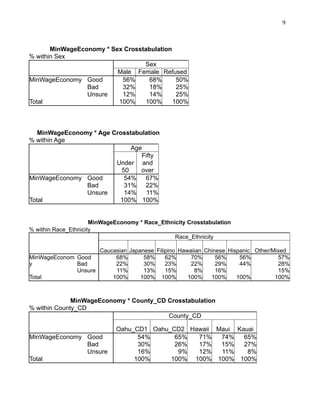
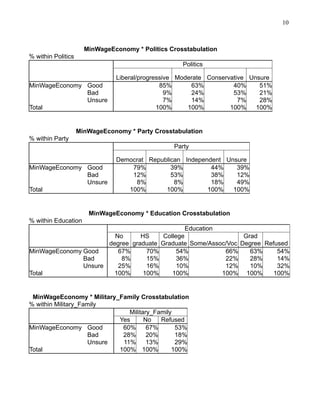
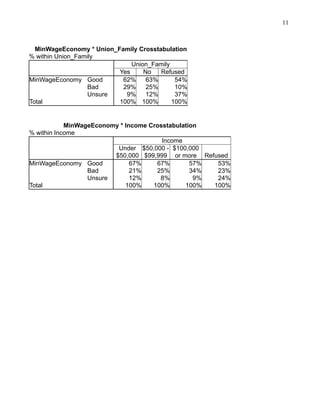
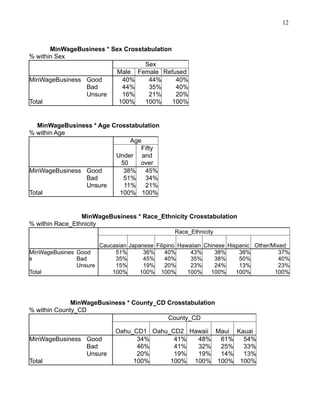


A survey of 1003 Hawaii residents found that 68% support raising the state's minimum wage, with 62% believing it would have a positive impact on the economy overall and 41% believing it would be good for business owners. Support was higher among Democrats, younger residents, and those on Oahu. 62% thought it would be good for the economy but views were more divided on the impact on businesses, with 41% saying it would be good and 40% saying it would be bad for businesses.


