Civil Beat January 2016 Rail Poll
•
1 like•2,965 views

A survey of how Hawaii voters feel about the controversial project.

Recommended
Recommended
More Related Content
What's hot
What's hot (20)
Similar to Civil Beat January 2016 Rail Poll
Similar to Civil Beat January 2016 Rail Poll (20)
More from Honolulu Civil Beat
More from Honolulu Civil Beat (20)
Recently uploaded
Recently uploaded (20)
Civil Beat January 2016 Rail Poll
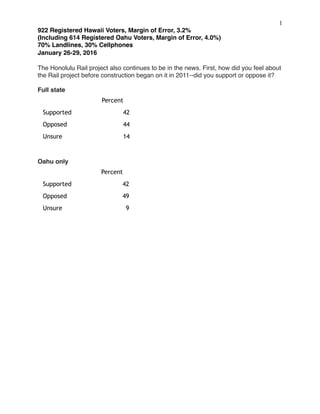
- 1. !1 922 Registered Hawaii Voters, Margin of Error, 3.2% (Including 614 Registered Oahu Voters, Margin of Error, 4.0%) 70% Landlines, 30% Cellphones January 26-29, 2016 The Honolulu Rail project also continues to be in the news. First, how did you feel about the Rail project before construction began on it in 2011--did you support or oppose it? Full state Oahu only Percent Supported 42 Opposed 44 Unsure 14 Percent Supported 42 Opposed 49 Unsure 9
- 2. !2 922 Registered Hawaii Voters, Margin of Error, 3.2% (Including 614 Registered Oahu Voters, Margin of Error, 4.0%) 70% Landlines, 30% Cellphones January 26-29, 2016 Full state RailThen * Gender Crosstabulation % within Gender Gender Male Female RailThen Supported 44% 40% Opposed 45% 43% Unsure 10% 16% Total 100% 100% RailThen * Race_Ethnicity Crosstabulation % within Race_Ethnicity Race_Ethnicity Caucasian Japanese Filipino Hawaiian Chinese Hispanic Other/ Mixed RailThen Supported 46% 43% 44% 35% 27% 64% 41% Opposed 40% 46% 41% 53% 55% 36% 45% Unsure 14% 11% 15% 12% 18% 15% Total 100% 100% 100% 100% 100% 100% 100% RailThen * Age_Group Crosstabulation % within Age_Group Age_Group Under 50 50 or older RailThen Supported 47% 41% Opposed 32% 50% Unsure 21% 10% Total 100% 100% RailThen * County_CD Crosstabulation
- 3. !3 922 Registered Hawaii Voters, Margin of Error, 3.2% (Including 614 Registered Oahu Voters, Margin of Error, 4.0%) 70% Landlines, 30% Cellphones January 26-29, 2016 % within County_CD County_CD Oahu_1 Oahu_2 Hawaii Maui Kauai RailThen Supported 43% 39% 44% 36% 56% Opposed 48% 53% 34% 41% 20% Unsure 9% 8% 22% 23% 24% Total 100% 100% 100% 100% 100% RailThen * Politics Crosstabulation % within Politics Politics Liberal Moderate Conservativ e Unsure RailThen Supported 50% 49% 32% 36% Opposed 37% 40% 61% 39% Unsure 14% 11% 7% 25% Total 100% 100% 100% 100%
- 4. !4 922 Registered Hawaii Voters, Margin of Error, 3.2% (Including 614 Registered Oahu Voters, Margin of Error, 4.0%) 70% Landlines, 30% Cellphones January 26-29, 2016 RailThen * Party Crosstabulation % within Party Party Democrat Republica n Independen t Unsure RailThen Supported 49% 38% 36% 31% Opposed 36% 55% 53% 42% Unsure 15% 7% 12% 27% Total 100% 100% 100% 100% RailThen * Income Crosstabulation % within Income Income Less than $50,000 $50,000- $100,000 More than $100,000 Refused RailThen Supported 33% 44% 57% 39% Opposed 53% 43% 34% 43% Unsure 14% 13% 9% 18% Total 100% 100% 100% 100% RailThen * Ige Crosstabulation % within Ige Ige Positive Negative Unsure RailThen Supported 55% 35% 36% Opposed 33% 60% 41% Unsure 13% 5% 23% Total 100% 100% 100% RailThen * Caldwell Crosstabulation % within Caldwell
- 5. !5 922 Registered Hawaii Voters, Margin of Error, 3.2% (Including 614 Registered Oahu Voters, Margin of Error, 4.0%) 70% Landlines, 30% Cellphones January 26-29, 2016 Caldwell Positive Negative Unsure RailThen Supported 61% 23% 38% Opposed 32% 71% 31% Unsure 7% 5% 31% Total 100% 100% 100%
- 6. !6 922 Registered Hawaii Voters, Margin of Error, 3.2% (Including 614 Registered Oahu Voters, Margin of Error, 4.0%) 70% Landlines, 30% Cellphones January 26-29, 2016 And how do you feel about the rail project now? Would you say it was a good idea and is progressing well? That it was a good idea, but its execution, including cost overruns and excise tax extensions on Oahu to cover them are troubling? Or would you say that it was a bad idea? Full state Oahu only Percent Good 16 Troubling 42 Bad 36 Unsure 7 Percent Good 15 Troubling 41 Bad 41 Unsure 3
- 7. !7 922 Registered Hawaii Voters, Margin of Error, 3.2% (Including 614 Registered Oahu Voters, Margin of Error, 4.0%) 70% Landlines, 30% Cellphones January 26-29, 2016 Full state RailNow * Gender Crosstabulation % within Gender Gender Male Female RailNow Good 17% 14% Troubling 40% 44% Bad 39% 33% Unsure 4% 9% Total 100% 100% RailNow * Race_Ethnicity Crosstabulation % within Race_Ethnicity Race_Ethnicity Caucasian Japanese Filipino Hawaiian Chinese Hispanic Other/ Mixed RailNow Good 18% 14% 23% 11% 12% 25% 12% Troubling 44% 40% 33% 44% 45% 50% 42% Bad 32% 39% 36% 38% 43% 25% 36% Unsure 7% 7% 8% 6% 10% Total 100% 100% 100% 100% 100% 100% 100% RailNow * Age_Group Crosstabulation % within Age_Group Age_Group Under 50 50 or older RailNow Good 18% 15% Troubling 44% 41% Bad 28% 40% Unsure 11% 4%
- 8. !8 922 Registered Hawaii Voters, Margin of Error, 3.2% (Including 614 Registered Oahu Voters, Margin of Error, 4.0%) 70% Landlines, 30% Cellphones January 26-29, 2016 Total 100% 100% RailNow * County_CD Crosstabulation % within County_CD County_CD Oahu_1 Oahu_2 Hawaii Maui Kauai RailNow Good 14% 16% 23% 10% 22% Troubling 43% 35% 37% 44% 60% Bad 40% 43% 27% 29% 11% Unsure 3% 5% 14% 17% 7% Total 100% 100% 100% 100% 100%
- 9. !9 922 Registered Hawaii Voters, Margin of Error, 3.2% (Including 614 Registered Oahu Voters, Margin of Error, 4.0%) 70% Landlines, 30% Cellphones January 26-29, 2016 RailNow * Politics Crosstabulation % within Politics Politics Liberal Moderate Conservativ e Unsure RailNow Good 24% 17% 9% 10% Troubling 42% 46% 38% 43% Bad 29% 31% 50% 36% Unsure 6% 7% 3% 12% Total 100% 100% 100% 100% RailNow * Party Crosstabulation % within Party Party Democrat Republica n Independen t Unsure RailNow Good 18% 15% 12% 10% Troubling 48% 34% 39% 29% Bad 27% 45% 48% 39% Unsure 7% 6% 1% 22% Total 100% 100% 100% 100% RailNow * Income Crosstabulation % within Income Income Less than $50,000 $50,000- $100,000 More than $100,000 Refused RailNow Good 15% 18% 16% 13% Troubling 40% 40% 49% 41% Bad 39% 34% 32% 39% Unsure 7% 8% 4% 7%
- 10. !10 922 Registered Hawaii Voters, Margin of Error, 3.2% (Including 614 Registered Oahu Voters, Margin of Error, 4.0%) 70% Landlines, 30% Cellphones January 26-29, 2016 Total 100% 100% 100% 100%
- 11. !11 922 Registered Hawaii Voters, Margin of Error, 3.2% (Including 614 Registered Oahu Voters, Margin of Error, 4.0%) 70% Landlines, 30% Cellphones January 26-29, 2016 RailNow * Ige Crosstabulation % within Ige Ige Positive Negative Unsure RailNow Good 23% 11% 12% Troubling 49% 36% 40% Bad 22% 52% 33% Unsure 6% 1% 15% Total 100% 100% 100% RailNow * Caldwell Crosstabulation % within Caldwell Caldwell Positive Negative Unsure RailNow Good 27% 3% 15% Troubling 48% 33% 43% Bad 23% 64% 23% Unsure 3% 0% 19% Total 100% 100% 100% RailNow * RailThen Crosstabulation % within RailThen RailThen Supported Opposed Unsure RailNow Good 32% 3% 9% Troubling 62% 22% 46% Bad 5% 74% 7% Unsure 2% 2% 38% Total 100% 100% 100%
- 12. !12 922 Registered Hawaii Voters, Margin of Error, 3.2% (Including 614 Registered Oahu Voters, Margin of Error, 4.0%) 70% Landlines, 30% Cellphones January 26-29, 2016
- 13. !13 922 Registered Hawaii Voters, Margin of Error, 3.2% (Including 614 Registered Oahu Voters, Margin of Error, 4.0%) 70% Landlines, 30% Cellphones January 26-29, 2016 Demographics Gender Age Group Race/Ethnicity Percent Male 48 Female 52 Percent Under 50 27 50 or older 73 Percent Caucasian 37 Japanese 28 Filipino 9 Hawaiian 10 Chinese 6 Hispanic 1 Other/Mixed 10
- 14. !14 922 Registered Hawaii Voters, Margin of Error, 3.2% (Including 614 Registered Oahu Voters, Margin of Error, 4.0%) 70% Landlines, 30% Cellphones January 26-29, 2016 Political Ideology Party I.D. Household Income Percent Liberal 25 Moderate 34 Conservative 25 Unsure 17 Percent Democrat 52 Republican 21 Independent 22 Unsure 6 Percent Less than $50,000 27 $50,000-$100,000 33 More than $100,000 22 Refused 19