CHAPTER 13
Case Study 1
Training and Development
Now let us put all the pieces together by stepping through a complete BPI project that I completed for a major bank I call BB&Z. We have all read stories about how someone lost weight, climbed a difficult mountain, or ran a marathon. If you are like me, you find them inspiring because reading what others went through helps me realize that I can do things I might previously have thought were impossible. I chose this case because it introduces several new bends in the road and demonstrates how you can adapt the ten steps to any situation. As we move through the study, you can reference the previous chapters in this book for clarification or for additional details. Hopefully, this case study motivates you and jump-starts you on your own road to improving business processes.
BACKGROUND
Pam Borzak, senior vice president of human resources for BB&Z, called me for help with improving the business processes in her organization. As a result of that call, I spent the next year tackling each business process within her departments. Because Pam had responsibility for all the human resource functions, we decided to start her process inventory at the department level to decide which of the human resource departments we should start with first.
STEP 1: DEVELOP THE PROCESS INVENTORY
In Chapter 2, we built the business process inventory, created prioritization criteria, applied the criteria to each process, and created a process prioritization table that summarized the business processes. We did all that in one table to enable a process-by-process comparison, which then helped us decide where to start our improvement efforts.
I proceeded the same way in Pam’s case, only this time I built the process inventory at her department level and applied the prioritization criteria used in Chapter 2 to the list of human resource departments. As you recall, the four main categories of prioritization criteria we used in Chapter 2 are impact, implementation, current state, and value.
I used the same 1–3 scale from Chapter 2 to keep the scoring simple and did not apply any weighting to the criteria.
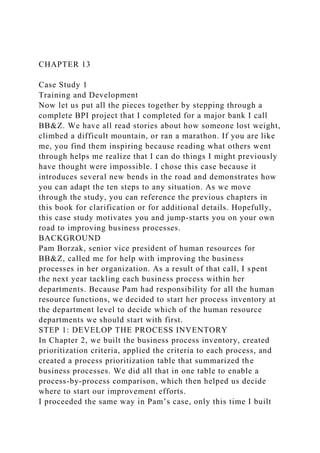
Figure 13-1 shows the completed process prioritization table for Pam’s human resource organization. This table shows that we should initially focus on the business processes within training and development (T&D) because that department has the highest total score (20). The high score for T&D resulted from the bank’s ongoing acquisition of other financial institutions through mergers, forcing Pam’s organization to have to continually integrate new employees into the company. You can see that the merger and acquisition focus is the driving force behind all four categories. Looking at the categories across the T&D row in Figure 13-1 leads to the following observations:
Many employees are affected by the T&D processes (Impact).
It will not take too long or require too much money to make the necessary changes, and the next cycle appe ...
CHAPTER 13Case Study 1Training and DevelopmentNow let us p.docx
1. CHAPTER 13
Case Study 1
Training and Development
Now let us put all the pieces together by stepping through a
complete BPI project that I completed for a major bank I call
BB&Z. We have all read stories about how someone lost weight,
climbed a difficult mountain, or ran a marathon. If you are like
me, you find them inspiring because reading what others went
through helps me realize that I can do things I might previously
have thought were impossible. I chose this case because it
introduces several new bends in the road and demonstrates how
you can adapt the ten steps to any situation. As we move
through the study, you can reference the previous chapters in
this book for clarification or for additional details. Hopefully,
this case study motivates you and jump-starts you on your own
road to improving business processes.
BACKGROUND
Pam Borzak, senior vice president of human resources for
BB&Z, called me for help with improving the business
processes in her organization. As a result of that call, I spent
the next year tackling each business process within her
departments. Because Pam had responsibility for all the human
resource functions, we decided to start her process inventory at
the department level to decide which of the human resource
departments we should start with first.
STEP 1: DEVELOP THE PROCESS INVENTORY
In Chapter 2, we built the business process inventory, created
prioritization criteria, applied the criteria to each process, and
created a process prioritization table that summarized the
business processes. We did all that in one table to enable a
process-by-process comparison, which then helped us decide
where to start our improvement efforts.
I proceeded the same way in Pam’s case, only this time I built
2. the process inventory at her department level and applied the
prioritization criteria used in Chapter 2 to the list of human
resource departments. As you recall, the four main categories of
prioritization criteria we used in Chapter 2 are impact,
implementation, current state, and value.
I used the same 1–3 scale from Chapter 2 to keep the scoring
simple and did not apply any weighting to the criteria.
Figure 13-1 shows the completed process prioritization table for
Pam’s human resource organization. This table shows that we
should initially focus on the business processes within training
and development (T&D) because that department has the highest
total score (20). The high score for T&D resulted from the
bank’s ongoing acquisition of other financial institutions
through mergers, forcing Pam’s organization to have to
continually integrate new employees into the company. You can
see that the merger and acquisition focus is the driving force
behind all four categories. Looking at the categories across the
T&D row in Figure 13-1 leads to the following observations:
Many employees are affected by the T&D processes (Impact).
It will not take too long or require too much money to make the
necessary changes, and the next cycle appears imminent because
of an upcoming merger (Implementation).
The T&D processes have an average client satisfaction and pain
level (Current State).
If new employees can quickly get immersed in the existing
culture, the process will deliver a benefit to the
bank (Benefit/Return).
Figure 13-1 BB&Z Process Prioritization Table: Human
Resource Functions
Once we decided to start by focusing on training and
development, I built the department’s process inventory by
listing all the T&D business processes. Figure 13-2 shows the
process prioritization table I created for BB&Z’s T&D
department. The figure shows the common business processes
one might find in a training and development department,
3. including:
Curriculum Development, which includes designing and
developing curricula and courses
Forecasting/Scheduling, which involves estimating student
demand and developing a class schedule to meet the demand
Enrollment, which allows students to enroll in a learning event
Delivery, which includes the facilitation of a class, either by an
instructor or by alternative methods
Resource Management, which involves securing all materials,
equipment, and facilitators required to deliver training
Evaluation, which assesses the impact of training
Budgeting, which tracks all spending
Based on the results of the process prioritization table in Figure
13-2, I normally would start with the delivery process because it
has the highest score (24), but before moving to the next step, I
reviewed the results of this exercise with Pam. I expressed
concern that the score given to delivery may be because it is
one of the only business processes, besides enrollment, that her
clients experience. All other processes reflect the internal
workings in the department, not visible to clients.
At this point, a bend in the road occurred in my work with Pam.
I encouraged her to think about the lack of client interaction
throughout the process, and she agreed not to rush in and start
with the delivery process just yet but rather to take a fresh look
at how her organization functioned and interfaced with the
client. Pam agreed that her key goal was making sure that her
organization delivered training that supported the company’s
business objectives. As a result of our discussion, we decided to
take a high-level look at the training and development process
before getting into the details of any single business process.
Figure 13-2 BB&Z Process Prioritization Table: Training and
Development Group
The change in direction meant that I had to adjust how we
approached step 2, building the foundation. Any change you
make along the way subsequently causes other changes down
4. the line as you move through the roadmap, and these changes
are perfectly acceptable. In Pam’s case, instead of developing a
scope definition document on the delivery process, we created
one for the entire training and development process.
The roadmap is a flexible and dynamic tool that provides
overall direction on how to perform business process
improvement work, and you can adapt it to changing
circumstances.
STEP 2: ESTABLISH THE FOUNDATION
In Chapter 3 we learned that in this step we create the scope
definition document to establish the boundaries for the business
process, so we can stay on track and avoid scope creep. At this
point, you also form the project team, if necessary. Because we
chose to look at the end-to-end training and development
process, Pam elected to include on the team her training and
development director, a delivery manager, an instructor, two
instructional designers, one of her training specialists who
helped with resource scheduling, and her business manager.
During the initial project team meeting, I walked the group
through the roadmap in Chapter 1 (Figure 1-1) so they could see
the steps we would go through and provide them with an
opportunity to ask questions. Pam joined us for the first 15
minutes of the initial team meeting.
After reviewing the objectives of business process
improvement, covered in Chapter 1, and answering the project
team’s questions, we moved on to setting the foundation for our
work. All team members had a copy of the blank scope
definition document so they could see the information we would
discuss. I kept track of the team’s conversation on an electronic
dry-erase board so everyone could see the results of our
conversation. Figure 13-3 shows the completed scope definition
document the team created for the training and development
process.
A look at the scope definition document tells us a great deal.
We can see where the project team decided to start and end the
process by reading the Scope (boundaries) section. It starts
5. when Pam’s organization works with the Finance department to
establish T&D’s annual budget and ends when Pam’s
management team reviews the annual summary of course
evaluation results.
While reviewing the scope definition document with Pam after
the first meeting, we made a few changes. Pam wanted to make
it explicit that, going forward, business goals will drive where
she invests her budget and she wanted to add another
measurement of success related to return on investment. As a
result, I added another sentence to the description stating that
business goals drive training investments and a fifth
measurement to show a linkage between the business goals and
training. Figure 13-4shows the updated scope definition
document with these two additions (updated Description and a
new Measurement of success).
At the second project team meeting, I reviewed the formatted
scope definition document with the team and highlighted the
changes that Pam and I made to
the Description and Measurements of success. Because this is
the first time the team sees the document typed, it seems more
formal, and you should feel comfortable making edits. At our
meeting, the team expressed concern over how to measure the
linkage of training to business goals. I urged them to wait and
discuss the how when we moved to step 7 on the roadmap,
which addresses establishing metrics. This kept the team from
veering off course. As side questions emerge in the meetings,
refer to the roadmap to show how you will address a question at
a later time. This assures participants that you heard them and
you will not overlook their concerns.
Once the project team felt comfortable with the scope definition
document, we moved to step 3 and began drawing the process
map.
Figure 13-3 BB&Z Preliminary Scope Definition Document
Figure 13-4 BB&Z Final Scope Definition Document
6. STEP 3: DRAW THE PROCESS MAP
As pointed out in Chapter 4, drawing the process map in step 3
gives the project team a tool to help them understand the end-
to-end business process, shows them where handoffs occur
between departments, and provides a background to apply the
improvement techniques in step 6.
You may recall that, in this step, you decide whether to draw a
standard or cross-functional process map, depending on how
you plan to use the information, and select the level of detail
for the map. You can draw a high-level map or a detailed
process map.
In Pam’s case, I decided to draw a high-level process map for
three reasons:
1.Her organization had limited shared understanding of the end-
to-end business process.
2.The process had numerous subprocesses, making it complex.
3.This level of detail would provide Pam with an overall view
of the entire process.
Deciding to start at a high level of detail leads to both positive
and negative repercussions for the facilitator. On the one hand,
this decision makes it easier to draw the process map because
you do not need a detailed level of understanding and you can
do so quickly. On the other hand, managing the project team
becomes more difficult because part of the team almost always
likes to delve into detail. Although you will hear various,
reasonable-sounding explanations for the need to go deeper,
recognize that the root of team members’ anxiety usually
revolves around not seeing their own job reflected in the
process map. Your challenge, as the facilitator, becomes
keeping everyone grounded and feeling secure.
To draw Pam’s high-level process map, the team met for three
hours every week for four weeks to create the two-page, high-
level process map shown in Figures 13-5 and 13-6. Between
meetings, I created and updated the process map using
Microsoft Visio.
7. Figure 13-5 BB&Z Training and Development Process: Process
Map (Part 1)
Figure 13-6 BB&Z Training and Development Process: Process
Map (Part2)
Notice in these two figures that the process map spans two
pages because it did not fit onto a single page; notice how I
used the two types of connectors discussed in Chapter
4 (Figures 4-26 and 4-27). The connector symbols help readers
understand how to follow the process map by telling them where
to move next. I used the off-page connector in Figure 13-5 to
tell the reader to move to page 2, activity 8, after estimating the
annual budget in activity 7. Also notice the off-page connector
in Figure 13-6 entering activity 8, which lets the reader know
that this activity comes from a prior page in the process map.
After moving to activity 8 on the second page of the process
map, the on-page connector in Figure 13-6 tells readers that,
after activities 10 and 11, they move to delivery of the products
and services in activity 18 on the same page of the map.
In reviewing Figures 13-5 and 13-6, we see that Pam’s process
starts after she receives the budget guidelines and timeline from
the finance department. Figure 13-5 shows one way to draw a
business process that starts with two activities occurring at the
same time after an event enters the process. In Pam’s case, as
soon as her team receives the budget guidelines and timeline
from finance, the learning consultants collect input from their
clients to cover their needs for the next year. Simultaneously,
the business analyst gathers historical data from the prior year.
In looking at the process map, it becomes apparent, by the
addition of the Microsoft Excel icon, that Pam’s team uses a
spreadsheet for many of the activities identified, as well as two
databases: the demand database (a Microsoft Access database)
and their system of record (an Oracle database).
Once finance approves the annual budget in activity 8, the
instructional designers begin design work on courses,
curriculum, and evaluation strategies. As the instructional
8. designers design and develop the training products throughout
the year, the evaluation specialists get involved and create the
evaluation tools, and the delivery team identifies the resources
required to facilitate the planned training.
Once the delivery team identifies the resources, the resource
management team starts evaluating the available resources and
secures any additional resources required. Once the resource
management team secures the resources, communications can
begin to tell employees of the upcoming training schedule. As
students enroll and attend training, the evaluation specialists
gather the performance data in preparation for the annual review
meeting that occurs at the end of every year. Meanwhile, the
enrollment specialist updates the system of record to reflect the
employees’ completion of training.
Figures 13-5 and 13-6 include many symbols to denote the
various tools used to accomplish each activity, and you can
include a legend page to explain the meaning of the symbols
used, as discussed in Chapter 4. The legend page can go at the
beginning or end of the map.
In addition to updating the process map between meetings, I
spent time documenting the conversation in the detail document,
a portion of which is shown in Figure 13-7. Remember to
document the conversation as you proceed so you do not lose
track of the rich dialogue, and include examples when possible.
After drawing the high-level process map and capturing the
narrative to accompany the map, the team moved to step 4. We
added the process timing to the process map and identified the
cost of the business process.
STEP 4: ESTIMATE TIME AND COST
In Chapter 5, we discussed process and cycle times and how to
use this information to estimate what a process costs. Recall
that:
Process time is the time required to complete a single activity in
a process.
Cycle time is the time required to complete an entire process,
from the first to the last step in a process. Sometimes you hear
9. this called elapsed time.
In Chapter 5, I discussed how well estimating works for this
step instead of using a formal data-gathering technique.
However, when you work with such a high-level process map,
as we did in Pam’s case, you will not find the estimate as
accurate because you do not have enough detail on all the
subprocesses. You should still perform this task, though,
because it provides directional information. When you draw a
high-level process map, go back and revisit the timing estimates
when you move to individual business processes.
Figure 13-7 BB&Z Training and Development Process: Detail
Document
During this step, I added process and cycle times to the process
map for Pam’s high-level T&D process. Figures 13-8 and 13-
9 show the process and cycle times added to the training and
development process map. As in Chapter 4, the white clock
denotes process time, and the dark clock denotes cycle time.
After adding the process time to Pam’s training and
development process map and asking the project team to
identify annual volumes, I had the data necessary to complete a
high-level estimate of the labor cost for the T&D process.
In Chapter 5, you learned that calculating the labor cost of a
business process entails four components.
PART 1: LIST PROCESS ACTIVITIES AND PROCESS TIME
After the project team completed the estimates for process and
cycle time, I transferred the times shown on the process map to
the next two tables. I completed this task after the project
meeting, during which we identified process time, cycle time,
and annual volume. Figure 13-10 shows the process time
estimates for the training and development process, and Figure
13-11 shows the cycle time estimates.
Both tables include a range in some cases, depicted as the Low
End and High End columns, because the team could not settle
on a single number.
10. In these tables, I added a fourth column, Frequency, something I
did not include in Chapter 5.I did this in Pam’s case because we
cannot count every step in the high-level process map the same
way. The training and development organization performs the
steps in the annual budgeting portion of the process map only
once a year, so we cannot count the time consumed by activities
1–8, 13–15, and 21 more than once. However, volume does
drive the other activities on the process map. Notice that
activity 12, identifying resource needs, has two frequencies
because training and development estimates the resource
requirements during the annual process and refines them as the
instructional designers create the products and services
throughout the year.
Figure 13-8 BB&Z Training and Development Process: Process
Map with Time Estimates (Part 1)
Figure 13-9 BB&Z Training and Development Process: Process
Map with Time Estimates (Part 2)
Figure 13-10 BB&Z Training and Development Process: Process
Time Estimates
Since the activities in the process map have different
frequencies, we have to reorganize the information from the
process and cycle tables by frequency so we can calculate the
labor costs. Figure 13-12shows a combined view of process and
cycle time information organized by the frequency of each
activity.
Pam wanted to know how long the annual components of the
business process took in days or months, so I translated the
hours consumed by the total annual activities in Figure 13-
12 (229.5 and 1,264.0 hours) into days and months using the
formula shown in Figure 13-13.
Figure 13-11 BB&Z Training and Development Process: Cycle
Time Estimates
11. After performing these calculations, we knew that the annual
portion of Pam’s business process consumed 28 ½ days of
process time, but it could take as long as five months of cycle
time to complete.
Our next step included bringing in volume-related data.
PART 2: IDENTIFY ANNUAL VOLUME
Before we can calculate the volume and associated labor cost
for the activities affected by volume, we must first separate the
two volume categories (by course and by transaction) by the
type of employees who do the work because these employees
have different rates of pay. In Chapter 5, I used an intentionally
simple process, the recognition bonus award process, and
included only one compensation employee type, but in Pam’s
case, five types of employees affect the volume calculation:
Figure 13-12 BB&Z Training and Development Process: Process
and Cycle Time Estimates
Figure 13-13 Calculating Total Process and Cycle Times in
Days or Months
1.Instructional designers
2.Evaluation specialists
3.Learning consultants
4.Instructors
5.Enrollment specialists
To incorporate these employee types into the calculation, Figure
13-14 shows the employee type that delivers the training and
development activities added to the table. Notice that this new
table shows only the process time for volume-related activities
since, moving forward, we only care about this information. The
new concept you should notice in this table is that one employee
type can perform different activities. For example, the
evaluation specialist develops evaluation tools (11) and collects
performance data (19).
Next, I had to merge activities performed by one employee type
into a single row to get us ready to incorporate the volume
12. component. In Figure 13-15, I added the 60 hours that the
instructional designers spend designing each course (9) to the
120 hours they spend developing the course (10), giving the
instructional designer a 180-hour total in Figure 13-15. From a
labor perspective, Figure 13-15 tells us that:
Instructional designers require 180 hours, on average, for every
course they develop.
Figure 13-14 BB&Z Training and Development Process:
Employee Type and Process Time Estimates for Volume-Related
Activities
Figure 13-15 BB&Z Training and Development Process: Process
Time Estimates by Employee Type
Evaluation specialists require 34 hours per course.
Instructors require 9.5 hours.
Learning consultants require 10 hours for this part of the
process.
Enrollment specialists require 0.28 of an hour for every
transaction.
Now that I knew how much time each instance of an activity
took and who performed the work, I had to determine the annual
labor required for each employee type. To perform this
calculation, I had to identify the yearly volume. Figure 13-
16 shows the volume listed in the Annual Volume column,
which shows that, every year, the training and development
organization:
Designed and developed about 30 new courses.
Delivered 1,000 classes.
Had a total of 25,000 students attend classes.
Figure 13-16 BB&Z Training and Development Process: Labor
and Labor Estimates
Notice that the annual volume for the learning consultant shows
130, instead of just 30, because this employee not only
communicates the 30 new products and services developed, but
13. also markets the ongoing calendar of almost 100 products and
services.
The last column in Figure 13-16 shows the Annual
Labor calculation, which I derived by multiplying the process
time by the annual volume that Pam’s team gave me, to arrive at
the annual labor hours. So now we know that the instructional
designers, for example, require 5,400 hours a year to perform
their job.
Next, we had to determine how many employees the 5,400 hours
equate to, using the full-time equivalent formula (FTE)
discussed in Chapter 5.
PART 3: DETERMINE THE FTE FORMULA
The FTE number denotes the total number of hours that an
employee can be paid for in a work year. So, if an
employee works 40 hours in a week and we multiply that
number by 52 weeks, we get 2,080 hours, a starting point for the
FTE formula. However, I could not simply use 2,080 hours in
the labor calculation because I had to deduct vacation, sick, and
holiday hours available to an employee, as explained in Chapter
5 (Figure 5-8).
I used 1,880 as the labor calculation number to apply to the
annual labor hours from Figure 13-16. You can see the formula
I used to perform this calculation in Figure 13-17, using the
instructional designer’s 5,400 hours as the example.
Figure 13-17 FTE Calculation
So now we know that Pam requires three instructional designers
to handle the level of work in the training and development
organization. I then went on and performed the same calculation
on Pam’s other employee types, and the table in Figure 13-
18 shows the result of this calculation on the five employee
types.
Figure 13-18 BB&Z Training and Development Process: Labor
Process Time Estimates
At this point, we know that the training and development
14. process requires about 13 employees to support the
development and delivery of training. However, remember that
we created this process map at a high level and I did not include
the annual component of the process in the labor estimate. I also
did not include other day-to-day tasks that Pam’s organization
must perform to keep the business running. Because Pam
wanted only a high-level estimate, we agreed to revisit the labor
estimates after we completed the improvement phase.
The next step is normally to introduce the employee salaries
into the mix.
PART 4: DETERMINE EMPLOYEE COSTS
In Pam’s case, we did not calculate the employee costs, even
though we had the necessary information. I recommended we
wait to perform the employee cost calculations until after we
finished our work because creating the process map at such a
high level would guarantee changes in the estimates.
To calculate the employee costs, follow the process outlined
in Chapter 5. Start by identifying the pay rate for each
employee type, and add an employee benefit rate (EB rate) to
each salary. For example, we could say the instructional
designers earn $80,000 a year, that Pam’s company uses a 30
percent EB rate, and that the designers dedicate 100 percent of
their time to design and development activities.
These numbers show that each instructional designer costs Pam
about $104,000 a year. Even though Pam wanted to move to the
improvement phase, we had one additional step to complete.
STEP 5: VERIFY THE PROCESS MAP
Before moving to the improvement phase, we did a quick check-
in with Pam’s managers to test whether we had captured the big
pieces of work and used the right volume numbers. We
completed this task at her weekly staff meeting and made minor
changes to the volume numbers.
STEP 6: APPLY IMPROVEMENT TECHNIQUES
Chapter 6 covered how to use six techniques to improve a
business process, including eliminating bureaucracy, evaluating
value-added activities, eliminating duplication and redundancy,
15. simplifying the process/reports/forms used, reducing cycle time,
and applying automation tools.
I began this step by discussing what happens in activity 1 with
the project team, to find places where we could reduce
bureaucracy. As the conversation progressed to the value-added
technique, we found few value-added activities. I asked why
gathering client requests occurred only once a year. The more
the team talked, the more they came to realize that activity 1
appeared to be the only activity in the entirebusiness process
where the client interacted with the process. The team became
more and more concerned about the limited interaction their
clients had with the business process.
As we talked about their clients and what their clients wanted
from the process, the project team began doubting whether they
truly understood their client needs. Going back to the scope
definition document the team completed earlier, they thought
their clients cared about their employees’ ability to perform on
the job, quick turnaround on training requests, and lower cost.
But now the team questioned the validity of those needs and did
not even agree on what a particular need meant. Failing to reach
any satisfactory conclusions, we chose to stop and conduct a
benchmark study to determine how best-in-class companies
meet certain customer/client needs.
BENCHMARKING
In Chapter 10 we touched on benchmarking, which consists of
measuring a business process against a standard of excellence
(either of an internal group in your company or of an external
company well-known as best in class). Before you can
benchmark a process against best-in-class companies, you first
have to understand the crucial points in your own
business process. Figure 13-19 shows a visual depiction of how
to approach a benchmarking exercise, with three distinct phases.
Now let us look at how I led Pam’s training and development
organization in conducting a benchmark study and how to apply
each of the three phases.
Phase 1: Customer/Client Interviews
16. In the first phase, the project team had to understand:
What Pam’s clients deemed important, to see whether they
matched what the project team identified as client needs
How the clients recognize when their need is met
Whom the clients would identify as best in class for each of
their needs
So I directed the project team to begin the benchmarking
exercise by conducting 55 client interviews over a four-week
period. We then validated the interview results by using a
survey that we sent to 700 end users of training and their
managers. We received 519 surveys back. As a result of
gathering and analyzing the data, we determined that Pam’s
clients wanted the following from their training investment:
Quality instructors
Training alternatives
The ability to customize courses
Employees applying the training on the job
During the interviews, we asked interviewees how they would
know when a need was met. For example, how would they know
if they had a quality instructor? What does quality mean? In
asking how clients would measure a quality instructor, I found
out that quality, in their eyes, meant they wanted instructors
who had industry experience to teach classes. I now had a new
gauge by which Pam could evaluate her instructor pool: How
many of Pam’s instructors taught courses in which they
possessed real-world experience? As it turned out, not many.
Figure 13-19 Benchmarking Phases
The final question in the interview asked clients to identify any
companies they felt did an outstanding job at meeting a
particular need. Could they identify a company that did a good
job at having quality instructors, instructors who bring their
real-life experience to their teaching? Their answers to this
question helped me build a list of companies that we could
benchmark against.
At the end of the first phase, we had a validated list of client
17. needs for the training and development business process, we
knew how Pam’s clients measured success, and we had a list of
companies and internal groups that we could benchmark against
to find out how they delivered against client needs.
Phase 2: Benchmarking
Now that we understood what Pam’s clients cared about, how
they would measure success, and who they thought were best-
in-class companies, it was time to move the project team to
phase 2. Next, I asked the team members to focus on:
Writing the interview questions and creating a tool to collect
the data.
Working with Pam’s internal productivity group to identify
contacts at the companies that we wanted to benchmark and then
scheduling appointments.
Reviewing benchmarking studies available in the market on
education and training.
We created two sets of questions. One set focused on general
information to ask every benchmark company, and the second
addressed the list of client needs. We did not ask every
benchmark company about all four client needs, but rather
focused each interview on the single client need for which the
company was identified as best in class. We asked certain
companies about quality instructors, another group about
training alternatives, others about course customization, and
finally a fourth group about how they evaluated an employee’s
performance on the job.
The first list of general questions, which we asked all
companies, included items like:
How many employees do you have in your company?
How many employees do you have in your training and
development organization?
How do you organize your training and development group
(centralized, decentralized, or other)?
How do you organize your resources to support your client base
(by business, geography, or other)?
How do you fund the training and development group (tuition,
18. fully budgeted, other)?
What do you consider the top-priority goals for the training and
development organization?
What do you consider the training and development group’s
critical success factors (the key goals your organization must
attain to compete in your market)?
What do you feel differentiates you from other companies in the
training and development business (your primary strengths)?
For the second set of questions, we started the interview by
providing each best-in-class company with a definition of the
client need we wanted to discuss with them. For example, we
started an interview on quality instructors by defining what we
thought quality instructors should possess: industry expertise,
technical competence, exceptional platform skills, and
credibility.
We then asked five main questions to understand how the
particular benchmark company met the client need, for example:
1.How are you organized to support __________?
2.What approach or process do you use to gain __________?
How do you determine the best approach?
3.What process do you use to measure the effectiveness of
__________?
4.What problems do you encounter?
5.What, if anything, would you change? Why?
Phase 3: Performance Goals
After the project team completed the benchmark interviews, I
summarized the findings and translated them into performance
goals, that is, what Pam’s organization cared about:
Instructor Expertise: Pam wants her organization to become
known for having instructors with real-world experience, which
suggests that she will:
Focus on acquiring instructors with industry and/or product
expertise.
Build a core of instructors/developers and outsource delivery, if
appropriate, to acquire the content expertise required.
Use the same resource, if possible, for the development and
19. delivery of training.
Use team teaching/consulting to provide required content
expertise.
Training Delivery Alternatives: A significant percentage of
Pam’s training is instructor-led training, and she wants to move
toward offering a wider range of formats and increase the use of
technology.
Ability to Customize Courses: Pam wants to increase the
modularity in her course design to enable quicker
customization, to offer training for intact groups that uses
examples and scenarios from her client’s business, and to
deliver training at her client’s site.
On-the-Job Performance: Pam wants her organization to focus
on measuring an employee’s ability to perform on the job, to
offer refresher training in self-paced formats, and to give
managers reinforcement tools to support their employees’
learning.
Conducting a benchmark study can take some time, so
remember these keys to a successful benchmarking study:
Identify the right contacts in the right companies.
Discuss one critical success factor, or client need, per
interview.
Recognize that internal benchmarking can be as effective as
external benchmarking.
Include research study findings in your summary.
A NEW APPROACH
After reviewing the results of the benchmark study, we took
another bend in the road. Pam and the project team did not see
how their present process, even after it was improved, would
get them to their desired end state. As we discussed the
activities involved in the current process map, the team
identified instances of bureaucracy, and they created a value-
added analysis, but the importance of increasing the client
interaction throughout the overall process became obvious. The
process map showed that Pam’s team interacted with the client
most often once a year during the two weeks when they
20. collected annual needs. I helped the project team to recognize
that the organization asks the wrong questions during the annual
data collection process by focusing on volume instead of on
business objectives and that they had not provided a means of
addressing changing needs throughout the year. In reviewing the
scope definition document created in step 2, I reminded the
team of the process definition they wrote:
This process covers delivering products and services that enable
employee learning to support the business objectives. In all
cases, the business goals drive the learning investment.
I helped the project team think about how they would redesign
the front end of the process to see whether they could simplify
the process, how they might reduce the five-month cycle time,
and how they could make the planning process more of an
ongoing one instead of just an annual process. With the client
identified as the central point of the process, we designed a
totally new approach to planning for client needs that
influenced a redesign of the activities that followed.
Pam’s case demonstrates the flexibility required when working
on business process improvement. You saw one bend in the road
in step 1 when we built the process inventory at the department
level, which influenced a change in step 2 and the writing of the
scope definition document. Now we had taken another twist
because we are about to redesign BB&Z’s training and
development business process from scratch to place the
emphasis on the client.
As you perform process work, try not to put labels on the work
other than business process improvement. Avoid the use of
terms like quality improvement or reengineering because it does
not matter what you call it or whether you switch between the
two, as long as you focus on improving the process.
Over the next week, we developed a new process map, depicted
in Figure 13-20, that placed the client at the center of the
process. The project team devoted significant time to
identifying the data flow throughout the process (i.e., having
the right data at the right time) because of its importance in
21. supporting a more integrated process in the future. Figure 13-
20 shows three new databases that support the process:
1.Client Profile: Holds information about training and
development clients, their needs and preferences, and how
training and development handled their needs, rejections, and
acceptance.
2.Offering Profile: Holds solutions, performance goals, designs,
learning objectives, and delivery requirements.
3.Process Performance Profile: Holds evaluation data and other
general data on how the learning process performs.
Four major business processes began to surface, which moved
Pam’s group away from the traditional view of training and
development work:
1.Need/
Solution
Identification: This business process becomes the focal point
for the client partnership and includes the identification of
needs and solutions, proposal creation, return on investment,
and client acceptance.
Figure 13-20 BB&Z New Learning Process
2.Business Direction and Measurement: This business process
sets the foundation for the business of the training and
development organization and includes the rules for running the
business, measuring the overall performance of the learning
process, and the development/coaching/reward of employees
who work throughout the learning process.
22. 3.Resource Development and Delivery: This process secures and
develops resources (internal and external) to enable
development and delivery of solutions. The process includes
managing vendor relationships, assembling the multiple
components, and overall applied research and technology.
4.Promotion and Communication: This process creates the
promotional and/or communication strategy, and it reviews the
results of the strategy. It includes managing the creation of the
materials and the distribution of those materials.
In summary, the new learning process delivers the following
improvements to the business process:
The new business process has ongoing client interaction,
increasing the value-added activities of the process.
Performing data collection throughout the year minimizes the
time required during the annual planning process, thus reducing
cycle time.
The learning process expresses client needs as performance
goals, which the training and development employees translate
into measurable, observable learning objectives, increasing the
value-added activities of the process.
The creation of three databases helps to streamline the
information and organize the data around clients, offerings, and
performance results.
The offering profile database provides a searchable tool that
assists in eliminating duplication. Once the training and
23. development employee translates a client’s performance needs
into learning objectives, the objectives become the basis for
reconciling common needs.
Streamlining the business process delivers a more adaptable
process that can react more quickly to changing business needs.
Pam and the project team liked the new process and reviewed it
with a few clients to gain their support. Once the team felt
comfortable with the design, we moved to the next step on the
roadmap, identifying internal controls, creating tools, and
developing metrics.
STEP 7: CREATE INTERNAL CONTROLS, TOOLS, AND
METRICS
In Chapter 7, we discussed how internal controls help to
identify points in the business process where a mistake can
occur and to explain how to prevent those errors; how tools can
support and streamline the process, avoid errors, and assist with
training new employees to perform their jobs easier; and how
metrics show whether the process works as planned.
INTERNAL CONTROLS
I started this step by asking the project team to identify where
something could go wrong in the new process. We then created
internal controls to address each of those areas. Having a
discussion about what can go wrong in a business process helps
the organization to circumvent the potential problems.
TOOLS
24. The next part of step 7 involves developing the tools to support
the process. Pam’s team had to develop several new items to
support the learning process, including:
Creating three new Microsoft Access databases to store the
client, offering, and performance data.
Creating standards for the documents used throughout the
learning process, such as a design document and a business
plan.
Establishing a process for obtaining and storing external
research, competitive analysis information, and the company’s
corporate charter.
Evaluating solutions to enable class registration and manage
resources.
Creating job aids to help employees perform their jobs.
I asked the project team members to think about the various
tools they had to create and how they would explain the new
process to their clients and stakeholders. One job aid we created
helped validate that only correct data entered the offering
profile database. Because the learning process views the new
offering database as a crucial tool to enable the matching of
common needs, thus reducing duplication, this job aid provides
examples of how to translate client needs into performance
goals and performance goals into learning objectives.
I also suggested that a model would help people outside the
department understand the new process because it included so
25. many changes. The model I developed in Figure 13-21, working
with the project team, illustrates the interaction throughout the
learning process:
The business direction/measurement process acts as the
foundation for the entire learning process, supporting Pam’s
concept that business goals drive learning investments.
Client needs flow through the needs/solution identification
business process, while the business direction/measurement
process and the resource development and delivery processes
support those client needs.
Ultimately, the promotion/communication process interacts with
the clients to share details about the available products and
services.
The horizontal arrows depict the employees in the learning
process and show the interaction between client needs and the
delivery of products and services.
The learning/information utility reflects the databases that hold
information to make the entire process functional, and the
model shows that all employees use the utility.
Figure 13-21 BB&Z Learning Process Model
Notice that the learning consultant’s job title changed in the
new model to customer performance consultant to stress the
importance of focusing on the clients’ businesses and helping
them to achieve their goals.
26. I highly recommend that you spend time creating a visual
representation of how your business process works because
using a model helps explain a complex business process to
people outside the day-to-day business better than a process
map, which can seem overwhelming.
METRICS
In the scope definition document we created in step 2, Pam’s
clients seemed to care about performance on the job and two
efficiency-oriented metrics (quick turnaround and lower cost).
With this information, we listed five measurements of success
in the document:
On-the-job performance
Reduced development time
Cost reduction target
The ability to integrate new businesses
The linkage between training and business goals
After completing the benchmarking study, we learned that
training and development’s clients also cared about quality
instructors, alternative delivery methods, and course
customization. Although Pam and the project team cared about
every measurement of success, I encouraged them to recognize
that the learning process had too many potential measurements
to start. I suggested they limit their metrics for the first year to
one metric for each of the following: effectiveness, efficiency,
and adaptability. The project team agreed, and after discussing
27. the measurements of success, we developed metrics for the
following items:
Effectiveness: On-the-job performance (We felt that having
quality instructors could help us to meet this measurement of
success.)
Efficiency: Reduced development time (We thought that course
customization and a new approach to modularity could help
reduce the time required to develop courses.)
Adaptability: The ability to integrate new businesses
We then took each of Pam’s measurements of success and
translated them into the metrics shown in Figure 13-22.
Figure 13-22 BB&Z Learning Process: Year 1 Metrics
Using the effectiveness measurement of on-the-job performance
as an example, let me share how we approached this item. I
suggested they start with instructor-led training, the most
expensive type, to measure employees’ ability to perform on
their jobs after they attended training.
In the training and development field, you typically hear about
four levels of training evaluation, depending on what you want
to measure: satisfaction, learning, application, or return on
investment.
We decided to create an evaluation to measure employees’
application of what they learned on the job. Pam committed to
focus on five high-volume courses throughout the first year. She
28. chose to start with an evaluation of Beating the Competition, a
course delivered to the company’s financial sales
representatives that targets BB&Z’s biggest competitor. She felt
that she could use the results of this evaluation to demonstrate a
linkage between training and business goals.
The evaluation specialist developed a pre- and post-assessment
for the course; then we established a process where the
instructors would capture a student’s baseline at the beginning
of the course by administering a brief survey. Three months
later, the evaluation specialist would follow up with the
students using a telephone survey to measure increases in their
on-the-job performance. In addition to the assessment and
survey, I suggested that the evaluation specialist track the sales
figures of employees who attended the training.
Pam now had a newly designed business process that included
increased client interaction, necessary internal controls, tools to
support the process, and metrics to evaluate the effectiveness,
efficiency, and adaptability of the process.
With all this behind us, we can move to the next step and
confirm that the process and tools will work as expected.
STEP 8: TEST AND REWORK
In Chapter 8, you learned to create a test plan to test the process
and the tools before introducing the process changes across the
entire organization. In this phase of the work, you think about
the who, what, where, when, and how of testing.
29. Whom to involve in the testing
What items to test
Where to conduct the testing
When to perform the testing
How to conduct the testing
I use the same format of the test plan from Chapter 8 (Figure 8-
2) for Pam’s process. For the learning process, examples of our
test items included:
End-to-end business process (Microsoft PowerPoint process
map; Microsoft Word detail document)
Customer profile database (Microsoft Access)
Offering profile database (Microsoft Access)
Process performance profile database (Microsoft Access)
Job aid covering the guidelines for entering data into the
offering profile database (Adobe PDF file)
Sample report that summarizes annual performance results of
the learning process (Microsoft Excel)
Class registration tool
Resource management tool
By testing the learning process, I discovered the need to make
the following changes:
We had to do additional work on what constituted a match in
the match-potential-solutions activity because it seemed too
easy to credit a solution with addressing a performance goal.
We had to train the customer performance consultants on how to
30. use the offering database.
We redefined the activity called synthesize/evaluate
refinements because the process workers did not understand
what this activity entailed.
We modified how we set up the resource management
application.
We adapted the fields in the customer profile database to
accommodate the customer performance consultants.
We modified the process performance database to meet what
Pam hoped to gain from this data.
We changed the sample report that summarized the learning
process’s performance.
At the end of the testing phase, the project team made all the
necessary changes. The training and development employees
involved in the testing noticed we had made substantial changes
to the process. They understood the reasons why and expressed
excitement about the upcoming implementation.
STEP 9: IMPLEMENT CHANGE
When I first started working with Pam, I created a project plan
for the training and development business process improvement
effort and continually adjusted the plan throughout the work,
especially after deciding to redesign the process.
In Chapter 9, you learned that the implementation plan included
phases and that a phase could include tracks. Three key tracks
in the implementation phase include the:
31. 1.Communication track: Developing a communication plan
stating who has to know what when
2.Training track: Developing a training plan that tells who
requires training on what
3.Change management track: The impact analysis that identifies
whom to engage in the changes you want to introduce
COMMUNICATION TRACK
The project team had to think about what communication needed
to occur to verify everyone received the appropriate information
to prepare them for the change. Figure 13-23 shows part of the
learning process communication plan, in which I defined the
audience, communication goals, key message points, the best
communication vehicles to use, and the best timing to deliver
the messages.
Figure 13-23 shows training and development employees and
clients as the two main audiences that require communication
about the process changes. A key challenge for training and
development was to refocus the organization’s mindset so that
everything employees do revolves around the client.
TRAINING TRACK
For the training plan, the project team had to think about what
training needed to occur to ensure that all parties could perform
their process responsibilities. They had to list the employees
requiring training, identify what kind of training the employees
required, and identify who owned the responsibility to conduct
32. the training. They also had to decide where the project team
would hold the training, along with when and what methods
they would use to conduct the training.
Figure 13-23 BB&Z Learning Process: Communication Plan
Figure 13-24 shows part of the learning process training plan.
The figure shows that I designed the training approach to have
employees attend training on the basis of how they relate to the
four new business processes. This segregation was intentional to
reinforce the importance of the new design. It also shows that
the customer performance consultant will receive additional
training on the client and on the offering profile databases
(discussed earlier).
CHANGE MANAGEMENT TRACK
The impact analysis for the new learning process captured the
changes that had to occur to ensure the success of the new
business process. In Chapter 6, as we built the new, improved
process map, we created the impact analysis and identified the
required changes.
Figure 13-24 BB&Z Learning Process: Training Plan
Once Pam addressed the items in the impact analysis and after I
developed the training and communication plans, Pam felt ready
to introduce the new learning process. She now had confidence
that the project team had considered the important items and
33. felt ready to move ahead with implementation. Pam felt strongly
about the next step, continuous improvement, because she now
recognized how quickly a process may have to change. So the
team had one last task to complete.
STEP 10: DRIVE CONTINUOUS IMPROVEMENT
During this step, Pam had another challenge she had to deal
with: how to help the organization adopt a new mindset where
they would always look for ways to improve the learning
process. The continuous improvement cycle wheel in Chapter
10 (Figure 10-1) introduced some structure to this phase, and I
led the project team in creating a plan to regularly evaluate,
test, assess, and execute against improvements.
We developed a continuous improvement plan for each of the
four business processes, and then developed the continuous
improvement schedule to provide an overview of the timing for
each of the business processes.
After the project team finished all the work, I included in the
executive summary (1) the learning process model from Figure
13-21, (2) the process description summary shown in Figure 13-
25, and (3) a process summary that included general
assumptions, dependencies, job descriptions, and sizing
algorithms.
At the end of our work, Pam Borzak had an organization that
focused on the right areas. Her entire organization was client
focused and regularly evaluated the effectiveness, efficiency,
34. and adaptability of the learning process. I helped her develop
recognition guidelines to reward employees for outstanding
performance in support of the new business process.
CHAPTER SUMMARY
Pam Borzak’s story at BB&Z demonstrates how to apply the ten
steps to business process improvement and how to adjust the
steps as you encounter obstacles or bends in the road. The ten
steps are:
1.Develop the process inventory: How to build a process
inventory and process prioritization table for either an entire
department or the business processes within a department.
Figure 13-25 BB&Z Learning Process: Process Descriptions and
Responsibilities
2.Establish the foundation: How to develop the scope definition
document for a business process.
3.Draw the process map: How to decide the level of detail for
building the process map and how to create a map that spans
multiple pages.
4.Estimate time and cost: How to calculate process and cycle
time, how to incorporate frequency into the calculations, and
how to include different types of employees.
5.Verify the process map: Ways to validate the accuracy of the
process map.
6.Apply improvement techniques: How to incorporate bench-
35. marking into the improvement phase and how to know when to
design an entirely new process.
7.Create internal controls, tools, and metrics: How to develop
internal controls, sample tools, and metrics. A reminder of the
importance of building a model to explain a complicated
process.
8.Test and rework: How to test all the components of a business
process.
9.Implement change: How to develop the communication,
training, and impact analysis plans.
10.Drive continuous improvement: How to create a schedule to
keep track of all the different business processes.
WHAT YOU HAVE ACHIEVED
In this chapter, you have achieved the following:
A grasp of how to adjust to bends in the road and adapt the ten
steps
An understanding of how to build a model to further explain a
complex business process
The ability to calculate employee costs when different types of
employees are involved in the process
The knowledge that you can build the process inventory and
prioritization table at either the department or the process level
An understanding of how to incorporate multiple frequencies in
the cost analysis
Insight into how to conduct a benchmark study
36. Most important, the power to know that you can do it
· Copy
· Add Highlight
· Add Note
Reproduced with permission of the copyright owner. Further
reproduction prohibited without permission.
THE RETURN OF BARGAIN: AN ECONOMIC THEORY OF
HOW STANDARD-FORM ...
Johnston, Jason Scott
Michigan Law Review; Mar 2006; 104, 5; ABI/INFORM
Collection
pg. 857
Reproduced with permission of the copyright owner. Further
reproduction prohibited without permission.
37. Reproduced with permission of the copyright owner. Further
reproduction prohibited without permission.
Reproduced with permission of the copyright owner. Further
reproduction prohibited without permission.
Reproduced with permission of the copyright owner. Further
reproduction prohibited without permission.
Reproduced with permission of the copyright owner. Further
reproduction prohibited without permission.
Reproduced with permission of the copyright owner. Further
reproduction prohibited without permission.
38. Reproduced with permission of the copyright owner. Further
reproduction prohibited without permission.
Reproduced with permission of the copyright owner. Further
reproduction prohibited without permission.
Reproduced with permission of the copyright owner. Further
reproduction prohibited without permission.
Reproduced with permission of the copyright owner. Further
reproduction prohibited without permission.
Reproduced with permission of the copyright owner. Further
reproduction prohibited without permission.
39. Reproduced with permission of the copyright owner. Further
reproduction prohibited without permission.
Reproduced with permission of the copyright owner. Further
reproduction prohibited without permission.
Reproduced with permission of the copyright owner. Further
reproduction prohibited without permission.
Reproduced with permission of the copyright owner. Further
reproduction prohibited without permission.
Reproduced with permission of the copyright owner. Further
reproduction prohibited without permission.
40. Reproduced with permission of the copyright owner. Further
reproduction prohibited without permission.
Reproduced with permission of the copyright owner. Further
reproduction prohibited without permission.
Reproduced with permission of the copyright owner. Further
reproduction prohibited without permission.
Reproduced with permission of the copyright owner. Further
reproduction prohibited without permission.
Reproduced with permission of the copyright owner. Further
reproduction prohibited without permission.
41. Reproduced with permission of the copyright owner. Further
reproduction prohibited without permission.
Reproduced with permission of the copyright owner. Further
reproduction prohibited without permission.
Reproduced with permission of the copyright owner. Further
reproduction prohibited without permission.
Reproduced with permission of the copyright owner. Further
reproduction prohibited without permission.
Reproduced with permission of the copyright owner. Further
reproduction prohibited without permission.
42. Reproduced with permission of the copyright owner. Further
reproduction prohibited without permission.
Reproduced with permission of the copyright owner. Further
reproduction prohibited without permission.
Reproduced with permission of the copyright owner. Further
reproduction prohibited without permission.
Reproduced with permission of the copyright owner. Further
reproduction prohibited without permission.
Reproduced with permission of the copyright owner. Further
reproduction prohibited without permission.
43. Reproduced with permission of the copyright owner. Further
reproduction prohibited without permission.
Reproduced with permission of the copyright owner. Further
reproduction prohibited without permission.
Reproduced with permission of the copyright owner. Further
reproduction prohibited without permission.
Reproduced with permission of the copyright owner. Further
reproduction prohibited without permission.
Reproduced with permission of the copyright owner. Further
reproduction prohibited without permission.
44. Reproduced with permission of the copyright owner. Further
reproduction prohibited without permission.
Reproduced with permission of the copyright owner. Further
reproduction prohibited without permission.
Reproduced with permission of the copyright owner. Further
reproduction prohibited without permission.
Reproduced with permission of the copyright owner. Further
reproduction prohibited without permission.
Reproduced with permission of the copyright owner. Further
reproduction prohibited without permission.
45. RESEARCH PAPER
Determining profit-optimizing return policies – a two-step
approach on data from taobao.com
Wenyan Zhou1 & Oliver Hinz1
# Institute of Information Management, University of St. Gallen
2015
Abstract Selecting an optimal return policy requires taking
into account two effects: the potential positive effect on sales
and the potential negative effect of higher costs. We propose a
two-step model, in which we first utilize a robust regression to
explain purchase behavior, and then apply a zero-inflated neg-
ative binominal regression to model the return behavior. We
apply this model to data from the most important online plat-
form in China and obtain three main findings. First, the adop-
tion of return policies results in increased sales, while reputa-
tion works as a moderator in this process. Second, good rep-
utation and traditional customer friendly return policies (like
the Seven-Day Return policy) can significantly increase the
number of returns, while more guarantee credibility (enhanced
46. by Guarantee Money) is related to fewer returns. Taken to-
gether, both the Seven-Day Return policy (profit increase of +
0.29 %) and Guarantee Money (profit increase of +0.016 %
per Yuan guarantee) ultimately increase firms’ profit.
Keywords Return policy . Return behavior . Zero-inflated
negative binominal regression . Seven-Day Return policy .
Guarantee credibility
JEL classification M3
Introduction
High return rates are a global problem for online retailers,
threatening their business model in the long run. According
to the Wall Street Journal, a third of all Internet transactions
are returned by shoppers and the return rate is still increasing
(Banjo 2013). High return rates cause substantial costs (re-
verse logistics cost, product depreciation, management of re-
turn process and so on) (Blanchard 2005). ASOS Chief Exec-
utive Nick Robertson stated that a 1% decrease in return rates
would immediately increase profits by 10 million pounds ($16
million, approximately 30 % of their net income in 2012)
(Thomason 2013). In the U.S., product returns cost manufac-
47. turers and retailers approximately $100 billion annually due to
lost sales and reverse logistics, reducing profits by 3.8 % on
average per retailer or manufacturer (Blanchard 2007).
We analyse the effect of different return policies that small
and medium-sized online shops can implement. The situation is
especially challenging for them because they typically have
only
limited liquidity and relatively high labour costs which make
them more fragile and high return rates constitute a significant
challenge for them. High uncertainty in online environments
(compared to traditional brick-and-mortar shops) and intense
competition force them to offer attractive return policies to
attract
customers. For these reasons, it is crucial for small and
medium-
sized online shops to evaluate whether their return policies are
beneficial and which policies are better with respect to profits.
As our analyses rest on data provided by Taobao.com, the
results
can directly be applied by retailers that are active on
Taobao.com. Moreover the results may also hold for small and
medium-sized online shops that face a fierce competition.
The online purchase process in general can be modeled as
48. two separate decisions (Bechwati and Siegal 2005; Wood
2001): customers’ decision to order and, upon receipt, their
decision to keep or return. The effects of return policy can
Responsible Editor: Andreja Pucihar
* Wenyan Zhou
[email protected]
Oliver Hinz
[email protected]
1 Institute of information management, TU
Darmstadt/Electronic
Markets, Hochschulstraße 1, 64289 Darmstadt, Germany
DOI 10.1007/s12525-015-0198-6
Electron Markets (2016) 26:1 3–1 40 1
Received: 25 July 2014 /Accepted: 6 August 2015 /Published
online: 16 September 2015
http://orcid.org/0000-0003-2992-6459
http://crossmark.crossref.org/dialog/?doi=10.1007/s12525-015-
0198-6&domain=pdf
49. persist from the pre-purchase to the post-purchase phase (Wood
2001). In the first phase, customers cannot experience and as-
sess the actual quality of the ordered products, which
constitutes
an information asymmetry. Return policies aim at countering
this asymmetry and have given online retailing a huge boost
(Banjo 2013). Tolerant return policies act as a signal that in-
duces customers to perceive higher quality and lower risk
(Glover and Benbasat 2010) in a product. As a result, customers
could spend less time on considering whether to buy or not,
which ultimately eases their purchase decision.
In the second phase (post-purchase), return policies can in-
crease customers’satisfaction and maintain long-lasting
relation-
ships (Pizzutti and Fernandes 2010), because they can easily get
their money back if they are unsatisfied. Return behavior can be
attributed to two causes: one is the gap between expectations
and
actual product quality (fit problem), and the other is opportunis-
tic or planned behavior. The first one can be improved by offer-
ing accurate descriptions as well as services like user-generated
product evaluations. But the second cause depends more on
customer personality and the return policies themselves. Prior
research has shown that relatively restricted return policies –
50. for example, charging Bhassle^ fees (Davis et al. 1998) and
restocking fees (Shulman et al. 2009), or granting only condi-
tional return guarantees (i.e., only solving verifiable problems)
(Chu et al. 1998) – can effectively reduce the return rate.
Overall, tolerant return policies can generate respectable in-
creases in sales, but a higher return rate could, in turn, lead to
substantial costs in terms of reverse logistics, depreciation and
additional labor effort. Therefore, both scholars and
practitioners
have tried to optimize return policies and find the balance be-
tween increased sales and higher return rates using models or
experiments. However, empirical studies are limited. The only
related study at shop level (using shops’ operating data) is
Davis
et al. (1998), who investigated 133 retailers with various return
policies and found that retailer return policies vary with how
quickly a product is consumed, the salvage value (i.e., the re-
tailer’s ability to resell the product or obtain credit from its
suppliers) of returned merchandise, and whether there are op-
portunities to cross-sell or substitute other items when returns
occur. Other related studies explore the balance using models.
For example, Anderson et al. (2009) established a model to
measure the purchase and return of apparel items from the cus-
tomer perspective and estimated the model with 987 customer
51. records from a mail-order catalog company.
In this paper, we focus on the research question: How do
various return policies (customer friendly return policies and
guarantee credibility) affect customer purchase and return be-
havior for small and medium-sized online shops? For this
purpose we suggest a two-step approach: First we determine
the impact of the return policy on sales, and second we exam-
ine the influence of the return policy on return behavior. We
collected data for 600 shops on the most important online
marketplace in China, Taobao.com. The combined gross
merchandise volume of Taobao Marketplace and the affiliated
Tmall.com exceeds 1 trillion yuan (~132 billion EUR) in 2013
(Alibaba 2013). The data offer the opportunity to analyze the
effect of return policies as the sellers can choose from various
return policies on Taobao.
Due to the characteristics of our data, we apply a robust
regression model to deal with minor concerns about the po-
tential failure to meet assumptions, such as normality,
heteroscedasticity, or observations that exhibit large residuals,
leverage, or influence. Further, we estimate a zero-inflated
negative binomial regression (ZINB) to deal with excessive
zeroes in the return rate. We also control for guarantee credi-
52. bility (Suwelack et al. 2011) and reputation (Roggeveen et al.
2014) and their potential interaction effects.
Literature review on return policies
A service guarantee is a promise by a company to compensate
the customer in some way if the defined level of service de-
livered is not fully met (Sum et al. 2002); examples include
money-back guarantees and lowest-price guarantees. Prior re-
search (e.g., Su and Zhang (2009)) has suggested that return
policies can be analyzed in three different dimensions: 1) re-
turn deadlines; 2) consumer effort required (in terms of bring-
ing back original receipts and filled-in return forms); and 3)
extent of return coverage (extent of money back due to ship-
ping charges, inventory holding charges and re-stocking fees).
During the purchase decision process, a tolerant return
policy – which entails longer deadlines, less required effort for
returning and more coverage – provides an effective signal that
reduces uncertainty (Heiman et al. 2001) and heightens per-
ceived quality (Boulding and Kirmani 1993; Moorthy and
Srinivasan 1995). Signaling theory (Kirmani and Rao 2000)
proposes an explanation for the conditions under which a guar-
antee reliably signals quality and influences consumer choice
(Boulding and Kirmani 1993; Erevelles et al. 2001). That is,
53. when consumers are confronted with information asymmetry
about true product quality, they try to assess the magnitude of
the penalty faced by the seller when the product’s actual quality
is lower than its promised quality (Boulding and Kirmani 1993).
This penalty results from both direct return costs (amount of
return, expenses) and indirect reputational implications. Further
penalties involve the return rate, which is influenced by the
perceived quality of the market mechanism used to detect mis-
leading applications of the signal (e.g., ease of understanding,
interest in comparison) (Heiman et al. 2001). Meanwhile,
Desmet (2013) found that this relationship is moderated by
brand, price, and the relationship between customer and retailer.
While previous research on return policy’s marketing sig-
nals has mainly focused on quality signals, Suwelack et al.
(2011) revealed that the credibility of a return policy (guaran-
tee credibility) is a key mediator between the return policy and
W. Zhou, O. Hinz104
customer purchasing behavior. Specifically, the more credibil-
ity customers feel the more purchase intention will they have.
Guarantee credibility also can work as a trust signal
54. (Mavlanova and Benbunan-Fich 2010) which can influence
customer return behavior.
In the return decision process, a tolerant return policy how-
ever also increases product return rates for customers in remote
purchase environments (Wood 2001). Anderson et al. (2009)
used utility theory to point out that customers return items only
if the net utility (Net utility=Deterministic utility+Fit of trans-
action+Return cost) is negative. Specifically, according to the
two-step process, the utility of the product (both pre-purchase
utility and post-purchase utility) for a specific customer is de-
rived from three parts: (1) Deterministic utility, which is known
to the firm and the customer at the time of purchase; (2) fit of
transaction, which is unknown to the firm but known to the
customer after the purchase (Petersen and Kumar 2009); and
(3) return cost, which includes the shipping fee (Frischmann
et al. 2012), time and labor cost. More lenient policies impose
less return costs for the customer, thereby increasing return
intention. But other scholars have treated the service guarantee
(return policy) as a positive factor for return behavior in the
long run, namely in offering a continuous positive effect on
employees’ motivation and ability to learn from service failure,
which can increase service quality and indirectly reduce cus-
tomer intention to return indirectly (Dutta et al. 2007).
55. While there exists a vast array of literature on the optimal
way to design return policies (e.g., Padmanabhan and Png
(1997)), only a few papers (e.g., Che (1996)) have examined
the impact of return policies on both the pre-purchase and the
post-purchase steps (Janakiraman and Ordóñez 2012), and the
empirical research on the second step is especially lacking.
Table 1 shows the related empirical studies. We can conclude
that 1) most empirical studies work on the customer level
(using customers’ purchase history or conducting experi-
ments), examining the behavior of a number of customers
from one company or platform; 2) most of the studies apply
simple OLS regressions when analyzing data; and 3) there is
no study that focuses on the effects of guarantee certainty on
return behavior. Our paper aims to close these gaps by ana-
lyzing real data using a zero-inflated negative binominal re-
gression, for the purpose of measuring the influence of return
policies on both, sales and returns.
Hypotheses and conceptual model
To investigate the return policy’s effect on the whole purchase
process, we propose a two-stage conceptual model. We ana-
lyze the effect of return policies and guarantee credibility on
both, the purchase and the return stage (See Fig. 1). We control
for reputation as another important quality signal for online
56. shopping (Zhang et al. 2012).
Customer friendly return policies work as quality signal
and risk control measure when customers make their purchase
decision. Because of high return costs, the adopted customer
friendly return policy is a costly indicator for the seller’s con-
fidence in their own product quality. Prospective buyers as-
sume that sellers do not adopt policies that lead to losses. So
the products’ quality is expected to be higher or closer to their
description on the websites, which can lead to a higher fit of
expectations and actual product quality. Moreover, customer
friendly return policies can reduce the cost of retracting a bad
decision and thus enables consumers upfront to purchase
while maintaining some flexibility. If consumers have the
choice between two equivalent alternatives, they are likely to
choose the alternative with the better return policy.
The return policy also influences the after-purchase phase.
Return policies without shipping and restocking fees directly
decrease return costs and return policies with lenient return
deadlines giving the buyers more time to reconsider the pur-
chase. Customer friendly return policies can thus reduce abso-
lute return costs (money, time and labor cost). As Anderson
et al. (2009) pointed out that a customer will choose to return
products if the net utility is negative and lower return costs
57. ultimately lead to a lower net utility. We thus state hypothesis
1 and 2.
H1: Customer friendly return policies are positively re-
lated with sales.
H2: Customer friendly return policies are related with
more returns.
We define guarantee credibility in our paper as the credi-
bility of a return policy which can certainly influence the
buyers’ two-stage decisions. Usually, credibility is difficult
to improve or measure (Zhuo et al. 2013), but online shops
can easily boost the credibility of return policies directly via
support measures – for example, by adopting Guarantee Mon-
ey (e.g., in Taobao.com), which ensures that the return policy
can be enforced or sellers can be punished if they do not
implement their return policies correctly. At Taobao.com
sellers can allocate an arbitrary amount of money (Guarantee
Money) that the platform operator can use to compensate un-
satisfied buyers if there is dispute between buyer and seller.
On the one hand, guarantee credibility is thus a strong signal
for high quality and credibility of the return policy of the focal
sellers. Thus, we suggest that guarantee credibility could also
be a factor that directly affects customer purchasing behavior.
For example, large firms could use guarantee policies that
58. small firms cannot afford to imitate. If low-quality firms fol-
low though, they will suffer significant financial losses when
they are caught cheating. On the other hand, guarantee credi-
bility can effectively propel return policies forward which
makes it easier for buyers to return their products. Similar as
return policy, guarantee credibility could significantly reduce
Determining profilt-optimizing return policies 105
the absolute value of return cost. So we derive hypotheses 3
and 4 as follows:
H3: Guarantee credibility is positively related with sales.
H4: Guarantee credibility is related to more returns.
Reputation is another important quality signal (Zhang et al.
2012). Purohit and Srivastava (2001) provided a classification
scheme to differentiate between transient and durable signals.
Durable signals, such as reputation, are classified as Bhigh-
scope^ signals, meaning that the cue has evolved over time
and cannot be changed easily. More transient cues, such as re-
turn policies and guarantee credibility, are classified as Blow-
scope^ signals, meaning that they are fairly easy to change
59. and weigh relatively less as a signal of quality in contrast to a
high-scope signal (Purohit and Srivastava 2001). Meanwhile,
Roggeveen et al. (2014) found that moderately incongruent sig-
nals can be combined to enhance evaluations. In particular, if a
firm's reputation and policies are complementary, this can posi-
tively moderate the effect of return policies on customer behav-
ior. However, reputation only stands for the past records of a
firm; it cannot guarantee the firm’s future behavior. Based on
these insights we propose hypotheses 5 and 6 as follows.
H5: Reputation moderates the effect of return policy on
sales.
H6: Reputation moderates the effect of guarantee credi-
bility on sales.
Data and model
Taobao.com belongs to the Alibaba group and is the largest
global online B2C and C2C platform. The China based plat-
form started their business in May 2003 and had 500 million
registered users by the end of 2013 (Ye et al. 2013). Taobao is
a bilateral market, and also can be categorized as a third-party
market place (Timmers 1998). Like on eBay, registered users
can act both, as sellers and buyers, on Taobao. The platform
61. Studies Method Data Main contributions
Hess and Mayhew
(1997)
Hazard model and
empirical evidence
1000 customers during 4 years Using hazard model to predict
return behavior.
Davis et al. (1998) OLS regression 133 stores in the
Sacramento,
California area
Retailers prefer a low-hassle return policy when 1) its
products benefit are only realized in long term; 2) there
are opportunities for cross selling; and 3) the salvage
value from returned merchandise are high.
Wood (2001) Conjoint experiments 68 undergraduate students
in the main
study
62. Lenient return policy increases purchase rates and product
return rates via signal effect.
Bechwati and
Siegal (2005)
Labor experiments 87 undergraduate students in Study
1; 117
undergraduate students in Study 2
Introduces a framework of the mechanisms underlying
product returns. Customer return choices are different
when they facing disconfirming information.
Anderson et al. (2009) Developing econometric
model and empirical
evidence
987 customers of a mail-order catalog
company
Provide empirical evidence that return policy gives
customers an option value that is measurable; add the
option value to model how different return policies
affect firm profits.
63. Petersen and
Kumar (2009)
Seemingly unrelated
regression,
TobitModel and
empirical evidence
Transactions information of 1572
customers between January 1998
and August 2004 in a B2C company
Empirically demonstrate the role of product returns in the
exchange process and show how product return
behavior affects future customer and firm behavior.
Bonifield et al. (2010) Regression;
Field experiments
141 of the e-retailers listed on
BizRate.com; 290 consumers at an
e-tail site
Show a correlation between perceived quality of online
64. retailers and product return policy leniency. The
shopping experience moderates the relationship
between leniency and consumer reaction.
Janakiraman and
Ordóñez (2012)
Labor experiment 245 participants from a large public
university in the southwestern U.S.
Decreasing the product return deadline has the
counterintuitive effect of leading to an increase in
product return rates in some cases.
W. Zhou, O. Hinz106
offers unified ordering, a delivery and payment system but
sellers have flexibility to choose their own guarantee strategy.
Another characteristic of Taobao.com is that most of sellers are
small and medium-sized shops in China that do not sell well-
known brands and only focus on one special category like cloth-
ing and shoes. Although Taobao has started to offer its service
in
65. other countries as well, the main market is still China.
According
to the 3-months Alexa traffic rankings, Taobao.com is ranked
9th and ebay.com is ranked 21st worldwide (Retrieved on
Dec. 8, 2014). The blossoming of the online market in China
has stimulated much interest among marketers. However, there
is still limited research that attempts to understand customer
behavior on platforms like Taobao.com.
On Taobao, customers can leave reviews (e.g., comments:
good, normal, negative; scores (1–5, 5=very good) for descrip-
tion, service and delivery) after purchasing; the default value is
Bgood^ if customers do not leave feedback within 15 days, but
scores have no default values. All information can be found on
the ratings pages, including customer reviews and each shop’s
return rate. We randomly choose 600 online shops, but we
could not retrieve all the necessary data for eight of them,
leaving a total of 592 shops in our sample. The shops’ catego-
ries are mainly clothing, shoes, bags, digital products, books
and others (see Table 2). To control the effect of product types
on customer behavior (Bae and Lee 2011), we use industry data
(e.g., Industry Return Rate) as a control variable in our models.
The return rate is the proportion of returns in relation to sales
in the observation period. We also calculated the return rate in
66. 2014 and found that the changes are not substantial (see
Table 2). The two main return policies adopted by sellers on
the platform are BConsumer Guarantee^ and BSeven-Day
Return^. BConsumer Guarantee^ means that customers can re-
turn or change products within 15 days if there is a quality
problem or if the product description does not match the re-
ceived product. Moreover, BGuarantee Money^ includes a spe-
cial form of a money back guarantee: Taobao.com administra-
tors guarantee that the shops offering BConsumer Guarantee^
will return the customer’s funds immediately–a feature that
makes the return process both smoother and more credible.
The BSeven-Day Return^ policy means that customers can re-
turn the product for any reason within 7 days. We use two
dummy variables to model whether shops adopt these two re-
turn policies or not. Table 3 explains all variables used in this
paper.
To examine the tradeoff between the impact of return pol-
icies on sales and the one on returns, we suggest two steps. In
the first step, we apply a robust regression model to estimate
the influence of return policies on sales. In the second step, we
estimate a zero-inflated negative binomial regression (ZINB)
to examine the impact of return policies on the return rate, a
dependent variable with excessive zeroes. The robust regres-
sion model is as follows:
67. Sale si ¼ α0 þ α1* Reputation þ α2* Seven Day Return þ α3*
Guarantee Money
þ α4* Customer Guarantee þ α5* Description þ α6* Industry
Return Rate
þ α7* Return Rate þ α8* Reputation * Seven Day Return
þ α9*Reputation*Guarantee Money þ α10*Reputation*Customer
Guarantee þ ε
ð1Þ
In the second step, we need to account for the fact that the
return rate is heavily skewed (see Fig. 2), with the majority of
the
shops experiencing very few returns. About 45.5 % of the shops
encounter no returns at all. This might be due to two reasons: 1)
there are some new shops that have no transaction records at all;
and 2) some shops have customers who are so satisfied that they
do not make use of the return option. As a result, we cannot use
a
regular regression model, so we instead apply a zero-inflated
negative binomial regression (ZINB). ZINB models have two
stages: one stage is used to estimate the zero-values (non-
returns
in this case) and the other is used to estimate the actual returns
68. in
absolute numbers (Mwalili et al. 2008). All cases are used in
both
analyses, but they are weighted based on the results of the
model’s
logistic component (see Equation 6). Using this model, we can
well explain the zero-inflation, so long as two conditions of
ZINB
are considered: 1) target behavior is not always happening (we
have zeroes and non-zeroes in the dataset); and 2) target
behavior
has to be any integer, including zero (Heilbron 1994). To meet
these conditions, we use the integer of return rate times 100 (we
labeled BReturn100^, e.g., if the return rate is 7.034 %, the
BReturn100^ is 7.) and use return rate times sales (we labeled
BReturn Number^) as two separated dependent variables.
While the data in this study are not true count data, the chosen
model is appropriate for two reasons: first, the data are distrib-
uted exclusively on the non-negative integers and tend to show
heteroskedasticity (exactly like true count data); second, the
data
appear to be a result of mixture models (i.e., two separate parts
cause the need for zero-inflation) (Simons et al. 2006). As such,
69. even though the data are technically not generated by a count
process, the resulting distribution has the expected characteris-
tics of a count process, and thus a count model is appropriate.
The ZINB distribution is a mixture distribution assigning a
mass of p to Bextra^ zeroes and a mass of (1− ω) to a negative
binomial distribution, where 0 ≤ ω ≤ 1. McLachlan and Peel
(2004) noted that the negative binomial distribution is a con-
tinuous mixture of Poisson distributions, which allows the
Poisson mean to be gamma distributed; in this way, over-
dispersion is modeled. We will compare the results of the
Determining profilt-optimizing return policies 107
ZINB with the outcomes of a zero-inflated Poisson
model (ZIP) later on to demonstrate why we do not
use a ZIP model in our study. The negative binomial
distribution is given by
P Y ¼ 0ð Þ ¼ ω ð2Þ
P YeNegative Binomial λ; αð Þð Þ ¼ 1−ω ð3Þ
70. yielding the following distribution of counts:
P 0ð Þ ¼ ω þ 1−ωð Þ*F 0jλð Þ ð4Þ
P kð Þ ¼ 1−ωð Þ*F kjλð Þ ð5Þ
where F represents the reference distribution (negative bino-
mial with fixed parameter α), represents the predicted proba-
bility of being always-zero, modeled by the logistic compo-
nent of the model, and represents the predicted mean of the
negative binomial component of the model.
Reputation, Seven-Day Return, Guarantee Money,
Customer Guarantee, Description and Industry Return
Rate were included as independent variables in both
components of the models. Thus, the two-part model
was parameterized s
ωi ¼
e
β0 þ β1*Reputation þ β2*SevenDayReturn þ
β3*GratanteeMoney þ β4*CustomerGuarantee
þβ5*Description þ β6*IndustryReturnrate
71. 1 þ e
β0 þ β1*Reputation þ β2*SevenDayReturn þ
β3*GratanteeMoney þ β4*CustomerGuarantee
þβ5*Description þ β6*IndustryReturnRate
ð6Þ
λi ¼ e
γ0 þ γ1*Reputation þ γ2*Seven Day Return þ γ3*Gratantee
Money þ γ4*Customer Guarantee
þ γ5*Description þ γ6*Industry Return Rate ð7Þ
Table 2 Descriptive statistics
Summary of dependent variables
Dependent variable Min Median Max Mean
Sales 0 21 8324 116.7
Return rate 0 % 1.5 % 150%a 7 %
Accumulation of return rate
72. Return rate 0 % 5 % 10 % 20 % 30 % 50 % Mean
Accumulation 45.5 % 67.8 % 84.5 % 91.3 % 95.7 % 97.7 % 7 %
Adoption of various return policies
Return policy Seven-Day Return Consumer Guarantee
Guarantee Money
Ratio of adoption 47.7 % 88.7 % 76.6 %
(Range: 0 – 10,000 Yuan)
Return rate in different industries in 2012 and 2014
Industry Home Accessory Health Food Jewel Accessory
Return rate in 2012 0 % 1.77 % 2.28 %
Return rate in 2014 1.62 % 2.72 % 3.03 %
Industry Digital Products Book and Media Clothes and Shoes
Return rate in 2012 2.31 % 5.31 % 5.53 %
Return rate in 2014 4.02 % 5.48 % 6.58 %
73. a Return behavior can happen within 7 days after purchasing, so
there can be lagged effects. A return rate>100 % means that
customers returned products
that they have bought in the last 7 days of the previous month
which can in this case exceed the sales in the focal month. For
example, shop A sold 10
products in May, one of them was returned in May, three of
them were returned in June. Then in the next month, Shop A
only sold 2 products which the
buyers kept but as a result the return rate in June is 150 %
W. Zhou, O. Hinz108
We then use the software package R to estimate both the
robust regression and ZINB model.
Results
We start with a Vuong test and find that a zero-inflated nega-
tive binomial (ZINB) regression model is superior over a zero-
inflated Poisson model (ZIP) (t-value=19.16929, p<0.001)
and a standard negative binomial model (t-value=4.945271,
74. p<0.001). The estimated parameters and the p-values of the
models are presented in Tables 5. It is clear that return policies
can significantly affect both sales and returns, but various
policies function in different ways. Reputation is another im-
portant factor working in both a direct and an indirect way.
Columns 2 and 3 in Table 4 indicate the main factors
influencing sales, while columns 5 and 6 present a model that
includes the interaction between the shops’ reputations and
their return policies. According to the data, good reputation
and the Seven-Day Return policy significantly increase sales
(p<0.05) which supports H1. Other return policies like Guar-
antee Money and Customer Guarantee also have positive ef-
fects, but this result is not robust across Model 1 and 2. Hence,
we only find partly support for H3. With regard to the mod-
erator effects, better reputation reduces the influence of tradi-
tional return policies (Seven-Day Return policy and Customer
Guarantee) on sales (p<0.05), but bolsters the influence of
guarantee credibility (Guarantee Money) on sales (p<0.05),
thus supporting H5 and H6. The reason might be that tradi-
tional return policies and reputation both work as quality sig-
nals, thereby acting as substitutes. From a customer’s perspec-
tive, sellers with a better reputation are likely to offer generous
return policies, and it follows that sellers offering better return
75. policies must be more confident about their services and prod-
ucts. However, guarantee credibility extends the reliability of
quality signals, thereby serving as a complement to the histor-
ical reputation. Guarantee Money is specifically a support
measure for future behavior, guaranteeing that buyers can
get their money back immediately if necessary.
Table 5 presents the results derived from fitting the ZINB
regression model to the return data. The R-square is relatively
low because we cannot consider customer-specific factors like
the customers’ personality traits.
Return number, Reputation and Guarantee Money remain
significant in both parts of the ZINB model. Specifically, good
reputation can reduce the possibility of certain non-returns
Table 3 Measurement of variables
Variables Measurement
Reputation Total amount of good comments since business’
start.
Seven-Day Return Customers can return or change their
products for any reason within 7 days,
76. coded as dummy variable.
Customer Guarantee Customers can return or change their
products within 15 days if there are quality or service
(e.g., description misunderstandings) problems, coded as
dummy variable.
Guarantee Money Collected by platform operator in advance to
pay money back to customers. Sellers can choose
the amount of Guarantee Money they allocate to the platform
operators.
Description Score Scores provided by customers after receiving
products to describe whether the information offered
by shoppers matches the real product(s); the range of the score
is 1 (very bad) to 5 (very good).
Return Rate Number of returns divided by sales in the specific
month.
Return Number Returns in absolute number.
Return100 Return rate * 100.
Sales Number of sales (operationalized by the number of good,
77. normal and bad comments).
Industry Return Rate Average return rate in this shop’s main
business’ industry.
0
50
100
150
200
250
300
0% 25% 50% 75% 100% 125% 150%
F
r
e
q
78. u
e
n
c
y
Return Rate in %
Fig. 2 Histogram of return rate in %
Determining profilt-optimizing return policies 109
Table 4 Impact of return policies on sales
Robust Regression
Dependent Variable Sales
Model 1 (Without interaction) Model 2 (With interaction)
Coef. P-value Coef. P-value
82. *** p<0.001, ** p<0.01, * p<0.05, ▪ p<0.1. Significant parts are
marked in bold, n=592
W. Zhou, O. Hinz110
(γ1=−7.038e-04, p<0.01) and increase the return number if
shops already have return records (ß1=4.813e-05, p<0.01).
The reason is that sellers with a better reputation (more past
sales) are more likely to face an opportunist (e.g., purchase,
use and return of clothing on purpose). And then due to the
large number of sales, even with the same return rate, the
absolute return number increases. So in both, the zero-
inflation and count model, reputation – as we have operation-
alized it – increases the return number. Meanwhile, it appears
that a higher amount of Guarantee Money reduces the number
of returns, likely because it speaks to the return policy’s cred-
ibility. Specifically, if a shop were to increase its Guarantee
Money by one Yuan, the expected return number in 1 month
would decrease by a factor of exp(ß3)=0.998 (p<0.1) while
holding all other variables constant. But at the same time, the
odds that a shop has certain non-returns would decrease by a
factor of exp (γ3)=0.997 (p<0.01). In other words, the higher
the Guarantee Money, the less likely shops have certain non-
83. returns. On the other hand, the Seven-Day Return policy only
works in the negative binomial part. By adopting this return
policy, shops’ expected return number is exp(ß2)=1.414 (p=
0.110) times the expected return number for other shops.
These results definitely support H2 and H4.
To our surprise, the Industry Return Rate influences return
behavior only in the zero-inflation model (γ6=4.620e+01, p=
0.008). In other words, whether shops have return records
largely depends on industry characteristics, while specific re-
turn numbers depend mainly on the shops’service or customer
fit (as outlined before in our paper).
We also examine the return rate (Return100) (see Model 4
in Table 5, R-square=0.0142). Although the ZINB model for
the return number (see Model 3 in Table 5, R-square=0.0339)
fits the data better (according to AIC and R-square value),
examining the return rate does yield some valuable informa-
tion. Specifically, Reputation and Seven-Day Return policy
stand out as the major differences: we find that the effect of
reputation on returns is not robust. The second one shows that
the adoption of the Seven-Day Return policy would increase
the return number, but at the same time decrease the return rate
(ß2=−4.989e-01, p<0.01). In other words, this return policy
increases sales and returns concurrently, but the influence on