

Recommended
More Related Content
What's hot
What's hot (20)
Viewers also liked
Similar to Pick of the week: ABB
Similar to Pick of the week: ABB (20)
Recently uploaded
Recently uploaded (20)
Pick of the week: ABB
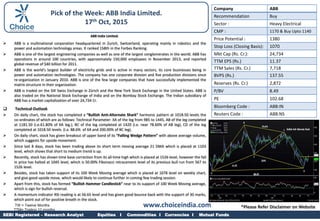
- 1. ABB India Limited. ABB is a multinational corporation headquartered in Zurich, Switzerland, operating mainly in robotics and the power and automation technology areas. It ranked 158th in the Forbes Ranking. ABB is one of the largest engineering companies as well as one of the largest conglomerates in the world. ABB has operations in around 100 countries, with approximately 150,000 employees in November 2013, and reported global revenue of $40 billion for 2011. ABB is the world's largest builder of electricity grids and is active in many sectors, its core businesses being in power and automation technologies. The company has one corporate division and five production divisions since re-organization in January 2010. ABB is one of the few large companies that have successfully implemented the matrix structure in their organization. ABB is traded on the SIX Swiss Exchange in Zürich and the New York Stock Exchange in the United States. ABB is also traded on the National Stock Exchange of India and on the Bombay Stock Exchange. The Indian subsidiary of ABB has a market capitalization of over 24,734 Cr. Technical Outlook On daily chart, the stock has completed a “Bullish Anti-Alternate Shark” harmonic pattern at 1018.50 levels the co-ordinates of which are as follows: Technical Parameter: XA of the leg from 985 to 1445, AB of the leg completed at 1181.50 (i.e.61.80% of XA leg.), BC of the leg completed at 1420 (i.e. near 78.60% of AB leg), CD of the leg completed at 1018.50 levels. (I.e. 88.6% of XA and 200.00% of BC leg). On daily chart, stock has given breakout of upper band of its “Falling Wedge Pattern” with above average volume, which suggests for upside movement. Since last 8 days, stock has been trading above its short term moving average 21 DMA which is placed at 1103 level, which shows that short to medium trend is up. Recently, stock has shown time base correction from its all-time high which is placed at 1526 level, however the fall in price has halted at 1045 level, which is 50.00% Fibonacci retracement level of its previous bull run from 567 to 1526 level. Besides, stock has taken support of its 100 Week Moving average which is placed at 1078 level on weekly chart, and give good upside move, which would likely to continue further in coming few trading session. Apart from this, stock has formed “Bullish Hammer Candlestick” near to its support of 100 Week Moving average, which is sign for bullish reversal. A momentum indicator RSI reading is at 56.65 level and has given good bounce back with the support of 30 marks, which point out of for positive breath in the stock. Company ABB Recommendation Buy Sector : Heavy Electrical CMP : 1170 & Buy Upto 1140 Price Potential : 1380 Stop Loss (Closing Basis): 1070 Mkt Cap (Rs. Cr.): 24,734 TTM EPS (Rs.) 11.37 TTM Sales (Rs. Cr.) 7,718 BVPS (Rs.) 137.55 Reserves (Rs. Cr.) 2,872 P/BV 8.49 PE 102.68 Bloomberg Code : ABB:IN Reuters Code : ABB.NS TW = Twelve Months TTM= Trailing 12 months SEBI Registered – Research Analyst Equities I Commodities I Currencies I Mutual Funds Pick of the Week: ABB India Limited. 17th Oct, 2015 www.choiceindia.com *Please Refer Disclaimer on Website
- 2. Pick of the Week: ABB India Limited. 17th Oct, 2015 SEBI Certified – Research Analyst Equities I Commodities I Currencies I Mutual FundsSEBI Registered – Research Analyst Equities I Commodities I Currencies I Mutual Funds This is solely for information of clients of Choice Broking and does not construe to be an investment advice. It is also not intended as an offer or solicitation for the purchase and sale of any financial instruments. Any action taken by you on the basis of the information contained herein is your responsibility alone and Choice Broking its subsidiaries or its employees or associates will not be liable in any manner for the consequences of such action taken by you. We have exercised due diligence in checking the correctness and authenticity of the information contained in this recommendation, but Choice Broking or any of its subsidiaries or associates or employees shall not be in any way responsible for any loss or damage that may arise to any person from any inadvertent error in the information contained in this recommendation or any action taken on basis of this information. Technical analysis studies Aprilket psychology, price patterns and volume levels. It is used to forecast future price and Aprilket movements. Technical analysis is complementary to fundamental analysis and news sources. The recommendations issued herewith might be contrary to recommendations issued by Choice Broking in the company research undertaken as the recommendations stated in this report is derived purely from technical analysis. Choice Broking has based this document on information obtained from sources it believes to be reliable but which it has not independently verified; Choice Broking makes no guarantee, representation or warranty and accepts no responsibility or liability as to its accuracy or completeness. The opinions contained within the report are based upon publicly available information at the time of publication and are subject to change without notice. The information and any disclosures provided herein are in sumAprily form and have been prepared for informational purposes. The recommendations and suggested price levels are intended purely for trading purposes. The recommendations are valid for the day of the report however trading trends and volumes might vary substantially on an intraday basis and the recommendations may be subject to change. The information and any disclosures provided herein may be considered confidential. Any use, distribution, modification, copying, forwarding or disclosure by any person is strictly prohibited. The information and any disclosures provided herein do not constitute a solicitation or offer to purchase or sell any security or other financial product or instrument. The current performance may be unaudited. Past performance does not guarantee future returns. There can be no assurance that investments will achieve any targeted rates of return, and there is no guarantee against the loss of your entire investment. POTENTIAL CONFLICT OF INTEREST DISCLOSURE (as on date of report) Disclosure of interest statement – • Analyst interest of the stock /Instrument(s): - No. • Firm interest of the stock / Instrument (s): - No. Disclaimer Contact Us Kunal Pamar (Research Associate) kunal.pamar@choiceindia.com PERFORMANCE TRACKER www.choiceindia.comcustomercare@choiceindia.com Ritesh Patel(Research Associate) ritesh.patel@choiceindia.com Amit Pathania (Research Associate) amit.pathania@choiceindia.com Vikash Chaudhri (Research Associate) vikas.chaudhari@choiceindia.com Date Lot Size Type of Call Equity Initiated SL TGT Result % Return Profit / Loss Total Profit 14.08.15 125 Buy ACC 1378-1360 1300 1550 Book Part Profit @ 1445 on 19.08.15 4.86 67 8375 22.08.15 100 Buy BAJAJCORP 488-505 455 600 Stopped out on 24.08.15 -9.90 -50 -5000 28.08.15 125 Buy BAJAJ-AUTO 2260-2230 2130 2500 Book Profit @ 2475.50 on 05.10.15 11.01 246 30688 05.09.15 1000 Buy BHARTIARTL 353 325 410 Open 12.09.15 1000 Buy TVSMOTORS 228 215 272 Book Part Profit @ 243 on 07.10.15 6.58 15 15000 19.09.15 2000 Buy IDFC 131-133.70 121 160 Book Part Profit @ 140.65 on 21.09.15 5.20 7 13900 26.09.15 250 Buy JUBLFOOD 1595-1613 1525 1820 Book Part Profit @ 1685 on 05.10.15 5.64 90 22500 03.10-15 250 Buy LT 1490-1475 1400 1675 Book Part Profit @ 1565 on 12.10.15 5.00 75 10.10.15 1000 Buy ICICBANK 286-278 265 335 Open Total 85463 Kunal Parmar Digitally signed by Kunal Parmar DN: cn=Kunal Parmar, o=Choice Equity Broking Pvt Ltd., ou=Research Dept., email=kunal.parmar@choiceindia.com, c=IN Date: 2015.10.17 15:41:02 +05'30'