SlideShare a Scribd company logo
1 of 133
Download to read offline
SOME SIX SIGMA IMPERATIVES FOR
INDIAN FOUNDRIES:
A CASE STUDY
By
Bikram Jit Singh
Professor
MMDU Mullana
Main Focus
1. Introduction
2. Research Plan
3. Literature Survey
4. Research Gap
5. Problem Formulation
6. Objectives of Study
7. Research Work Findings
8. Case Study Based on DMAIC
9. Result Appraisal
10. Economic Analysis
11. Conclusions
12. Scope in Future
13. References
14. Publications From Work
FOUNDRIES OVER THE WORLD
• 35000 foundries in the world with annual
production of 90 MMT
• Provide employment to about 20 million
people.
• Indian foundry industry is the fourth largest in
the world.
• There are more than 7,000 foundries in India
INTRODUCTION
FOUNDRIES IN INDIA
• 80% of foundries are in SME sector.
• Sector employs 0.5 million people directly and
1.5 million indirectly.
• Rs 7000 per ton produced to National
exchequer by way of Excise and other levies.
TYPES OF FOUNDRIES IN INDIA
FOUNDRY CUSTOMERS
Performance
Norms
Indian
Foundries
Overseas
Foundries
Production per annum (%) 8 to 9 92 to 93
Rejection (%) 10 to 25 2 to 12
Capacity Utilization (%) 45 to55 60 to 75
Productivity (T/Man/Year) 12 to 20
100 to 120 (Japan)
50 to 55 (Germany)
10 to 30 (China)
Energy Requirement
(KWH/T)
700 to 900 400 to 600
Comparison of Indian and
Overseas Foundries
• For global competitiveness, Indian industries need
overall operational and service excellence and are
extensively engaged in Quality Circles, TQM and ISO
Certification (Panchal, 2010).
However, these methods have failed to deliver required
performance over the last decade or so (Sadagopan et al.,
2005).
• It has been seen that Six Sigma is not fully explored by
Indian industries (Antony and Banuelas, 2002). With the
reduction of geographical barriers and the pressure of
competing in the global market, overall operational and
service excellence has become a necessity for these
industries to remain globally competitive (Rao and Rao,
2007).
Quality Programmes Undertaken
• Satisfaction with other quality and productivity improvement
initiatives turned out to be the strongest reason for not
embarking on Six Sigma program, followed by lack of
awareness and unsuitability of the initiative to their type of
business (Montgomery, 2009).
• Approximately 30 per cent of them have applied Six
Sigma in their business operations and the remaining 70
per cent are yet to experience the Six Sigma initiative for
a number of reasons (Sehwail and Yong, 2003).
SO…
To check low productivity levels and for global
competitiveness, this industry must strive hard to
achieve overall operational excellence in business by
looking for flexibility, shorter lead time and defects
reduction; because only such a configuration of
production system can fulfill the customer
expectations.
In this context Six Sigma can be a powerful business
improvement strategy, that enables industry to use
simple but powerful statistical methods for achieving
operational excellence.
SIX SIGMA ??
A break through strategy to significantly
improve customer satisfaction and shareholder
value by reducing variability in every aspect
of our business
Improve Performance & Service
• reduce defects
• stabilize processes
• customer satisfaction
Reduce Costs
• improve efficiency
• eliminate waste (3.4 ppm)
• reduce cost of poor quality
SIX SIGMAS PARADIGMS
SN Years/Author
Company /
Unit
Parameters
Achievements;
Financial Savings
LARGE SCALE UNITS
1. 1986-2001 Motorola In-process defect level 200-times reduction;
$15billions
2. 1996-1999 General Electric Turnaround time at
repair shops
62% reduction; $2billions
3. 1998-2000 Honeywell Concept to shipment
cycle time
Reduced from 18 months
to 8 months; $1.2 billions
4. 2000-2002 Ford recalls and production
delays
Reduced defects by 70%;
$1billions
5. 2000-2002 Caterpiller Quality improvement,
Reduced cost structure
Reduced defects by 75%;
Not Reported
6. 1999-2002 Our lady of
Lourdes Medical
Centre
Hospital bed availability
delays
Bed availability reduced
from 267 to 235 minutes
(12% reduction); $66000
MEDIUM SCALE UNITS
1. Ingle and Roe
(2001)
Medium sized
welding unit
Optimization of welding
process parameters
Joint strength is increased
by 26% and scrap work is
reduced by 3%
2. Zu et al. (2008) A bulb
manufacturing
SME
Improve the process
and reduced the shell
cracking of bulbs
Sigma level increased from
3.1 to 4.5
3. Sharma (2003) Baxer Battery
Limited
Life of battery
increased by 15% by
proper utilizing of
resources.
Customer satisfaction and
12% annual increased in
sale.
4. Holtz and
Campbell
(2004)
Ford Motors Maintenance
management by
improving MTBF.
Savings of $ 60000
achieved in six months.
Sigma level improved from
1.4 to 2.1
5. Wang et al., et
al. (2006)
A medium scale
IC engine
manufacturing
unit
Improve the Cpk Process capability
improved from 1.1 to 2.9
SMALL SCALE UNITS
1. Johnson
(2002)
Orange box Limited Office seat and
furniture design
£60000 saving
2. Basu (2004) A washing machine
manufacturing unit
Failure of drum
bearings
reduction in customer
complaints and customer
satisfaction achieved
3. Marti (2005) A Steel valves and
fittings manufacturing
unit
Production
planning
improvement
50% improvement in delivery
failures and a level of 2 sigma
achieved
4. Desai (2006) Two wheeler
automobile company
Gear pinion noise Noise reduced by 13%, Sigma
level increased from 3.134 to
3.944
5. Gadallah
(2009)
“P S Soot Girani Ltd”
Maharashtra -a cotton
mill
Manufacturing
system
performance
Sigma level improved result in
production of premium quality
yarn
MICRO SCALE UNITS
1. Byrne (2003) Carriage and
Wagon Works
Axle rejection 59% reduction in axle
rejections
2. Wang et al.
(2004)
Tata Honeywell
Limited
Travel costs per
kilometer per month
Decreased travel cost
3. Flott (2000) General Electric
company
Keys for successful
implementation of
quality tools
Finding Keys factors for
successful implementation
4. Antony et al.
(2007)
A Bulb
manufacturing
unit
Shell cracking of bulb Sigma level increased from
3.2 to 4.5
5. Garg (2010) Indian
automobile
sector
Effective
implementation of
quality tools in Indian
automobile sector
Finding Success factors
RESEARCH PLAN
OBJECTIVES OF THE STUDY
LITERATURE SURVEY
RESEARCH GAPS
PROBLEM FORMULATIONS
RESEARCH PLAN
IMPLEMENTATION OF SIX SIGMA’S
DMAIC METHODOLOGY
EXECUTION OF EACH PHASE AS PER
PROPOSED FRAMEWORK
RESULT APPRAISAL
CONCLUSIONS AND SCOPE FOR FUTURE WORK
RESEARCH FINDINGS: A CASE STUDY
LITERATURE SURVEY
The following issues were predominantly addressed
during an extensive literature review on various aspects of
Six Sigma and its application to foundry industry. These
issues primarily covered in various journals, reference
manuals, handbooks, text books, e-resources etc are:
a) Six Sigma: Concept and Evolution
b) Six Sigma in Manufacturing Sector
(a) SIX SIGMA-CONCEPT AND EVOLUTION
A chronological review of the concept of Six Sigma is given in
table
Six Sigma- The Concept
SN Author(s) Six Sigma as a Concept
1. Behara et al. (1995) Six Sigma is a rating that signifies “best in class”, with only 3.4 defects per million units or
operations. A defect can be anything froma faulty part to an incorrect customer bill.
2. Katayama and
Bennett (1996)
Six Sigma is a rigorous data gathering and statistical analysis technique which can be used
to pinpoint sources of errors and suggests ways of eliminating them.
3. Mikel (1997) Six Sigma is a systematic, highly disciplined, customer-centric and profit-driven
organization-wide strategic business improvement initiative.
4. Hendricks and
Kelbaugh (1998)
A quality improvement program with a goal of reducing the number of defects to as low as
3.4 parts per million opportunities or 0.0003 per cent.
5. Hahn et al. (1999) Six Sigma is a quality improvement initiative and quality management framework which is
disciplined for quality improvement through defect reduction.
6. Sanders and Hild
(2000)
Six Sigma methodologies link the tools and techniques in a sequential manner. Finally, Six
Sigma creates a powerful infrastructure for training of Champions, Master Blac k Belts etc.
7. Ingle and Roe
(2001)
A philosophy that employs a well-structured continuous improvement methodology to
reduce process variability and drive out waste frombusiness using various techniques.
8. Antony (2002) A business performance improvement strategy that aims to reduce the number of defects –
to as low as 3.4 occasions per million opportunities
9. Hong and Goh
(2003)
Six Sigma is a customer focus, data-driven, and robust methodology, which is well rooted
in mathematics and statistics. It is based upon the phenomenon of defect reduction
10. Markarian (2004) Six Sigma is a business improvement strategy that seeks to find and eliminate causes of
defects in business process by focusing on outputs that are critical for customers.
11. Marti (2005) Sigma is basically Greek term for variation. Six Sigma is extremely structured program
whose prime objective is to improve business process by minimizing the variation.
12. Kwak and Anbari
(2006)
A business strategy used to improve business profitability, to improve the effectiveness
and efficiency of all operations to meet or exceed customer needs and expectations
13. McCarty and Fisher
(2007)
Six Sigma becomes ingrained in the cultural context of the organization and represents a
management and cultural philosophy of process orientation and continuous improvement.
14. Hamza (2008) Six Sigma is a process improvement methodology that aims to increase business
performance through accurate focus. It is a symmetric approach to achieve improvement.
15. Snee (2009) A strategic, company-wide, approach focusing on variation reduction, projects have the
potential of simultaneously reducing cost and increasing customer satisfaction
16. Pepper and
Spedding (2010)
Six Sigma is an approach to the improvement of the quality of products or services which
strive for near perfection. I.e. not more then 3.4 DPMO.
Table depicts certain themes whose synergy with Six
Sigma has created considerable interest among the
researchers during the last 15 years.
Themes Related to Six Sigma
SN Themes References
1. Quality
Approaches
Hoerl (1998); Hild et al. (2000); Klefsjo et al. (2001); Sadagopan et al. (2005); Jones
and Johnson (2009); Parsad and Reddy (2010)
2. Six Sigma
Education
Echempati and White (2000); Maleyeff and Kaminsky (2002); Sehwail and De Yong
(2003); Rao and Rao (2007); Gijo and Scaria (2010)
3. DAMIC/DFSS
Methodology
Bayle et al. (2001); Kuei and Madu (2003); Antony (2006); Bandyopadhyay and
Jenicke (2007); Montgomery (2009)
4. Tools and
Techniques
Hendricks and Kelbaugh (1998); Graves (2002); Banuelas and Antony (2003);
Banuelas et al. (2005); Antony (2007); Harjac et al. (2008)
5. Belt System Henderson and Evans (2000); Ingle and Roe (2001); Andersson et al. (2006);
Savolainen and Haikonen (2007); Schroeder et al. (2008)
6. Benefits Behara et al. (1995); Johnson (2002); Kueiand Madu (2003); Chan et al. (2005);
Das et al. (2006); Agarwaland Bajaj (2008)
7. Organizational
Change
Carnell and Lambert (2000); Brewer (2004); Craven et al. (2006); Davison and Al-
Shaghana (2007); Fazzariand Levitt (2008)
8. Challenges Feld and Stone (2002); Goh and Xie (2004); Gijo and Rao (2005); Goh et al.
(2006); Kumar (2007);
9. Success Factors Antony and Banuelas (2002); Antony and Fergusson (2004); Buch and Tolentino
(2006); Chung et al. (2008)
10. Organizational
Learning
Carnell and Lambert (2000); De Feo and Bar-El(2002); Box (2006); Savolainen
and Haikonen (2007);
SN Research Methodology References
1. Case-Focused Articles Smith (1993); Behara et al. (1995); Hoerl (1998); Does et al.
(2002); Brett and Queen (2005); Horell and Snee (2010)
2. Review-Focused Articles Kuei and Madu (2003); Andersson et al. (2006); ; Rao and Rao
(2007); Aggogeri and Gentili (2008)
3. Survey-Focused Articles Bhatnagar and Pandey (2005); Chakrabarty and Tan (2007);
Chang and Wang (2008); Nabeel et al. (2010)
Nature of Research Methodology Used for Six Sigma
Among the surveyed articles of last 20 years, 63 percent
were classified as empirical using either surveys or case
studies, while about 37 percent of the articles were
theoretical articles that usually employ extensive literature
review to focus on the development of concepts, propositions,
models or theory building.
(b) SIX SIGMA IN
MANUFACTURING INDUSTRY
SN Author(s) Company / Unit Parameters Achievements
1. Henderson &
Evans (2000)
General Electric
Company
Implementation as a quality
tool. Reduced the cycle time at
repair shops.
Annual saving of $2 billion
Process improvement done
2. Ingle and Roe
(2001)
Medium sized welding
unit
Optimization of welding
process parameters
Joint strength is increased by
26% and scrap work is reduced
by 3%
3. Does et al.
(2002)
A bulb manufacturing
SME
Improve the process and
reduced the shell cracking of
bulbs
Sigma level increased from 3.1
to 4.5
Table cites major works of the researchers related to
application of Six Sigma in manufacturing sector during
the past decade.
4. Sharma
(2003)
Baxer Battery Limited Life of battery increased by
15% by proper utilizing of
resources.
Customer satisfaction and 12%
annual increased in sale.
5. Holtz and
Campbell
(2004)
Ford Motors Maintenance management by
improving MTBF.
Savings of $ 60000 achieved in
six months. Sigma level
improved from 1.4 to 2.1
6. Hu et al.
(2005)
A mediumscale IC
engine manufacturing
unit
Improve the Cpk Process capability improved
from 1.1 to 2.9
7. Sokovic et al.
(2006)
A gravity die casting unit Casting scrap reduced from
23% to 11%
40% reduction in
manufacturing cost with
annual savings of $72000 p.a.
8. Aggogeri and
Gentili
(2008)
Cranberry Drinks Ltd. Improvement in packing
process.
DPMO level improved from
3011 to 178 only. 17%
reduction in packing time.
9. Kuthe and
Tharakan
(2009)
Wilson Tools Shorten the heat treatment time Roughly $10000 per year
savings. 2% reduction in
overall Lead time
10. Bewoor and
Pawar (2010)
A copper wire
manufacturing plant
Quality improvement in rolling
operation
Defect are decreased by 19%
with in nine months of
DMAIC project
• After an extensive literature review, it appears that the
application of Six Sigma in companies other than the big
multinational companies has been rare and inconsistent.
Little evidence exists in literature on Six Sigma
implementation in foundry industry, which is counted as
the most important supplier to other manufacturing
industries. Since SME industries are facing serious
sickness levels, an attempt can be made to implement Six
Sigma over various systems and sub systems to
considerably improve their respective productivity levels.
• Literature has also reported tremendous financial gains
through Six Sigma in large manufacturing sector, so an
attempt can be made to replicate it in foundry SME sector too.
RESEARCH GAPS
PROBLEM FORMULATION
• Govt. had introduced “Automotive Mission Plan” (AMP-2006) to rise the
GDP by four times up to 2016.
• Main focus of Govt. is on boosting Auto sector industries (that’s why
Car production is increasing exponentially after 2006)
• Due to which orders of foundries (as a major Supplier of most of parts)
have also been elevated from last 6 to 7 years.
• But Indian foundries showed their in-capabilities to supply ordered
quantities because of poor performance & productivity levels.
IMPACT of AMP (2006-2016)
• Auto industries are importing casted parts from other countries
like; China, USA, Australia and Russia.
• It means our domestic foundries are losing business because of
their poor production and quality levels.
So Primarily, the major objectives of the present study are:
• To formulate a comprehensive strategy for the successful
implementation of Six Sigma in Indian foundry industry
without ignoring its existing constraints.
• To provide standard step by step methodologies to
execute different phases of DMAIC projects
successfully in Indian foundry environments.
• To devise a strategy for selection of right tool/technique for
right problem.
• To demystify the different myths prevailing about Six
Sigma in Indian SMEs after implementing it in a SME itself.
OBJECTIVES OF THE STUDY
ABOUT ORGANIZATION
• A case study has been carried out in a non-ferrous foundry at
Federal Mogul India Limited Bhahadurgarh, Patiala (Punjab)
Foundry has a covered area of about 50144 sq. m and was
established in 1954.
• It is a medium scale unit used to cast pistons for export and
domestic market. It uses mostly semi-automatic die casting
machines. The unit under study casts pistons of diameter
range from 30mm to 300mm and is capable to manufacture
13 million pistons per annum.
RESEARCH WORK FINDINGS
• Location: Patiala, Punjab, India
• Product : Pistons, Pins
(by semi-automatic die casting)
• FM Share: 48.4%
• TS 16949,
• OHSAS 18001,
• ISO 14001
FEDERAL MOGUL GOETZE
INDIA LIMITED
LEADING CUSTOMERS
PISTON FOUNDRY
MELTING
NAAM Casting Cell
Domestic Casting Cell
HEAT TREATMENT
DIE - CASTING
Alloy Si Cu Mg Ni Fe
FM132 8.5~10.5 2.0~4.0 0.5~1.5 0.5 Max 1.0
FM425 14.8~18 1.9~2.9 0.5~1.0 0.35~0.8 0.85
FM413/CSA12/
AC8A
11~13.5 0.5~1.3 0.8~1.5 0.7~1.3 0.8
CSA18 16~19 0.8~1.5 0.8~1.5 0.8~1.5 0.75
CSA24 22~26 0.5~1.3 0.8~1.5 0.7~1.3 0.7
VERTICAL GRAVITY DIE
CASTING
(Twin Cavity Mould)
VERTICAL
GRAVITY DIE
CASTING
(Single Cavity
Mould)
DEFINE
• Problem
• Voice of customer
• Project charter
• Project planning
• Project scheduling
• Snaps of problem
• History of problem
• COPQ matrix
• Project goal
• Process by SIPOC
diagram
MEASURE
• Measure Cpk of
process
• Calculate present
sigma level
• Pareto charts to
find reasons of
scrap
• Brainstorming by
5Ms
• Access CTQs by
Process mapping
• Cause and effect
matrix of CTQs
• MSA
• (Gauge R&R)
• (Bias checking)
• (Stability test)
ANALYSE
•Analysis of Shift
dependency by Chi-
square test
•Analyse the variation
of B.T. with Die coating
thickness by One way
ANOVA
•Apply 2-Sample t-test
to verify the effect of
In-gate design on scrap
•Analyse the impact of
Operator-skill by 2-
sample t-test
• Multi-Regression
analysis of Casting
process- parameters
• Fish bone -analysis of
Metal sticking on pins
of die
• Why-Why analysis of
Dimensional in -
accuracy of machine
variables
IMPROVE
• Optimization
of process-
parameters
by Full
factorial DOE
• Continuous
Improvement
s by Kaizens
• Poka-Yoke
for machine
& Die
CONTROL
• Evaluation of
sigma level
after
improvement
• X-bar R chart
for
controlling
Bottom
thickness
variation of
Piston.
• P-charts to
vigil overall
scrap
continuously
under its
control limits
PHASES OF DMAIC STUDY
The first step was to precisely define the problem, keeping
in mind business objectives, customer needs and feed
back. This involves identification of Critical to Quality (CTQ)
issues and other items that have an impact on quality and
customer satisfaction.
Major Tools Used
Voice of Customer (QFD), Project Charter, Project Scheduler,
Snaps of Problem, Historical analysis of problem, COPQ Matrix,
Process by SIPOC Diagram and Project Goals.
1. DEFINE PHASE
PROPOSED FRAMEWORK FOR
D-PHASE
Θ Θ Θ Θ
ImportancetoCustomer
EvaultionofVendors
GoodProcessControls
ReductioninScrapdueto
CastingDefects
LessDie/MachineSetuptime
Implementationof
MaintenanceSchedules
EnsureAdherenceofQuality
System
GoodInspectionPlans
Technology
Upgradation/Innovation
TrainingPlansforWorkForce
EfficientSchedulingto
completeProductionOrders
Completeness
Criteria
M M H H M H M M L M
15 15 45 45 15 45 15 15 5 15
L M H M M M M M L L
5 15 45 15 15 15 15 15 5 5
M M M N L H H L M N
12 12 12 0 4 36 36 4 12 0
N M L H L L L H M M
0 15 5 45 5 5 5 45 15 15
L M H N N M M M M N
5 15 45 0 0 15 15 15 15 0
L L N N N L N H M L
3 3 0 0 0 3 0 27 9 3
H M H N L M M M M L
27 9 27 0 3 12 12 12 12 3
M H L N H M M M L N
15 45 5 0 15 15 15 15 5 0
M M H N L M L M N M
9 9 27 0 3 9 3 9 0 9
M M H L M M M M H H
15 15 45 5 15 15 15 15 45 45
IMPORTANCE RATING OF X's 106 153 256 110 75 170 131 172 123 95
10%
Symbol Relationship Between X & Y Rating
H Strong (H) 9
M Medium (M) 3
L Weak (W) 1
N No Relation (N) 0 Θ
5
3
5
3
5
5
4
3
5
5
6
5
4
3
Meet Deadlines/Schedules
Strong Information System
Reduce Rework
TARGET DIRECTION
1
7
Satisfy Quality Initiatives (Overall Quality of the Product)
Reduction in Production Cost
Reduce Waste
Develop Closer Supplier Relations
Less Dimensional Problems
Accountabilty of Supplied Product
2
Cycle Time Reduction
Targer Directions
More is Better
Less is Better
Specific Amount
125
48
117
130
230
150
VOC ( Machine Shop)
TARGET VALUE OF CTC (Critical to Customer) FACTOR
128
155
78
23010
9
8
VOC (HOUSE OF QUALITY)
NON MEAUUREABLE DEFECTS
CASTING DEFECTS
MEAUREABLE DEFECT
(BT VARIATION)
0.00%
5.00%
10.00%
15.00%
20.00%
25.00%
30.00%
35.00%
40.00%
Jan Feb Mar Apr May Jun
H-273 (Avg. 21.5%)
H-749 (Avg. 20.9%)
H-519 (Avg.22.5%)
HISTORICAL ANALYSIS OF
SCRAP
COPQ MATRIX
Financial Parameters H-273 H-519 H-749
Average Scrap/Month 1,866 1,100 885
Scrap Cost/Piston 183 183 183
Total Rejection Cost/ Month 3,41,478 2,01,300 1,61,955
Total Rejection Cost / Year 40,97,736 24,15,600 19,43,460
Total Rejection Cost for H-
family Pistons Annually
84,56,796
SIPOC DIAGRAM
Phases
Scheduled Dates Actual Dates
Start date End date Start date End date
Define 01/07/10 15/7/10 01/07/10 15/7/10
Measure 16/7/10 15/8/10 16/7/10 15/8/10
Analyse 16/8/10 07/10/10 16/8/10 22/9/10
Improve 08/10/10 22/11/10 23/9/10 30/11/10
Control 23/11/10 31/12/10 01/12/10 31/12/10
Schedule Chart
Scheduled dates are decided after brain storming with concerned
people from production, maintenance and quality departments.
Actual dates are filled as different phases were accomplished
with time.
Measure phase is the second step after defining the
problem which involves measurement system analysis,
capability studies and finding performance gaps for the
identified problem.
Major Tools Used
Sigma Calculator, Cpk study, Pareto Charts, FMEA Table,
Cause and Effect Matrix, Gauge R&R study, Bias Checking
and Stability Test.
2. MEASURE PHASE
PROPOSED FRAMEWORK FOR
M-PHASE
PROCESS MAPPING OF FOUNDRY
Step 5:
F
A B B,C C D E
J,K,L I
H G
Steps
10.- Die preparation Input Classification
20.- Ingots transportation to foundry Critic
30.- Ingots storage (in Cell) Controlled
40.- Furnace charge Noise
50.- Melting
60.- Degassing and flux treatment A.- Die coating
70.- Holding time and impurity flotation B.- Furnace charge relation
80.- Start up casting cell machine C.- Molten metal temperature
90.- Pouring D.- Density Index (ID)
100.- Croppers E.- Cycle time
110.- AQFD F.- Pouring speed
120.- Visual inspection and baskets accommodation G.- AQFD
130.- Storage before heat treatment H.- Without visual defects
140.- Heat Treatment I.- Aging
150.- Q.A. Release J.- Microstructure
160.- Transportation to release material area K.- Hardness
170.- Storage before machining L.- Chemical analysis
Write Down and Classify the Key Process Input
CTQ's
10 20 30 40 50 60
ID=1,5 max.
Si
No
70
80 90
100
110120130
Si
No
Scrap
130140150
Si
No
Scrap
160
170
Die temperature
Die coating density
Spray gun
Free of humidity
Free of slag
Charge relation
(60 Ingot /40 scrap)
Temperature
Metal Temp.
N2 Flow
RPM
Time Time
Water cooling
system
Cycle time
Pouring speed
Ladle cleaning
Metal temperature
Die Coating
Water cooling time
Water coling temp.
Ingate separation
AQFD
Free of visual
defects
Separate in baskets by
cavity
Temperature
Time
Chemical Analysis
Microstructure
Hardness
Q.A. Release card
10 20 30 40 50 60
ID=1,5 max.
Si
No
70
80 90
100
110120130
Si
No
Scrap
130140150
Si
No
Scrap
160
170
10 20 30 40 50 60
ID=1,5 max.
Si
No
70
80 90
100
110120130
Si
No
Scrap
130140150
Si
No
Scrap
160
170
SIGMA CALCULATION
(EXISTING)
Production results of June-2010
Total number of Machined parts 8482
Scrap type Nos.
Bottom Thickness Defect 480
Blow Holes 432
Cold Lap 120
Depression 120
Hydrogen Porosity 48
Shrinkage 457
Defective Pin Hole 210
Total Scrap in June 1866
Nos. of Opportunities 7
DPMO 31428
Sigma Level of Process 3.43
Yield (%) 76.96
10.089.929.769.609.449.289.12
LSL USL
LSL 9.5
Target *
USL 9.9
Sample Mean 9.59583
Sample N 60
StDev (Within) 0.150559
StDev (O v erall) 0.210772
Process Data
C p 0.44
C PL 0.21
C PU 0.67
C pk 0.21
Pp 0.32
PPL 0.15
PPU 0.48
Ppk 0.15
C pm *
O v erall C apability
Potential (Within) C apability
PPM < LSL 333333.33
PPM > USL 83333.33
PPM Total 416666.67
O bserv ed Performance
PPM < LSL 262219.76
PPM > USL 21678.76
PPM Total 283898.52
Exp. Within Performance
PPM < LSL 324670.34
PPM > USL 74494.82
PPM Total 399165.15
Exp. O v erall Performance
Within
Overall
Process Capability W.R.T. BT (BEFORE)
Cpk STUDY
NUMBERS 26 19 52426 203 133 99 98 52 40 32
Percent 2.2 1.6 4.436.1 17.2 11.3 8.4 8.3 4.4 3.4 2.7
Cum % 94.0 95.6100.036.1 53.3 64.6 73.0 81.3 85.7 89.1 91.8
DEFECTS
Other
Cold
lap
Def. Blanks
Inside
Porosity
Skirt
Shrinkage
Skirt
Blow
Holes
Bottom
Shrinkage
Bottom
Porosity
Ring
Zone
Blow
Holes
Ring
Zone
Bottom
thickness
variation
Shrinkage
Ring
Zone
1200
1000
800
600
400
200
0
100
80
60
40
20
0
NUMBERS
Percent
Pareto Chart of H-749
PARETO CHART FOR DEFECTS
CTQ PROCESS FACTORS
Critic
Control
Noise
10 9 9 6 6 10 9
Defective
blanksbottom
BlowHoles
ColdLaps
Depression
Hydrogen
Porosity
Shrinkage
DefectivePin
Hole
S.NO Process Step Process Input
1 Design Bottom Seating Design 5 0 0 3 0 0 0 68
2 Design Gate Feeding Design 3 3 3 0 2 5 0 146
3 Die repair Dimensional accuracy of Die parts 5 0 2 5 0 0 0 98
4 Die repair Dimensional accuracy of casting Machine parts 4 0 1 3 0 0 0 199
5 Set up Die Temperature & Preheating 0 5 4 0 5 5 2 179
6 Set Up Die Cooling Connections 0 5 4 0 4 4 0 145
7 Set Up Die Coating Thickness 4 4 4 0 4 4 0 176
8 Set up Water Cooling Pressure too low 0 3 0 0 5 4 0 97
9 Set up Discharge of Cooling water inside die parts 0 5 3 0 3 5 0 140
10 Set up Vaccum Pressure in air vents 0 3 5 0 4 2 0 116
11 Set up Ratio of water to Dycote 0 3 4 0 3 2 0 101
12 Casting Low Pouring Speed 0 2 5 0 0 3 0 93
13 Casting Die Core grouping 3 0 0 2 0 0 0 42
14 Casting Non-continuity in casting process 0 3 5 2 5 5 0 164
15 Casting Metal Sticking on Pin 0 0 0 5 0 0 5 75
16 Pouring Casting Temperature too High 0 4 0 0 5 5 0 116
17 Pouring Casting Temperature too Low 0 4 3 0 5 5 2 161
18 Pouring Degassing Procedure & waiting time 0 5 2 0 4 5 0 137
19 Pouring Skill of Operator 3 1 3 1 2 2 2 122
270 450 432 126 306 560 99
CAUSE AND EFFECT MATRIX
TotalEFFECTS
Correlation of Input to Output
Characteristic
RATING OF IMPORTANCE TO CUSTOMER
Actions Decided
GAUGE R&R STUDY (MSA)
PART NAME :PISTON GAGE NAME : BT CHECKING INSTRUMENT
CHARACTERISTICS:BOTTOM THICKNESS GAGE NO.: MBT-03 L.C 0.01 MM
SPECIFICATIONS :0.40 MM
DATA SHEET
PART AVERAGE
APPRAISER TRIALS 1 2 3 4 5 6 7 8 9 10
AVTAR SINGH 1 8.12 7.88 8.16 8.00 7.81 8.12 7.88 7.87 8.13 8.10
2 8.10 7.86 8.16 8.00 7.80 8.11 7.87 7.88 8.12 8.10
3 8.11 7.86 8.13 8.02 7.81 8.10 7.87 7.88 8.12 8.10
Average 8.11 7.87 8.15 8.01 7.81 8.11 7.87 7.88 8.12 8.10 Xa= 8.00
Range 0.02 0.02 0.03 0.02 0.01 0.02 0.01 0.01 0.01 0.00 Ra= 0.01
NACHATTAR SINGH 1 8.12 7.88 8.16 8.02 7.81 8.12 7.88 7.87 8.13 8.10
2 8.10 7.87 8.14 8.00 7.80 8.11 7.86 7.86 8.12 8.11
3 8.11 7.86 8.13 8.02 7.80 8.10 7.87 7.88 8.11 8.10
Average 8.11 7.87 8.14 8.01 7.80 8.11 7.87 7.87 8.12 8.10 Xb= 8.00
Range 0.02 0.02 0.03 0.02 0.01 0.02 0.02 0.02 0.02 0.01 Rb= 0.02
MOHINDER SINGH 1 8.10 7.88 8.16 8.00 7.81 8.12 7.88 7.87 8.13 8.10
2 8.10 7.90 8.16 8.00 7.82 8.11 7.90 7.88 8.12 8.11
3 8.12 7.86 8.13 8.02 7.81 8.12 7.87 7.88 8.12 8.10
Average 8.11 7.88 8.15 8.01 7.81 8.12 7.88 7.88 8.12 8.10 Xc= 8.01
Range 0.02 0.04 0.03 0.02 0.01 0.01 0.03 0.00 0.01 0.00 Rc= 0.02
16 Part Ave Xp 8.11 7.87 8.15 8.01 7.81 8.11 7.88 7.87 8.12 8.10 Rp= 0.34
17 Ra+Rb+Rc/N ofApraiser R= 0.0170
18 Max X-Min X=Xdiff Xdiff= 0.0047
19 R* D4 =UCLR UCL 0.044
20 R* D3 =LCLR LCL 0
Two-Way ANOVA Table With Interaction
Source DF SS MS F P
PartID 9 0.948327 0.105370 1433.24 0.000
Operator 2 0.000243 0.000122 1.65 0.219
PartID * Operator 18 0.001323 0.000074 0.92 0.564
Repeatability 30 0.002400 0.000080
Total 59 0.952293
Alpha to remove interaction term = 0.25
Two-Way ANOVA Table Without Interaction
Source DF SS MS F P
PartID 9 0.948327 0.105370 1358.39 0.000
Operator 2 0.000243 0.000122 1.57 0.219
Repeatability 48 0.003723 0.000078
Total 59 0.952293
Gage R&R
%Contribution
Source VarComp (of VarComp)
Total Gage R&R 0.0000798 0.45
Repeatability 0.0000776 0.44
Reproducibility 0.0000022 0.01
Operator 0.0000022 0.01
Part-To-Part 0.0175487 99.55
Total Variation 0.0176285 100.00
Study Var %Study Var
Source StdDev (SD) (6 * SD) (%SV)
Total Gage R&R 0.008932 0.053590 6.73
Repeatability 0.008807 0.052844 6.63
Reproducibility 0.001485 0.008909 1.12
Operator 0.001485 0.008909 1.12
Part-To-Part 0.132471 0.794829 99.77
Total Variation 0.132772 0.796633 100.00
Number of Distinct Categories = 20
Part-to-PartReprodRepeatGage R&R
100
50
0
Percent
% Contribution
% Study Var
0.04
0.02
0.00
SampleRange
_
R=0.01067
UCL=0.03485
LCL=0
1 2 3
8.2
8.0
7.8
SampleMean
__
X=8.0047
UCL=8.0247
LCL=7.9846
1 2 3
10987654321
8.2
8.0
7.8
PartID
321
8.2
8.0
7.8
Operator
10987654321
8.2
8.0
7.8
PartID
Average
1
2
3
Operator
Gage name: B.T. Gauge
Date of study : 02/08/10
Reported by : Bikram jit singh
Tolerance: 0.40mm
Misc:
Components of Variation
R Chart by Operator
Xbar Chart by Operator
Measure by PartID
Measure by Operator
Operator * PartID Interaction
Gauge R & R for B.T. Gauge
GAUGE R&R STUDY
BIAS STUDY
PART NAME: H-273
Gaug Name & Immersion Pyrometer Parameter Temperature
L.C. 1 degree
Appraiser Name Sukhdev Singh - 50972
Reference Value. 755 Degree C
TRIALS(n)
1 756 1.000
2 754 0.000
3 749 -6.000
4 750 -5.000
5 751 -4.000
6 752 -3.000
7 752 -3.000
8 754 -1.000
9 753 -2.000
10 753 -2.000
11 752 -3.000
12 752 -3.000
13 750 -5.000
14 747 -8.000
15 745 -10.000
751.33333 -3.600000
-3.66667
Plot Histogram related to the reference value
Anayse the histogram for any special cause
Max(Xi)-Min(Xi)
Calculate s Reapatability( sr)= d2* 3.0956877
Where d2* & d2 is taken from the table(appendix C)
d2*= 3.5533
Calculate Where n = no. of trials d2= 3.4179
sb 0.7993031
1.7189648
Lower limit -5.38563
Pyrometer is biased and need Caliberation
Upper limit -1.94770 or repair
BIAS
n
rs
X Bias
BIAS STUDY (MSA)
Date Feb 1 3 4 5 6 7 8 10 11 12 13 14 15 18 19 20 21 22 24 25
Time
X1
X2
X3
X4
N/s
M/s
A/s N/s
1 2 3 4 5 6 7 8 9 10 11 12 13 14 15 16 17 18 19 20
X1 0.4 0.3 0.4 0.6 0.3 0.4 0.4 0.4 0.5 0.4 0.3 0.3 0.4 0.3 0.4 0.1 0.6 0.4 0.4 0.3
X2 1.2 0.2 0.3 0.4 0.4 0 0.5 0.3 0.3 0.3 0.4 1.2 0 0.4 0.3 0.2 0.4 0.5 0.4 0.4
X3 0.5 0.3 0.4 0.4 0.4 0.2 0.3 0.5 0.4 0.3 0.5 0.2 0.4 0.3 0.5 0.2 0.4 0.4 0.3 0.3
X4 0.2 0.4 0.3 0.4 0.4 0.4 0.4 0.4 0.4 0.6 0.5 2.3 0.5 0.4 0.5 0 0.5 0.4 0.4 0.3
Xbar 0.5750 0.3000 0.3500 0.4500 0.3750 0.2500 0.4000 0.4000 0.4000 0.4000 0.4250 1.0000 0.3250 0.3500 0.4250 0.1250 0.4750 0.4250 0.3750 0.3250
Range 1.000 0.200 0.100 0.200 0.100 0.400 0.200 0.200 0.200 0.300 0.200 2.100 0.500 0.100 0.200 0.200 0.200 0.100 0.100 0.100
Sub Group Size= 4 A2= 0.729 D3= 0 D4= 2.28 D2=
Standard deviation (s) R =
Gauge stability= s X100 %
BIAS CONTROL CHART METHOD BIAS
ULX = d2=
Xdbar = = =
LCLx = d2*=
UCLr = tv,1-a/2 = Lower Limit =
R bar =
LCL = 0 alpha = 0.05 Upper Limit =
Result Gage is not well stable
0.036220294
0.163
0.4075
2.05875
0.3350
0.76
2.06813
2.000
0.479612034
0.40750
0.16198208
28.26765674
0.6517
2.059
0.197873597
0.335388
R
e
a
d
I
n
g
s
Tolerance
*2d
R
r =s
g
r
b
s
s =
STABILITY TESTING (MSA)
STABILITY TEST
PART NAME : GAUGE NAME &L.C: Vac Tester
TOLERANCE : MM
MASTER VALUE: mm
X=Averrage X UCL= X+A2R= LCL=X - A2R=
R = average R UCL=D4xR LCL=D3xR 0
0.4075
0.3350 0.7645
CSA-18 alloy
0.70
0.16330.6517
0.00
0.0000
0.1000
0.2000
0.3000
0.4000
0.5000
0.6000
0.7000
0.8000
0.9000
1.0000
1 2 3 4 5 6 7 8 9 10 11 12 13 14 15 16 17 18 19 20
0.0000
0.5000
1.0000
1.5000
2.0000
1 2 3 4 5 6 7 8 9 10 11 12 13 14 15 16 17 18 19 20
Oneunit=Oneunit=
ucl
Lcl
ucl
Lcl
MEAN & RANGE CHARTS
3. ANALYSE PHASE
The authenticity and impact realization of each SSV on
scrap, is required to be judged by conducting suitable
investigation under Analyze Phase. This phase helps to
focus improvement efforts on those SSVs which can be
highly significant for positive scrap reduction.
Major Tools Used
Table ahead gives a summary of various quantitative and
qualitative techniques/tools used for analyzing the
measured critical to quality (CTQ) process parameters.
ANALYSIS of SSVs
Type of Analysis Technique
used
Name of Tool used SSV’s to be analysed
Hypothesis testing (OFAT)
Chi Square test Analysis of Shift dependency
One way ANOVA Die coating thickness
2 Sample t-test
In gate design (or Vol. of R&R)
Operator skill
Discharge of Cooling water
MFAT Multi-regression analysis
Alloy temperature
Die temperature
Delay time
Graphical Analysis Interaction Plot Vaccume Pressure
Qualitative technique
Fish-bone analysis Metal sticking on a pin
Why-why analysis
Machine‘s dimensional In-
accuracy
ANALYTICAL PLAN
Null Hypothesis Ho: µ1 = µ2 = µ3
Actual Hypothesis Ha: µ1 ≠ µ2 ≠ µ3
Shifts Production Good Scrap
Bottom
thickness
variation
Blow hole Porosity Shrinkage Depression Cold lap Pin hole defect
Night Shift (1) 128 102 26 13 4 1 3 2 1 2
Morning Shift (2) 124 100 24 8 6 2 3 1 2 2
Afternoon Shift (3) 127 101 27 10 2 3 5 2 3 2
( Scrap depends upon the shifts)
(Scrap is independent of Shifts)
Chi-square Test
TEST FOR SHIFT DEPENDENCY
Session Confirmation from Minitab
Expected
value =
(Row obs. total) * (Column obs. total)
Grand observation Total
Expected Value of “B.T.” in Defect
type of the N/S
E = (26 X 31)/77 = 10.47
Chi-Square = (O-E) / E
Chi-Square = (13-10.47) /10.47
= 0.613
2
2
Since P Value > 0.05 ;
Reject Ha , Accept Ho
Hence Scrap in piston
foundry is independent of
shifts
B.T.vary B. hole Prsty Shrkg Dep. C. lap P.H. defect Total
1 13 4 1 3 2 1 2 26
10.47 4.05 2.03 3.71 1.69 2.03 2.03
0.613 0.001 0.520 0.137 0.058 0.520 0.000
2 8 6 2 3 1 2 2 24
9.66 3.74 1.87 3.43 1.56 1.87 1.87
0.286 1.365 0.009 0.054 0.200 0.009 0.009
3 10 2 3 5 2 3 2 27
10.87 4.21 2.10 3.86 1.75 2.10 2.10
0.070 1.158 0.382 0.339 0.035 0.382 0.005
Total 31 12 6 11 5 6 6 77
Chi-Sq = 6.150, DF = 12, P-Value = 0.908
Df= 2(n-1) n= no. Of sub groups
CHI SQUARE CALCULATIONS
Null Hypothesis Ho: µ1 = µ2 = µ3 = µ4
Actual Hypothesis Ha: µ1 ≠ µ2 ≠ µ3 ≠µ4
Die coating thickness 50µm Die coating thickness 80µm Die coating thickness 110µm Die coating thickness 140µm
9.81 9.80 9.70 9.70
9.70 9.71 9.87 9.80
9.80 9.80 9.80 9.70
9.90 9.89 9.58 9.67
9.70 9.75 9.68 9.71
9.60 9.62 9.60 9.80
9.80 9.65 9.67 9.89
9.76 9.75 9.85 9.75
9.70 9.66 9.95 9.62
9.87 9.66 9.80 9.65
9.80 9.77 9.76 9.75
9.58 9.58 9.66 9.70
9.68 9.68 9.61 9.87
9.60 9.58 9.70 9.80
9.67 9.67 9.80 9.58
9.85 9.85 9.70 9.86
9.95 9.95 9.67 9.90
9.80 9.88 9.71 9.70
9.53 9.53 9.80 9.87
9.95 9.95 9.89 9.80
(Diecoating thickness do not effect Bottom thickness variation)
(Diecoating thickness effects Bottom thickness variation)
One way ANOVA to analyse B.T. defect with Die coating thickness
ANOVA TEST
FOR COATING THICKNESS
One-way ANOVA: Die coating , Die coating , Die coating , Die coating
Source DF SS MS F P
Factor 3 0.0054 0.0018 0.15 0.932
Error 76 0.9361 0.0123
Total 79 0.9415
S = 0.1110 R-Sq = 0.57% R-Sq(adj) = 0.00%
Level N Mean St Dev
Die coating thickness 50 20 9.7525 0.1217
Die coating thickness 80 20 9.7365 0.1236
Die coating thickness 110 20 9.7400 0.1021
Die coating thickness 14 0 20 9.7560 0.0935
Individual 95% CIs For Mean Based on
Pooled St Dev
Level -+---------+---------+---------+--------
Die coating thickness 50 (----------------*---------------)
Die coating thickness 80 (----------------*---------------)
Die coating thickness 11 (----------------*---------------)
Die coating thickness 14 (---------------*---------------)
-+---------+---------+---------+--------
9.690 9.720 9.750 9.780
Df= n-1 (n= nos. of data population or groups)
Since p value is coming
out to be more than
0.05, so Null hypothesis
is accepted.
Hence in present case,
Die- coating thickness do not
effect the Bottom- thickness
variation, substantially.
ANOVA STATISTICS
ANOVA GRAPHS
Die
coating
thickness
140µm
Die
coating
thickness
110µm
Die
coating
thickness
80µm
Die
coating
thickness
50µm
10.0
9.9
9.8
9.7
9.6
9.5
Data
Individual Value Plot of thickness 50µm, 80µm, 110µm, 140µm
Die
coating
thickness
140µm
Die
coating
thickness
110µm
Die
coating
thickness
80µm
Die
coating
thickness
50µm
10.0
9.9
9.8
9.7
9.6
9.5
Data
Boxplot of thickness 50µm, 80µm, 110µm, 140µm
0.40.30.20.10.0-0.1-0.2-0.3-0.4
99.9
99
95
90
80
70
60
50
40
30
20
10
5
1
0.1
Residual
Percent
Normal Probability Plot
(responses arethickness 50µm, 80µm, 110µm and 140µm)
Null Hypothesis Ho: µ1 = µ2 Volume of riser & runner has no impact on casting scrap
Actual Hypothesis Ha: µ1 ≠ µ2 Volume of riser & runner has impact on casting scrap
Trails
With Existing volume of
Runner & Riser
(240-250 cubic cm)
With Enlarged volume of Runner
& Riser
(260-270 cubic cm)
1 18% 15%
2 20% 16%
3 19% 14%
4 17% 12%
5 21% 13%
6 16% 11%
Taken 50 pistons per trail to assess the actual scrap in %age
Analysis of Scrap(in %age) with variation in Volume of Riser & Runner
2 Sample t-test
2 SAMPLE t-TEST FOR
IN-GATE DESIGN
Conclusion: as P
value is <0.05
So, Discard Ho and
Accept Ha.
It implies, there is a
relation between
Runner & Riser
Volume and casting
scrap.
Two-Sample T-Test and CI: With Existing volume of , With Enlarged
volume of
Two-sample T for With Existing volume of Runner vs With Enlarged
volume of Runner
N Mean StDev SE Mean
With Existing volume of 6 0.1850 0.0187 0.0076
With Enlarged volume of 6 0.1350 0.0187 0.0076
Difference = mu (With Existing volume of Runner) - mu (With Enlarged
volume of Runner)
Estimate for difference: 0.0500
95% CI for difference: (0.0259, 0.0741)
T-Test of difference = 0 (vs not =): T-Value = 4.63
P-Value = 0.001
DF = 10 2(n-1)
n= number of trails or group size
t-TEST CALCULATIONS
2 Sample t - TEST GRAPHS
With Enlarged volume of RunnerWith Existing volume of Runner
22.00%
20.00%
18.00%
16.00%
14.00%
12.00%
10.00%
Data
Individual Value Plot of Existing V/s Enlarged R & R
With Enlarged volume of RunnerWith Existing volume of Runner
22.00%
20.00%
18.00%
16.00%
14.00%
12.00%
10.00%
Data
Boxplot of Existing V/s Enlarged volume of R & R
23.00%
22.00%
21.00%
20.00%
19.00%
18.00%
17.00%
16.00%
15.00%
14.00%
99
95
90
80
70
60
50
40
30
20
10
5
1
With Existing volume of Runner
Percent
Mean 0.185
StDev 0.01871
N 6
AD 0.136
P-Value 0.947
Probability Plot With Existing volume of R & R
Normal
18.00%16.00%14.00%12.00%10.00%
99
95
90
80
70
60
50
40
30
20
10
5
1
With Enlarged volume of Runner
Percent
Mean 0.135
StDev 0.01871
N 6
AD 0.136
P-Value 0.947
Probability Plot With Enlarged volume of R & R
Normal
Conclusion: as P value is <0.05
So, Discard Ho and Accept Ha.
It implies, Operator skill has an
impact over scrap
Two-Sample T-Test and CI: Semi-skilled Die operator, Skilled Die operator
Two-sample T for Semi-skilled Die operator vs Skilled Die operator
N Mean StDev SE Mean
Semi-skilled Die operato 6 0.1833 0.0216 0.0088
Skilled Die operator 6 0.1367 0.0216 0.0088
Difference = mu (Semi-skilled Die operator) - mu (Skilled Die perator)
Estimate for difference: 0.0467
95% CI for difference: (0.0189, 0.0745)
T-Test of difference = 0 (vs not =): T-Value = 3.74
P-Value = 0.004
DF = 10
IMPACT OF OPERATOR SKILL
24.00%22.00%20.00%18.00%16.00%14.00%12.00%
99
95
90
80
70
60
50
40
30
20
10
5
1
Semi-skilled Die operator
Percent
Mean 0.1833
StDev 0.02160
N 6
AD 0.143
P-Value 0.934
Probability Plot of Semi-skilled Die operator
Normal
20.00%18.00%16.00%14.00%12.00%10.00%
99
95
90
80
70
60
50
40
30
20
10
5
1
Skilled Die operator
Percent
Mean 0.1367
StDev 0.02160
N 6
AD 0.143
P-Value 0.934
Probability Plot of Skilled Die operator
Normal
Skilled Die operatorSemi-skilled Die operator
22.00%
20.00%
18.00%
16.00%
14.00%
12.00%
10.00%
Data
Individual Value Plot of Semi-skilled Die operator, Skilled Die operator
Skilled Die operatorSemi-skilled Die operator
22.00%
20.00%
18.00%
16.00%
14.00%
12.00%
10.00%
Data
Boxplot of Semi-skilled Die operator, Skilled Die operator
GRAPHICAL RESULTS
24.00%22.00%20.00%18.00%16.00%14.00%12.00%
99
95
90
80
70
60
50
40
30
20
10
5
1
Discharge (3-5 LPM)
Percent
Mean 0.1817
StDev 0.02317
N 6
AD 0.191
P-Value 0.818
Probability Plot of Discharge (3-5 LPM)
Normal
18.00%16.00%14.00%12.00%10.00%
99
95
90
80
70
60
50
40
30
20
10
5
1
Discharge (7-10LPM)
Percent
Mean 0.1383
StDev 0.01941
N 6
AD 0.329
P-Value 0.380
Probability Plot of Discharge (7-10LPM)
Normal
Discharge (7-10LPM)Discharge (3-5 LPM)
22.00%
20.00%
18.00%
16.00%
14.00%
12.00%
10.00%
Data
Individual Value Plot of Discharge (3-5 LPM), Discharge (7-10LPM)
Discharge (7-10LPM)Discharge (3-5 LPM)
22.00%
20.00%
18.00%
16.00%
14.00%
12.00%
10.00%
Data
Boxplot of Discharge (3-5 LPM), Discharge (7-10LPM)
RESULTS FOR DISCHARGE OF WATER
P = 0.007
Alloy Temperature Stoppage (IN Sec) Die Temp
Total
pistons
Scrap
%age of
Scrap
755 50 239.7 10 4 40.0
757 85 251.8 5 2 40.0
760 45 240 8 3 37.5
763 5 265 7 0 0.0
764 35 273.6 13 2 15.4
765 120 283 17 6 35.3
752 90 276.7 10 2 20.0
754 10 250.2 10 3 30.0
Mean Multi Regression Data
ANALYSIS OF CASTING PARAMETERS
REGRESSION STATISTICS
Regression Analysis: %ageof Scrap versus Alloy Temp.,Stoppage(in secs) & Die Temp.
Theregression equationis
%ageof Scrap = 114 + 0.118 Alloy Temperature+0.306 Stoppage(in Sec) - 0.745 DieTemp
Predictor Coef SE Coef T P
Constant 114.4 476.2 0.24 0.822
Alloy Temperature 0.1184 0.6554 0.18 0.865
Stoppage(INSec) 0.30615 0.08153 3.76 0.020
DieTemp -0.7454 0.2130 -3.50 0.025
S = 7.70734 R-Sq = 83.5% R-Sq(adj)=71.1%
Analysisof Variance
Source DF SS MS F P
Regression 3 1200.75 400.25 6.74 0.048
ResidualError 4 237.61 59.40
Total 7 1438.37
Source DF Seq SS
Alloy Temperature 1 129.92
Stoppage(INSec) 1 343.56
DieTemp 1 727.28
As P>0.05 forAlloy temp.
It implies it is already in control.
As P<0.05 for Stoppage or delay
It implies it effects Scrap positively.
As P<0.05 for Die temperature
It implies it also effects Scrap
substantially.
As P<0.05 for overall regression
It implies, its input variables have
impact on dependent variables.
INTERATCTION PLOT DATA
Die No. Vaccume Pressure( in atm) Scrap (in %age)
1 0.2-0.3 14
1 0.4-0.5 16
1 0.6-0.7 17
1 0.8-0.9 21
2 0.2-0.3 15
2 0.4-0.5 15
2 0.6-0.7 18
2 0.8-0.9 20
3 0.2-0.3 12
3 0.4-0.5 14
3 0.6-0.7 16
3 0.8-0.9 19
4 0.2-0.3 14
4 0.4-0.5 19
4 0.6-0.7 21
4 0.8-0.9 22
Beside this parameter (Vaccume pressure) affects the scrap,
but as we already working in the range of 0.2-0.3 bar, so scope
of further reduction in Scrap by optimizing Vaccume Pressure,
is not substantial
0.8-0.90.6-0.70.4-0.50.2-0.3
21
18
15
12
4321
21
18
15
12
Die No.
Vaccume Pressure( in atm)
1
2
3
4
No.
Die
0.2-0.3
0.4-0.5
0.6-0.7
0.8-0.9
(in atm)
Pressure
Vaccume
Data Means
FISH BONE ANALYSIS
(FOR PIN DEFECTS)
Pin hole
Defective
Die
Environment
Measure
Methods
Material
Machines
Man
bed management policies
by HR Dept.
Poor grief management
Lack of trainig audits
worries)
Distraction (mental
casual labours
Faulty procedure to selct
In adequate Training
Zerking of hydraulic rams
time
Given less soldification
parts
Play in between the die
Improper die closing
Non flatness of M/c bed
Moulds
Haphazard movement of
Fix the
No criteria to
control plan
Absence of
the coating
No control over
Selection of
Improper
material coating
Lack of parting
temperature of
Low
unskilled labour
Deputation of
training
Scaracity of Process
procedures
Non-standard set-up
supevision
In adequate
Absence of check lists
procedure
Lack of standard
caliberation
No check on
needed gadgets
Scaracity of
maintenance of
Poor
identify
No system to
assessment
Improper Risk
installing
Lack of MSA for
enviornmental
Absence of
conditions
Bad enviornmental
Less space
Bad state of 5-S
Lack of illumination
Poor working posture
coating
Wear & tear of
coating on Pins
Scarcity of
before set-up
Dirty Pins
on Pins
Metal sticking
Pins
Blunt edges of
diameter
Variable Pin
Out of control Causes
With in control Causes
Die Machine Material Method Man Measurement Enviornment
VariablePin diameter Haphazard movementof Moulds Lowtemperatureof metal Lack of standard procedure In adequateTraining Lack of MSAfor installing instruments Poor working posture
Bluntedges of Pins Non flatnessof M/c bed Lack of parting materialcoating Absenceof check lists Faulty procedureto selctcasuallabours Improper Risk assessment Lack of illumination
Metalsticking on Pins Improper dieclosing Improper Selection of parting material In adequatesupevision Distraction (mentalworries) No system to identify deficiencies Bad stateof 5-S
Dirty Pins beforeset-up Play in between thedieparts No controlover thecoating thickness Non-standard set-up procedures Lack of trainig audits Poor maintenanceof instruments Less space
Scarcity of coating on Pins Given less soldification time Absenceof controlplan Scaracity of Processtraining Poor grief managementby HRDept. Scaracity of needed gadgets Bad enviornmentalconditions
Wear &tear of coating Zerking of hydraulic rams No criteria to Fix therecoating period Deputation of unskilled labour bed managementpolicies No check on caliberation periods Absenceof enviornmentalsurveys
ROOT CAUSE RESULTS
WHY - WHY ANALYSIS FOR M/C
Improper
seatingof
Die’s
bottom
(B.T.
variation)
Bottom and catcher
assembly mounted
on sameRam
Mis-alignment of
Die’s bottom w.r.t.
mould seat
Play or mis-
alignment of
bottom
carryingRam
Bottom tooland
catcher design of
machineis faulty
Operator’serror
Die is not checked
properlyby Die-
fitter beforeset-up
or installation
Only fourcorner
head padsare
provided for
bottom guidance
Seating
arrangementof
Die’s bottom is not
proper.
Problem in Die
design
Faulty Die-
checking/passing
procedure
Key reasons
Non-criticalreasons
RESULT AFTER A-PHASE
Type of Analysis Technique
used
Name of Tool used SSV’s to be analysed
Hypothesis testing (OFAT)
Chi Square test Analysis of Shift dependency
One way ANOVA Die coating thickness
2 Sample t-test
Volume of Runner & riser
Operator skill
Discharge of cooling water
MFAT Multi-regression analysis
Alloy temperature
Die temperature
Delay time
Graphical Analysis Interaction Plot Vaccume Pressure
Qualitative technique
Fish-bone analysis Metal sticking on a pin
Why-why analysis
Machine’s dimensional in-
accuracy
OUTCOMES OF ANALYSE PHASE
4. IMPROVE PHASE
In this phase actions are piloted and real
tolerances are established to deliver desired
performance. Various suggestions and new
activities are added during optimization of the
out-put variable.
Major Tools Used:
Design of Experiments (DOE), Tanguchi’s
Method, RSM, Poka-Yoke, Kaizen etc.
STEP-1
STEP-2
Improvement by optimizations
Improvement by incorporating
Error proofing
Define objective of improve phase As prescribed from D, M and A phase
Improve
Phase
Principles of Poka-Yoke, Pilot Studies
DoE, RSM, Tanguchi Methods,
Product/Process Simulation
Technological innovation and
overhauling
Triz, Creativity, Quality Tools etc.
Improvement through Continuous
improvements
Kaizen, Quality Circles, TPM, TQM, 5S
Improvement by virtue of Training
and knowledge
Six Sigma Black Belt, Green Belt Training,
Knowledge of Statistics
PROPOSED FRAMEWORK FOR I-PHASE
TOOL USED SSV’s TO BE IMPROVED
OPTIMIZATION
WITH DESIGN OF EXPERIMENTS (DOE)
Volume of Runner & riser
Discharge of cooling water
Die temperature
Delay time
POKA-YOKE
Machine’s dimensional in-accuracy
KAIZEN
Metal sticking on a pin
Operator Skill On-Job Training
IMPROVEMENT PLAN
DESIGN OF EXPERIMENTS
StdOrder RunOrder CenterPt Blocks Die Temp Discharge of water Delay Volume of R&R
3 1 1 1 -1 1 -1 -1
27 2 1 1 -1 1 -1 1
6 3 1 1 1 -1 1 -1
4 4 1 1 1 1 -1 -1
1 5 1 1 -1 -1 -1 -1
29 6 1 1 -1 -1 1 1
23 7 1 1 -1 1 1 -1
13 8 1 1 -1 -1 1 1
11 9 1 1 -1 1 -1 1
14 10 1 1 1 -1 1 1
9 11 1 1 -1 -1 -1 1
19 12 1 1 -1 1 -1 -1
24 13 1 1 1 1 1 -1
22 14 1 1 1 -1 1 -1
28 15 1 1 1 1 -1 1
25 16 1 1 -1 -1 -1 1
8 17 1 1 1 1 1 -1
16 18 1 1 1 1 1 1
12 19 1 1 1 1 -1 1
26 20 1 1 1 -1 -1 1
32 21 1 1 1 1 1 1
17 22 1 1 -1 -1 -1 -1
18 23 1 1 1 -1 -1 -1
2 24 1 1 1 -1 -1 -1
15 25 1 1 -1 1 1 1
20 26 1 1 1 1 -1 -1
10 27 1 1 1 -1 -1 1
5 28 1 1 -1 -1 1 -1
31 29 1 1 -1 1 1 1
7 30 1 1 -1 1 1 -1
30 31 1 1 1 -1 1 1
21 32 1 1 -1 -1 1 -1
Factors/
Levels
Die Temperature
oC
Discharge of Water
(Litre/ Minutes)
Delay
(Seconds)
Volume of R&R
(Cm3)
Low 250 7 60 260
High 330 10 180 285
StdOrder RunOrder CenterPt Blocks Die Temp Discharge of water Delay Volume of R&R Scrap (%)
3 1 1 1 250 10 60 260 14
27 2 1 1 250 10 60 285 10
6 3 1 1 330 7 180 260 18
4 4 1 1 330 10 60 260 17
1 5 1 1 250 7 60 260 15
29 6 1 1 250 7 180 285 11
23 7 1 1 250 10 180 260 12
13 8 1 1 250 7 180 285 11
11 9 1 1 250 10 60 285 9
14 10 1 1 330 7 180 285 16
9 11 1 1 250 7 60 285 10
19 12 1 1 250 10 60 260 13
24 13 1 1 330 10 180 260 18
22 14 1 1 330 7 180 260 20
28 15 1 1 330 10 60 285 15
25 16 1 1 250 7 60 285 9
8 17 1 1 330 10 180 260 18
16 18 1 1 330 10 180 285 12
12 19 1 1 330 10 60 285 13
26 20 1 1 330 7 60 285 15
32 21 1 1 330 10 180 285 13
17 22 1 1 250 7 60 260 16
18 23 1 1 330 7 60 260 19
2 24 1 1 330 7 60 260 18
15 25 1 1 250 10 180 285 9
20 26 1 1 330 10 60 260 17
10 27 1 1 330 7 60 285 15
5 28 1 1 250 7 180 260 17
31 29 1 1 250 10 180 285 10
7 30 1 1 250 10 180 260 14
30 31 1 1 330 7 180 285 16
21 32 1 1 250 7 180 260 17
EXECUTION OF EXPERIMENTS
Factorial Fit: Scrap (%) versus Die Temp, Discharge of water,
Estimated Effects and Coefficients for Scrap (%) (coded units)
Term Effect Coef SE Coef T P
Constant 14.281 0.1362 104.84 0.000
Die Temp 3.937 1.969 0.1362 14.45 0.000
Discharge of water -1.813 -0.906 0.1362 -6.65 0.001
Delay 0.438 0.219 0.1362 1.61 0.128
Volume of R&R -4.313 -2.156 0.1362 -15.83 0.002
Die Temp*Discharge of water 0.062 0.031 0.1362 0.23 0.821
Die Temp*Delay -0.187 -0.094 0.1362 -0.69 0.501
Die Temp*Volume of R&R 0.563 0.281 0.1362 2.06 0.056
Discharge of water*Delay -0.687 -0.344 0.1362 -2.52 0.026
Discharge of water*Volume of R&R 0.312 0.156 0.1362 1.15 0.268
Delay*Volume of R&R -0.187 -0.094 0.1362 -0.69 0.501
Die Temp*Discharge of water*Delay 0.187 0.094 0.1362 0.69 0.501
Die Temp*Discharge of water* -0.813 -0.406 0.1362 -2.98 0.009
Volume of R&R
Die Temp*Delay*Volume of R&R -0.313 -0.156 0.1362 -1.15 0.268
Discharge of water*Delay* -0.313 -0.156 0.1362 -1.15 0.268
Volume of R&R
Die Temp*Discharge of water*Delay* -0.437 -0.219 0.1362 -1.61 0.128
Volume of R&R
S = 0.770552 PRESS = 38
R-Sq = 97.09% R-Sq(pred) = 88.36% R-Sq(adj) = 94.36%
DOE ANALYSIS OF
ORTHOGONAL MATRIX
151050-5-10-15-20
99
95
90
80
70
60
50
40
30
20
10
5
1
Standardized Effect
Percent
A Die Temp
B Discharge of water
C Delay
D Volume of R&R
Factor Name
Not Significant
Significant
Effect Type
ABD
BC
D
B
A
Normal Plot of the Standardized Effects
(response is Scrap (%), Alpha = .05)
C
BC
ABD
B
A
D
1614121086420
Term
Standardized Effect
2.06
A Die Temp
B Discharge of water
C Delay
D Volume of R&R
Factor Name
Pareto Chart of the Standardized Effects
(response is Scrap (%), Alpha = .05)
RELATIVE IMPACT OF
CTQ FACTORS
ONE FACTOR AT A TIME ANALYSIS
330250
16
15
14
13
12
107
18060
16
15
14
13
12
285260
Die Temp
Mean
Discharge of water
Delay Volume of R&R
Data Means
TWO WAY INTERACTION PLOTS
107 285260
18
15
12
18
15
12
18
15
12
330250
18
15
12
18060
Die Temp
Discharge of water
Delay
Volume of R&R
250
330
Temp
Die
7
10
of water
Discharge
60
180
Delay
260
285
of R&R
Volume
Data Means
10
910
15
8
50
20
100 7
150
Scrap (%)
Discharge of water
Delay
Surface Plot of Scrap (%) vs Discharge of water, Delay
Delay
Dischargeofwater
1801601401201008060
10.0
9.5
9.0
8.5
8.0
7.5
7.0
>
–
–
–
–
–
< 10
10 12
12 14
14 16
16 18
18 20
20
(%)
Scrap
Contour Plotof Scrap(%) vs Discharge of water, Delay
SURFACE PLOT FOR BC
THREE WAY INTERACTION PLOT
(ABD)
285
260
10
7
330250
Volume of R&R
Discharge of water
Die Temp
13.25
15.5010.25
9.50
17.50
18.7516.25
13.25
Scrap (y) = 57.4 + 0.03 (Die Temp) - 0.71 (Discharge of
water) + 0.03 (Delay) - 0.19 (Volume of R&R) -
0.003 (Discharge of water * Delay) + 7.13 (Die
temp. * Discharge * Volume of R&R)
Scrap (y) = 57.4 + 0.03 (A) - 0.71 (B) + 0.03 (C) - 0.19 (D) -
0.003 (B * C) + 7.13 (A * B * D)
OPTIMIZATION EQUATION
OPTIMIZATION BY
RESPONSE OPTIMIZER
Cur
High
Low0.99998
D
Optimal
d = 0.99998
Targ: 10.0
Scrap (%
y = 10.0002
0.99998
Desirability
Composite
260.0
285.0
60.0
180.0
7.0
10.0
250.0
330.0
Discharg Delay Volume oDie Temp
[250.0] [9.9602] [136.3636] [281.7172]
Response Optimization
Parameters
Goal Lower Target Upper Weight Import
Scrap (%) Target 8 10 20 1 1
Starting Point
Die Temp = 250
Discharge of = 7
Delay = 60
Volume of R& = 260
Solution
Die Temp = 250
Discharge of = 9.96019
Delay = 136.364
Volume of R& = 281.717
Predicted Responses
Scrap (%) = 10.0002 , desirability = 0.999982
Composite Desirability = 0.999982
OPTIMIZATION RESULTS
Existing Feeding System with
No Top Riser
After Modification Feeding System
with Top Riser Provided
CHANGE IN RUNNER & RISER DESIGN
Existing semi-automatic die casting Machine
POKA-YOKE FOR M/C
After improvement
semi-automatic die casting Machine
POKA-YOKE FOR M/C
VIDEOS OF MACHINE
IMPROVEMENT
Four
head
Pads for
sitting
Full Head
seat
Provided
For Head
Sitting
Existing Design Modified Design
SEATING ARRANGEMENT
(BOTTOM TOOL)
Graphite Coating on Die-Pins
Die-Pins with Metal Sticking 1. Pins sorted in the Stand
KAIZEN FOR DIE - PINS
2. Cleaning of Pins by Buffing 3. Dipping of Pins
in Caustic Soda solution for 2 hrs
STANDARD CLEANING PROCEDURE
4. Dipping of cleaned pins in
Graphite solution (1:2) for 50 mins
5. Pins after Cleaning
and Graphite Coating
Cell: H-273 Opistons
Master Trainer:
Shift: All Girish Kumar / Daljeet Singh
Supervisor:DPS/SM/MIJ
Status
Date:
30.08.2010
51051 TARLOK SINGH
To Be Trained for Temperature Checking of Holding Furnaces by 30 Sept.
51267 GURBAZ SINGH
To be trained to shot blast and clean the die with shot blasting machine by 4 oct.
51807 PAWAN KUMAR
to be trained to see temp by pyorometer by 30 sept.
51150 SUNIL KUMAR
To be Trained on Full Self Inspection by 30 Sept.
51751 JASSA SINGH
To be trained to do degassing and de slagging the molten metal by oct 5.
56771 GURMEET SINGH
Trained the working on die casting machine 20 by 4 oct.
DCM20
WASHINGMAN
TEMPERATURE
CHECKING
SELFINSPECTION
DCM9
DIEFITTER
LINEHELPER/RING
SHOTBLASTING
COREMAKING
Comments, Training Plans
TRAINING MATRIX
Capture Training Requirements
Empty
Square
No training completed to
date.
and produces the quantity required by production targets.
and is capable of training other team members.
Knows and applies all job instructions
and safety rules . . .
and ensures quality according to work
station job instructions.
23-Dec2-Dec11-Nov27-Oct7-Oct16-Sep26-Aug5-Aug15-Jul
26
24
22
20
18
16
14
12
10
Date
Scrap
Actual
Fits
Variable
Trend Analysis Plot for Scrap
Linear Trend Model
Yt = 25.20 - 0.518610*t
DOE Implementation
(7% reduction in scrap)
Poka-yoke of
M/C (2%) Kaizen (graphite
coating of Pin
2% )
Training of
human resource
(1%)
Target
Scrap
Parameters are
getting Out of
control
SCRAP REDUCTION ACHIEVED
5. CONTROL PHASE
In this phase, process monitoring and corrective or
preventive actions are documented and executed.
Basically this phase tries to check and monitor the
improved process and its parametric values.
Major Tools Used
Control Plan, X bar and R Chart for BT variation and p-
Chart for overall scrap tracking.
STEP-1
STEP-2
Final capability is re-defined
Checking the scope of achieved
improvements
Validate the measuring system Do necessary Calibration
Control
Phase
Transfer of technique among
similar areas
Sigma Calculator, Cpk Study
Sustaining the improved process Check Lists, Audit Sheets, 5S,
Poka-Yoke, TPM, Patrolling
teams etc.
Monitoring and revision of control
documents and risk management
Control Charts, SPC, Control
Plan, FMEA, CUMSUM Charts
Financial benefits reviewed Cost and Benefit Analysis
PROPOSED FRAMEWORK FOR C-PHASE
IMPROVED SIGMA LEVEL
Production Results of Dec-2010
Total number of Machined parts 14079
Scrap type Nos.
Bottom Thickness Defect 410
Blow Holes 320
Cold Lap 95
Depression 85
Hydrogen Porosity 40
Shrinkage 350
Defective Pin Hole 166
Total Scrap in December 1466
Nos. of Opportunities 7
DPMO 14875
Sigma Level of Process 3.67
Yield (%) 96.96
IMPROVED Cpk
9.909.849.789.729.669.609.54
LSL USL
LSL 9.5
Target *
USL 9.9
Sample Mean 9.71617
Sample N 60
StDev (Within) 0.0417718
StDev (O v erall) 0.0421897
Process Data
C p 1.60
C PL 1.72
C PU 1.47
C pk 1.47
Pp 1.58
PPL 1.71
PPU 1.45
Ppk 1.45
C pm *
O v erall C apability
Potential (Within) C apability
PPM < LSL 0.00
PPM > USL 0.00
PPM Total 0.00
O bserv ed Performance
PPM < LSL 0.11
PPM > USL 5.39
PPM Total 5.50
Exp. Within Performance
PPM < LSL 0.15
PPM > USL 6.58
PPM Total 6.73
Exp. O v erall Performance
Within
Overall
X BAR & R CHART FOR
BT VARIATION
5:00 AM3:00 AM1:00 AM11:00 PM9:00 PM7:00 PM5:00 PM3:00 PM1:00 PM11:00 AM9:00 AM7:00 AM
1 0 .0
9 .8
9 .6
9 .4
T ime
SampleMean
__
X=9.72
UCL=9.9516
LCL=9.4884
1 21 11 0987654321
0 .8
0 .6
0 .4
0 .2
0 .0
Sample
SampleRange
_
R=0.4014
UCL=0.8488
LC L=0
11
1
Xbar-R Chart of BT
p- CHART FOR
OVERALL SCRAP REDUCTION
30th
Dec
27th
Dec
24th
Dec
21st
Dec
18th
Dec
15th
Dec
12th
Dec
9th
Dec
6th
Dec
3rd
Dec
0.20
0.18
0.16
0.14
0.12
0.10
0.08
0.06
Time
individualpvalues
_
X=0.1043
UCL=0.1380
LCL=0.0707
111
1
1
1
1
1
1
1
p-value (np/n) chart
RESULT APPRAISAL
Parameters Before After DMAIC
DPMO 31,428 14,875
Cpk Index 0.21 1.47
Sigma Level 3.43 3.67
Scrap (%age) 21.7 10.4
Savings (Rs.) 30.7 Lakhs per Annum
With mere 0.24 improvement in Sigma Level
• In Improvement Phase, four casting process parameters (i.e.
Volume of R&R, Die temperature, Discharge of cooling
water and Delay with in process) have been optimized to
bring a significant reduction of 7% in scrap. The machine‟s
dimensional in-accuracy has been enhanced by altering the
design of machine through Poka-yoke principles and this
helped to achieve a net reduction of around 2% in scrap.
The metal sticking on pins has been avoided by introducing a
standard process of pin cleaning by using Kaizen rules of
continues improvement and hence bring a further eduction
of 2% in scrap. Then a proposed training schedule has
reduced the scrap by around 1%. So overall 11% to 12%
(approximately) reduction in scrap has been
achieved in Improvement Phase of the case study.
• Diversification of technology definitely increases the
financial/non financial benefits. It leads to stability of system,
which ultimately causes the customer satisfaction. After
successful reduction of scrap for H-273 pistons, the same
techniques and tools have been applied for other H-family
pistons like H-749 and H-519 pistons that are similar as far
as design, process parameters, casting machine and dies are
concerned.
• Total savings of around 30.7 lakhs per annum has been
assessed after improving the sigma level by 0.24 only.
1. H-273 pistons:
Average Scrap Saved per month = 400 (Approx.)
Scrap Cost per Piston = 183 (Approx.)
Total rejection cost saved per month = 400*183 = Rs 73,200/-
Total rejection cost saved per year = 73,200*12
= Rs 8, 78,400/-
2. H-519 pistons:
Average Scrap Saved per month = 600 (Approx.)
Scrap Cost per Piston = 183 (Approx.)
Total rejection cost saved per month = 600*183
= Rs 1, 09,800/-
Total rejection cost saved per year = 73,200*12
= Rs 13, 17,600/-
3. H-749 pistons:
Average Scrap Saved per month = 400 (Approx.)
Scrap Cost per Piston = 183 (Approx.)
Total rejection cost saved per month = 400*183 = Rs 73,200/-
Total rejection cost saved per year = 73,200*12 = Rs 8, 78,400/-
ECONOMIC ANALYSIS
• The existing high scrap (21.7% approx.) has been defined as
most serious issue as far as overall productivity of pistons is
concerned in foundry and machine shop.
• Casting scrap has been found primarily due to defects like;
shrinkage, bottom thickness variation, blow holes, porosity, pin
hole defect and cold lap.
• Process parameters (SSVs) like; In-gate design, dimensional
inaccuracy of machine, die temperature, die coating thickness,
discharge of cooling water, metal sticking on pins, alloy
temperature, shift dependency and operator skill have been
measured as main reasons of above defects in piston castings.
SUMMARY
• Although during Measurement System Analysis (MSA),
Gauge R&R of BT gauge has been found ok, yet Immersion
Pyrometer (Temp. measuring device) has been found Biased
and Vac-tester (Metal density checker) was coming out to be
un-stable over a span of one month only. So both the
measuring equipments were repaired and calibrated suitably
before starting Analyse phase.
• After analysis of all the eleven SSVs with appropriate statistical
tools, following seven critical process parameters have
emerged as responsible for high scrap. These are In-gate
design (Volume of Runner & Riser), operator skill, discharge
of cooling water, die temperature, delay time, metal sticking
on pins and dimensional in accuracy of machine.
• Earlier existing sigma level was 3.43 and after improvement it
has been raised by 0.24 but even this has resulted in savings
of around 30.7 lakhs per annum and is remarkable for a
medium scale make-to-order foundry unit.
• Overall scrap of foundry has been monitored by drawing
shift wise p-chart and controlled up to 10.43% only, after
Six Sigma case study. BT variation has also been
monitored at casting machine itself by chalking out X bar &
Range chart hourly. Cpk study has also been conducted
by SQC operator after every 4 shifts for time to time
process capability-checking of casting process with
respect to bottom thickness variation.
• This study has significantly reaffirmed the efficacy of Six
Sigma strategy in Indian foundry industry to reduce
scrap/waste from the operations, thus greatly improving the
production efficiency. It also demystify the myth that
Six-Sigma is only meant for big industries and require a lot
of effort money and training etc.
• „Project based‟ approach for Six Sigma implementation
(rather then planning or investing in different
phases of Six Sigma approach) is more motivating and
helps a lot to demystify various fears on Six Sigma.
CONCLUSIONS
• Researchers have laid more emphasis on defining
various tools and techniques of Six Sigma but „tool
selection criterion‟ for each phase, as per the given
constraints and environment, is not available to
industries.
• Due to lack of this vital information, usually wrong
tools and techniques are chosen and so DMAIC
project fails by moving in a wrong direction,
with course of time. But this fear is eradicated because
of step-wise proposed frameworks for each phase of
DMAIC project, which also categorizes concerned tools.
• The challenge for all organizations is to integrate
Six Sigma into their core business processes and
operations rather than managing it as a separate
initiative.
FUTURE SCOPE
• Beside non-ferrous foundries, Six Sigma approach can be
explored for ferrous foundries to bring breakthrough in
rejections and increase yield per annum.
• Six Sigma can also be used in energy intensive foundries,
as it not only enhances productivity by process
improvement but also it is a step to create „zero defect
foundries‟ which indirectly leads to huge energy savings.
• It can be implemented in green sand foundries specifically
in sand re-use plants for not only to reduce the lead time of
process but also to cast cost effective castings.
• Apart from foundry industries, other manufacturing
sectors like; forging, forming, welding and machining
industries can also take benefit to lean their business
operations.
• Six Sigma should further be explored service sector
like; hospitals, education institutes, banking, traffic etc
in India.
FUTURE SCOPE
•Agarwal, R. and Bajaj, N. (2008), “Managing outsourcing process: applying Six Sigma”, Business
Process Management Journal, Vol. 14, No. 6, pp. 829-37.
•Aggogeri, F. and Gentili, E. (2008), “Six Sigma methodology: an effective tool for quality management”,
International Journal of Manufacturing Technology and Management, Vol. 14, No 3/4, pp. 289-98.
•Andersson, R., Eriksson, H. and Torstensson, H. (2006), “Similarities and differences between TQM, Six
Sigma and lean”, The TQM Magazine, Vol. 18, No. 3, pp. 282-96.
•Antony, J. (2002), “Design for Six Sigma: a breakthrough business improvement strategy for achieving
competitive advantage”, Work Study, Vol. 51, No. 1, pp. 6-8.
•Antony, J. and Banuelas, R. (2002), “Key ingredients for the effective implementation of Six Sigma
program”, Measuring Business Excellence, Vol. 6, No. 4, pp. 20-7.
•Antony, J. and Fergusson, C. (2004), “Six Sigma in the software industry: results from a pilot study”,
Managerial Auditing Journal, Vol. 19, No. 8, pp. 1025-32.
•Antony, J. (2004), “Six Sigma in the UK service organizations: results from a pilot survey”, Managerial
Auditing Journal, Vol. 19, No. 8, pp. 1006-13.
•Antony, J. (2006), “Six Sigma for service processes”, Business Process Management Journal, Vol. 12,
No. 2, pp. 234-48.
REFERENCES
•Antony, J. (2007), “Six Sigma: a strategy for supporting innovation in pursuit of business excellence”,
International Journal of Technology Management, Vol. 37, No 1/2, pp. 8-12.
•Banuelas, R., Antony, J. and Brace, M. (2005), “An application of Six Sigma to reduce waste”, Quality
and Reliability Engineering International, Vol. 21, pp. 553-70.
•Bayle, P., Farrington, M., Sharp, B., Hild, C. and Sanders, D. (2001), “Illustration of Six Sigma
assistance on a design project”, Quality Engineering, Vol. 13, No. 3, pp. 341-8.
•Behara, R.S., Fontenot, G.F. and Gresham, A. (1995), “Customer satisfaction measurement and
analysis using Six Sigma”, International Journal of Quality & Reliability Management, Vol. 12, No. 3, pp.
9-18.
•Bhatnagar, J. and Pandey, A. (2005), “HR metrics: HR Six Sigma in Indian organizations”,
Management and Labor, Vol. 30, No. 4, pp. 327-56.
•Box, T. (2006), “Six Sigma quality: experiential learning”, S.A.M. Advanced Management Journal, Vol.
71, No. 1, pp. 20-3.
•Brewer, P. (2004), “Six Sigma helps a company create a culture of accountability”, Journal of
Organizational Excellence, Vol. 23, No. 3, pp. 45-59.
•Brett, C. and Queen, P. (2005), “Streamlining enterprise records management with lean Six Sigma”,
Information Management Journal, Vol. 39, No. 6, pp. 52-62.
•Buch, K. and Tolentino, A. (2006), “Employee perceptions of the rewards associated with Six Sigma”,
Journal of Organizational Change Management, Vol. 19, No. 3, pp. 356-64.
•Carnell, M. and Lambert, J. (2000), “Organisational excellence through Six Sigma discipline”,
Measuring Business Excellence, Vol. 4, No. 2, pp. 18-25.
•Chakrabarty, A. and Tan, K. (2007), “The current state of Six Sigma application in services”, Managing
Service Quality, Vol. 17, No. 2, pp. 194-208.
•Chang, K. and Wang, F. (2008), “Applying Six Sigma methodology to collaborative forecasting”,
International Journal of Advanced Manufacturing
Technology, Vol. 39, No. 9/10, pp. 1033-44.
•Das, N., Gauri, S. and Das, P. (2006), “Six Sigma principles in marketing: an application”,
International Journal of Six Sigma and Competitive Advantage, Vol. 2, No. 3, pp. 243-62.
•Davison, L. and Al-Shaghana, K. (2007), “The link between six sigma and quality culture: an empirical
study”, Total Quality Management and Business Excellence, Vol. 18, No. 3, pp. 249-65.
•De Feo, J. (2000), “Six Sigma: new opportunities for HR, new career growth for employees”,
Employment Relations Today, Vol. 27, No. 2, pp. 1-6.
•Does, R., Van Den Heuvel, J., De Mast, J. and Bisgaard, S. (2002), “Comparing non-manufacturing
with traditional applications of Six Sigma”, Quality Engineering, Vol. 15, No. 1, pp. 177-82.
•Fazzari, A. and Levitt, K. (2008), “Human resources as a strategic partner: sitting at the table with Six
Sigma”, Human Resource Development Quarterly, Vol. 19, No. 2, pp. 171-80.
•Feld, K. and Stone, W. (2002), “Using Six Sigma to change and measure improvement”, Performance
Improvement, Vol. 41, No. 9, pp. 20-6.
• Gijo, E. and Rao, T. (2005), “Six Sigma implementation – hurdles and more hurdles”, Total Quality
Management and Business Excellence, Vol. 16, No. 6, pp. 721-5.
•Goh, T.-N. and Xie, M. (2004), “Improving on the Six Sigma paradigm”, The TQM Magazine, Vol. 16,
No. 4, pp. 235-40.
•Goh, T.-N., Tang, L.-C., Lam, S.-W. and Gao, Y.-F. (2006), “Six Sigma: a SWOT analysis”,
International Journal of Six Sigma and Competitive Advantage, Vol. 2, No. 3, pp. 233-42.
•Hahn, G., Hill, W., Hoerl, R. and Zinkgraf, S. (1999), “The impact of Six Sigma improvement: a
glimpse into the future of statistics”, The American Statistician, Vol. 53, No. 3, pp. 208-15.
•Harry Mikel (1997), “The Vision of Six Sigma”, Tri Star Publishing, Phoenix, Arizona.
Henderson, K. and Evans, J. (2000), “Successful implementation of Six Sigma: benchmarking
General Electric Company”, Benchmarking: An International Journal, Vol. 7, No. 4, pp. 260-81.
•Henderson, K. and Evans, J. (2000), “Successful implementation of Six Sigma: benchmarking
General Electric Company”, Benchmarking: An International Journal, Vol. 7, No. 4, pp. 260-81.
•Hendricks, C. and Kelbaugh, R. (1998), “Implementing Six Sigma at GE”, Journal for Quality and
Participation, Vol. 21, No. 4, pp. 48-53.
•Hild, C., Sanders, D. and Cooper, T. (2000), “Six Sigma on continuous processes: how and why it
differs”, Quality Engineering, Vol. 13, No. 1, pp. 1-9.
•Hiroshi Katayama, David Bennett, (1996), "Lean production in a changing competitive world: a
Japanese perspective", International Journal of Operations & Production Management, Vol. 16, No. 2,
pp.8-23.
•Holtz, R. and Campbell, P. (2004), “Six Sigma: its implementation in Ford‟s facility management and
maintenance functions”, Journal of Facilities Management, Vol. 2 No. 4, pp. 320-9.
Hong, G. and Goh, T. (2003), “Six Sigma in software quality”, The TQM Magazine, Vol. 15, No. 6, pp.
364-73.
•Ingle, S. and Roe, W. (2001), “Six Sigma black belt implementation”, The TQM Magazine, Vol. 13,
No. 4, pp. 273-80.
Johnson, A. (2002), “Six Sigma in R&D”, Research Technology Management, Vol. 45, No. 2, pp. 12-
16.
•Jones, B. and Johnson, R.T. (2009), “Design and analysis for the Gaussian Process Model”, Quality
& Reliability Engineering International, Vol. 25, pp. 515-24.
Klefsjo¨, B., Wiklund, H. and Edgeman, R. (2001), “Six Sigma seen as a methodology for total
quality management”, Measuring Business Excellence, Vol. 5, No. 1, pp. 31-5.
•Kuei, C.-H. and Madu, C. (2003), “Customer-centric Six Sigma quality and reliability management”,
International Journal of Quality & Reliability Management, Vol. 20, No. 8, pp. 954-64.
•Kuthe, A.M. and Tharakan, B.D. (2009), “Application of ANN in Six Sigma DMADV and its
comparison with regression analysis in view of a case study in a leading steel industry”, International
Journal of Six Sigma and Competitive Advantage, Vol. 5, No.1, pp. 59-74.
•Kwak, Y.H. and Anbari, F.T. (2006), “Benefits, obstacles and future of Six Sigma approach”,
Technovation, Vol. 26, pp. 708-15.
•McCarty, T. and Fisher, S. (2007), “Six Sigma: it is not what you think”, Journal of Corporate Real
Estate, Vol. 9, No. 3, pp. 187-96.
•Maleyeff, J. and Kaminsky, F. (2002), “Six Sigma and introductory statistics education”, Education þ
Training, Vol. 44, No. 2, pp. 82-9.
•Markarian, J. (2004), “Six Sigma: quality processing through statistical analysis”, Plastics,
Additives and Compounding, Vol. 6, No. 4, pp. 28-31.
•Marti, F. (2005), “Lean Six Sigma method in phase 1 clinical trials: a practical example”, Quality
Assurance Journal, Vol. 9, No. 1, pp. 35-9.
•Pepper, M.P.J. and Spedding, T.A. (2010) “The evolution of lean Six Sigma”, International Journal
of Quality & Reliability Management, Vol. 27, No. 2, pp. 138-155.
•Prasada G.P. and Reddy, V.V. (2010), “Process improvement using Six Sigma – a case study in
small scale industry”, International Journal of Six Sigma and Competitive Advantage, Vol. 6,
No.1/2, pp. 1-11.
•Rao, K. and Rao, K. (2007), “Higher management education: should Six Sigma be added to the
curriculum?”, International Journal of Six Sigma and Competitive Advantage, Vol. 3, No. 2, pp.
156-70.
•Savolainen, T. and Haikonen, A. (2007), “Dynamics of organizational learning and continuous
improvement in Six Sigma implementation”, The TQM Magazine, Vol. 19, No. 1, pp. 6-17.
•Sehwail, L. and De Yong, C. (2003), “Six Sigma in health care”, Leadership in Health Services,
Vol. 16, No. 4, pp. 1-5.
•Snee, R.D. (2009), “Get moo-ving”, Six Sigma Forum Magazine, May, pp. 30-1.
•Vote, D. and Huston, J. (2005), “Six Sigma approach to improve surgical site infections: a key
variable”, American Journal of Infection Control, Vol. 33, No. 5, pp. 167-8.
•Wright, J. and Basu, R. (2008), “Project management and Six Sigma: obtaining a fit”, International
Journal of Six Sigma and Competitive Advantage, Vol. 4, No. 1, pp. 81-94.
PUBLICATIONS OUT OF WORK
(A) Papers ‘Published’ in International Journals
1. Singh, B.J. and Khanduja, D. (2010), DMAICT: A Roadmap to Quick Changeovers, International Journal of Six Sigma
and Competitive Advantage, Vol.6, No.1/2, pp.31-52.
2. Singh, B.J. and Khanduja, D. (2010), SME Sector of Punjab (India): From Renaissance to Recession, International
Journal of Indian Culture and Business Management, Vol. 3, No. 5, pp. 544-559.
3. Singh, B.J. and Khanduja, D. (2010), SMED: For Quick Changeovers in Foundry SMEs, International Journal of
Productivity and Performance Management, Vol. 59, No. 1, pp.98-116.
4. Singh, B.J. and Khanduja, D. (2010), Synergy of Cross Functional Process Mapping and SMED for Quick Changeovers: A
Case Study, International Journal of Science Technology & Management, Vol-2, No. 2, pp.107-116.
5. Singh, B.J. and Khanduja, D. (2011), Enigma of Six Sigma for Foundry SMEs in India: A Case Study, International
Journal of Engineering Management and Economics, Vol. 2, No. 1, pp. 81-105.
6. Singh, B.J., Khanduja, D. and Singh, A. (2011), Demystifying MSA: A Structured Approach for Indian Foundry SMEs,
International Journal of Quality and Innovation, Vol. 1, No. 3, pp. 217-236.
7. Singh, B.J. and Khanduja, D. (2011), Does Analysis Matter in Six Sigma?: A Case Study, International Journal of Data
Analysis Techniques and Strategies, Vol. 3, No. 3, pp. 300-324.
8. Singh, B.J. and Khanduja, D. (2011), Introduce Quality Processes through DOE: A Case Study in Die Casting Foundry,
International Journal of Productivity and Quality Management, Vol. 8, No. 4, pp. 373-397.
9. Singh, B.J. and Khanduja, D. (2011), Design for Set-ups: A Step towards Quick Changeovers in Foundries,
International Journal of Sustainable Designs, Vol. 1, No. 4, pp. 402-422.
10. Singh, B.J. and Khanduja, D. (2012), Essentials of D-phase to Secure the Competitive Advantage through
Six Sigma, International Journal of Business Excellence, Vol. 5, No. 1/2, pp. 31-51.
11. Singh, B.J. and Khanduja, D. (2012), Ambience of Six Sigma in Indian Foundry SMEs-An Empirical
Investigation, International Journal of Six Sigma and Competitive Advantage, Vol. 7, No. 1, pp. 12-40.
12. Singh, B.J. and Khanduja, D. (2012), Risk Management in Complex Changeovers through CFMEA: An
Empirical Investigation, International Journal of Industrial and System Engineering, Vol. 10, No. 4, pp. 470-
494.
13. Singh, B.J. and Khanduja, D. (2012), Scope of Six Sigma in Indian Foundry Operations, International
Journal of Services and Operation Management, Vol. 13, No.1, pp.65-97.
14. Singh, B.J. and Bakshi, Y. (2012), Six Sigma for Sustainable Energy Management: A Case Study,
International Journal of Science Technology & Management, Vol. 2, No. 2, pp. 60-72.
15. Singh, B.J. and Khanduja, D. (2012), Developing Operation Measurement Strategy during Six Sigma
Implementation: A Foundry Case Study, International Journal of Advanced Operation Management, Vol.4,
No. 4, pp. 323-349.
16.Singh, B.J. and Khanduja, D. (2014), “Perspectives of Control Phase to manage Six Sigma implements: A
Foundry Case”, International Journal of Business Excellence (IJBEX), Vol.7, No.1, pp. 88-111.
(B) Papers ‘Presented’ in International Conferences
1.Singh, B.J. and Khanduja, D. (2010), DMAIC(S): Incubates Core Competencies in Indian Foundry SMEs: An
Empirical Study in State of Punjab, 2nd International Conference on Production and Industrial Engineering
(CPIE-2010), NIT, Jalandhar, India, pp. 1443-53.
2.Singh, B.J. and Khanduja, D. (2011), Enhancing Competitiveness of Foundry SMEs through Design for
Changeover (DFC): A Case Study, International Conference on Emerging Trends in Mechanical Engineering
(ICETME-2011), Thapar University, Patiala, India, pp. 507-515.
3.Singh, B.J., Khanduja, D. and Jaglan, P. (2012), “Six Sigma for Sustainable Energy Management in
Foundries: A Case Study”, SOM-2012 Conference, IIT, Delhi (Held in Dec 2012).
4.Bakshi, Y., Singh, B.J., Singh, S.S. and Singla, R. (2012), “Performance Optimization of Backup Power
Systems through Six Sigma: A Case Study”, IETET-2012, GITA Institutes, Kurukshetra (Held in Nov 2012)
5.Sodhi, H.S., Singh, B.J. and Khanduja, D. (2012), “Behavior Study of Cutting Parameters on Material
Removal Rate for a Non-Ferrous Material While Turning on a CNC Turning Center”, IETET-2012, Kurukshetra
(Held in Nov 2012).
6.Singh, B.J. and Khanduja, D. (2013), “Leveraging Six Sigma Disciplines to Reduce Scrap in Indian Foundry
SMEs”, 26th SEAANZ Conference, Sydney (NSW), Australia, pp. 6-24. (Held in July-2013)
(C) Papers ‘Presented’ in National Conferences
1. Singh, B.J. and Khanduja, D. (2009), Set-Up Time Reduction for Higher Productivity in
Indian Foundries, Indian Institute of Foundry Men (IIF) organized by Chandigarh Chapter at
Ludhiana, pp. 51-57.
2. Singh, B.J. and Khanduja, D. (2010), Exploring Set-up Management in Indian Foundries,
Advances in Mechanical Engineering (AME-2010), Organized by B.B.S.B.C.E. Fatehgarh
Sahib, Punjab, pp. 70-76.
3. Singh, B.J., Bakshi, Y. and Kaushik, P. (2011), Role of Six Sigma in Engineering Institutes: A
Case Study, 41st ISTE Convention, India, pp. 7-20.
4. Sachin, Singh, B.J. and Dhull, V. (2013), “Six Sigma: From Concept to Implementation”,
AMMM-2013 National Conference, Haryana.
THANKS

More Related Content

What's hot

Lean six sigma - Waste elimination (Yellow Belt)
Lean six sigma - Waste elimination (Yellow Belt)Lean six sigma - Waste elimination (Yellow Belt)
Lean six sigma - Waste elimination (Yellow Belt)Abhay Yadav
 
six sigma DMAIC approach for reducing quality defects of camshaft binding pro...
six sigma DMAIC approach for reducing quality defects of camshaft binding pro...six sigma DMAIC approach for reducing quality defects of camshaft binding pro...
six sigma DMAIC approach for reducing quality defects of camshaft binding pro...Niranjana B
 
SIX SIGMA Green Belt Training
SIX SIGMA Green Belt TrainingSIX SIGMA Green Belt Training
SIX SIGMA Green Belt Trainingchaudhryshailja
 
Lean presentation ppt
Lean presentation pptLean presentation ppt
Lean presentation pptbwu.nl
 
Value Stream Mapping Process
Value Stream Mapping ProcessValue Stream Mapping Process
Value Stream Mapping ProcessAnand Subramaniam
 
Lean six sigma executive overview (case study) templates
Lean six sigma executive overview (case study) templatesLean six sigma executive overview (case study) templates
Lean six sigma executive overview (case study) templatesSteven Bonacorsi
 
Basic 8D Problem Solving Tools & Methods - Part 2
Basic 8D Problem Solving Tools & Methods - Part 2Basic 8D Problem Solving Tools & Methods - Part 2
Basic 8D Problem Solving Tools & Methods - Part 2Tony Alvarez
 
History of Lean manufacturing & TPS 14 Principal
History of Lean manufacturing & TPS 14 PrincipalHistory of Lean manufacturing & TPS 14 Principal
History of Lean manufacturing & TPS 14 PrincipalSumon Kumar Kundu
 
Value Stream Mapping
Value Stream MappingValue Stream Mapping
Value Stream MappingTKMG, Inc.
 
Six Sigma and Its Implementation
Six Sigma and Its ImplementationSix Sigma and Its Implementation
Six Sigma and Its ImplementationAnsar Lawi
 
Transactional quality process
Transactional quality processTransactional quality process
Transactional quality processSiddhartha Harit
 

What's hot (20)

8 Wastes
8 Wastes8 Wastes
8 Wastes
 
Lean six sigma - Waste elimination (Yellow Belt)
Lean six sigma - Waste elimination (Yellow Belt)Lean six sigma - Waste elimination (Yellow Belt)
Lean six sigma - Waste elimination (Yellow Belt)
 
Lean 6sigma and DMAIC
Lean 6sigma and DMAICLean 6sigma and DMAIC
Lean 6sigma and DMAIC
 
QC story- Battery mounting
QC story- Battery mountingQC story- Battery mounting
QC story- Battery mounting
 
six sigma DMAIC approach for reducing quality defects of camshaft binding pro...
six sigma DMAIC approach for reducing quality defects of camshaft binding pro...six sigma DMAIC approach for reducing quality defects of camshaft binding pro...
six sigma DMAIC approach for reducing quality defects of camshaft binding pro...
 
Lean And Six Sigma
Lean And Six SigmaLean And Six Sigma
Lean And Six Sigma
 
Kaizen
KaizenKaizen
Kaizen
 
Learning Six Sigma
Learning Six SigmaLearning Six Sigma
Learning Six Sigma
 
SIX SIGMA Green Belt Training
SIX SIGMA Green Belt TrainingSIX SIGMA Green Belt Training
SIX SIGMA Green Belt Training
 
Lean presentation ppt
Lean presentation pptLean presentation ppt
Lean presentation ppt
 
Six Sigma DMAIC Case Study
Six Sigma DMAIC Case StudySix Sigma DMAIC Case Study
Six Sigma DMAIC Case Study
 
Value Stream Mapping Process
Value Stream Mapping ProcessValue Stream Mapping Process
Value Stream Mapping Process
 
Lean six sigma executive overview (case study) templates
Lean six sigma executive overview (case study) templatesLean six sigma executive overview (case study) templates
Lean six sigma executive overview (case study) templates
 
Basic 8D Problem Solving Tools & Methods - Part 2
Basic 8D Problem Solving Tools & Methods - Part 2Basic 8D Problem Solving Tools & Methods - Part 2
Basic 8D Problem Solving Tools & Methods - Part 2
 
History of Lean manufacturing & TPS 14 Principal
History of Lean manufacturing & TPS 14 PrincipalHistory of Lean manufacturing & TPS 14 Principal
History of Lean manufacturing & TPS 14 Principal
 
Value Stream Mapping
Value Stream MappingValue Stream Mapping
Value Stream Mapping
 
8 Disciplines (8D) Training
8 Disciplines (8D) Training8 Disciplines (8D) Training
8 Disciplines (8D) Training
 
Six Sigma and Its Implementation
Six Sigma and Its ImplementationSix Sigma and Its Implementation
Six Sigma and Its Implementation
 
5 Steps to implementing Lean
5  Steps to implementing Lean5  Steps to implementing Lean
5 Steps to implementing Lean
 
Transactional quality process
Transactional quality processTransactional quality process
Transactional quality process
 

Similar to Six sigma case study (bjs)

Elimination of rework in V Cap by Using Six Sigma Methodology
Elimination of rework in V Cap by Using Six Sigma MethodologyElimination of rework in V Cap by Using Six Sigma Methodology
Elimination of rework in V Cap by Using Six Sigma MethodologyIJERD Editor
 
A Review: Six Sigma Implementation Practice in Manufacturing Industries
A Review: Six Sigma Implementation Practice in Manufacturing IndustriesA Review: Six Sigma Implementation Practice in Manufacturing Industries
A Review: Six Sigma Implementation Practice in Manufacturing IndustriesIJERA Editor
 
The IUP Journal of Business Strategy, Vol. XIV, No. 2, 201740.docx
The IUP Journal of Business Strategy, Vol. XIV, No. 2, 201740.docxThe IUP Journal of Business Strategy, Vol. XIV, No. 2, 201740.docx
The IUP Journal of Business Strategy, Vol. XIV, No. 2, 201740.docxoreo10
 
Adoption Of Six Sigma DMAIC To Reduce Cost Of Poor Quality
Adoption Of Six Sigma DMAIC To Reduce Cost Of Poor QualityAdoption Of Six Sigma DMAIC To Reduce Cost Of Poor Quality
Adoption Of Six Sigma DMAIC To Reduce Cost Of Poor QualitySabrina Baloi
 
Material Management
Material ManagementMaterial Management
Material ManagementRohit14 Nair
 
6 sigma assignment
6 sigma assignment6 sigma assignment
6 sigma assignmentstudent
 
F444652
F444652F444652
F444652aijbm
 
A4 montgomery-woodall-six-sigma
A4 montgomery-woodall-six-sigmaA4 montgomery-woodall-six-sigma
A4 montgomery-woodall-six-sigmaZUbaria Inayat
 
A LEAN SIX-SIGMA MANUFACTURING PROCESS CASE STUDY
A LEAN SIX-SIGMA MANUFACTURING PROCESS CASE STUDYA LEAN SIX-SIGMA MANUFACTURING PROCESS CASE STUDY
A LEAN SIX-SIGMA MANUFACTURING PROCESS CASE STUDYLinda Garcia
 
Effect of Lean Manufacturing on Operational Performance: An Empirical Study o...
Effect of Lean Manufacturing on Operational Performance: An Empirical Study o...Effect of Lean Manufacturing on Operational Performance: An Empirical Study o...
Effect of Lean Manufacturing on Operational Performance: An Empirical Study o...IRJET Journal
 
The advancement & effect of six sigma approach in a modern
The advancement & effect of six sigma approach in a modernThe advancement & effect of six sigma approach in a modern
The advancement & effect of six sigma approach in a modernIAEME Publication
 
Journey from Six Sigma to Lean Six Sigma: A Literature Review
Journey from Six Sigma to Lean Six Sigma: A Literature ReviewJourney from Six Sigma to Lean Six Sigma: A Literature Review
Journey from Six Sigma to Lean Six Sigma: A Literature ReviewIJMER
 
Six Sigma and its Methodology
Six Sigma and its Methodology Six Sigma and its Methodology
Six Sigma and its Methodology Ravi Vaishnav
 
International Journal of Engineering Research and Development (IJERD)
International Journal of Engineering Research and Development (IJERD)International Journal of Engineering Research and Development (IJERD)
International Journal of Engineering Research and Development (IJERD)IJERD Editor
 

Similar to Six sigma case study (bjs) (20)

Elimination of rework in V Cap by Using Six Sigma Methodology
Elimination of rework in V Cap by Using Six Sigma MethodologyElimination of rework in V Cap by Using Six Sigma Methodology
Elimination of rework in V Cap by Using Six Sigma Methodology
 
A Review: Six Sigma Implementation Practice in Manufacturing Industries
A Review: Six Sigma Implementation Practice in Manufacturing IndustriesA Review: Six Sigma Implementation Practice in Manufacturing Industries
A Review: Six Sigma Implementation Practice in Manufacturing Industries
 
The IUP Journal of Business Strategy, Vol. XIV, No. 2, 201740.docx
The IUP Journal of Business Strategy, Vol. XIV, No. 2, 201740.docxThe IUP Journal of Business Strategy, Vol. XIV, No. 2, 201740.docx
The IUP Journal of Business Strategy, Vol. XIV, No. 2, 201740.docx
 
Adoption Of Six Sigma DMAIC To Reduce Cost Of Poor Quality
Adoption Of Six Sigma DMAIC To Reduce Cost Of Poor QualityAdoption Of Six Sigma DMAIC To Reduce Cost Of Poor Quality
Adoption Of Six Sigma DMAIC To Reduce Cost Of Poor Quality
 
Material Management
Material ManagementMaterial Management
Material Management
 
6 sigma assignment
6 sigma assignment6 sigma assignment
6 sigma assignment
 
F444652
F444652F444652
F444652
 
Ijebea14 275
Ijebea14 275Ijebea14 275
Ijebea14 275
 
A4 montgomery-woodall-six-sigma
A4 montgomery-woodall-six-sigmaA4 montgomery-woodall-six-sigma
A4 montgomery-woodall-six-sigma
 
Six sigma - pimg
Six sigma - pimgSix sigma - pimg
Six sigma - pimg
 
A LEAN SIX-SIGMA MANUFACTURING PROCESS CASE STUDY
A LEAN SIX-SIGMA MANUFACTURING PROCESS CASE STUDYA LEAN SIX-SIGMA MANUFACTURING PROCESS CASE STUDY
A LEAN SIX-SIGMA MANUFACTURING PROCESS CASE STUDY
 
6-sigma.ppt
6-sigma.ppt6-sigma.ppt
6-sigma.ppt
 
6-sigma.ppt
6-sigma.ppt6-sigma.ppt
6-sigma.ppt
 
Six Sigma Cases
Six Sigma CasesSix Sigma Cases
Six Sigma Cases
 
Effect of Lean Manufacturing on Operational Performance: An Empirical Study o...
Effect of Lean Manufacturing on Operational Performance: An Empirical Study o...Effect of Lean Manufacturing on Operational Performance: An Empirical Study o...
Effect of Lean Manufacturing on Operational Performance: An Empirical Study o...
 
The advancement & effect of six sigma approach in a modern
The advancement & effect of six sigma approach in a modernThe advancement & effect of six sigma approach in a modern
The advancement & effect of six sigma approach in a modern
 
Journey from Six Sigma to Lean Six Sigma: A Literature Review
Journey from Six Sigma to Lean Six Sigma: A Literature ReviewJourney from Six Sigma to Lean Six Sigma: A Literature Review
Journey from Six Sigma to Lean Six Sigma: A Literature Review
 
Six Sigma and its Methodology
Six Sigma and its Methodology Six Sigma and its Methodology
Six Sigma and its Methodology
 
150110746014
150110746014150110746014
150110746014
 
International Journal of Engineering Research and Development (IJERD)
International Journal of Engineering Research and Development (IJERD)International Journal of Engineering Research and Development (IJERD)
International Journal of Engineering Research and Development (IJERD)
 

More from Dr. Bikram Jit Singh

Scrap reduction in piston die casting foundry
Scrap reduction in piston die casting foundryScrap reduction in piston die casting foundry
Scrap reduction in piston die casting foundryDr. Bikram Jit Singh
 
0000. the blockchain-revolution-an-analysis-of-regulation-and-technolo
0000. the blockchain-revolution-an-analysis-of-regulation-and-technolo0000. the blockchain-revolution-an-analysis-of-regulation-and-technolo
0000. the blockchain-revolution-an-analysis-of-regulation-and-technoloDr. Bikram Jit Singh
 
Enigma of 'six sigma' for foundry sm es in india
Enigma of 'six sigma' for foundry sm es in indiaEnigma of 'six sigma' for foundry sm es in india
Enigma of 'six sigma' for foundry sm es in indiaDr. Bikram Jit Singh
 
Scope of six sigma in indian foundry operations
Scope of six sigma in indian foundry operationsScope of six sigma in indian foundry operations
Scope of six sigma in indian foundry operationsDr. Bikram Jit Singh
 
Risk management in complex changeovers through cfmea
Risk management in complex changeovers through cfmeaRisk management in complex changeovers through cfmea
Risk management in complex changeovers through cfmeaDr. Bikram Jit Singh
 
Ambience of six sigma in indian foundries
Ambience of six sigma in indian foundriesAmbience of six sigma in indian foundries
Ambience of six sigma in indian foundriesDr. Bikram Jit Singh
 
Operational management of a centrifugal slurry pump
Operational management of a centrifugal slurry pumpOperational management of a centrifugal slurry pump
Operational management of a centrifugal slurry pumpDr. Bikram Jit Singh
 
Parametric optimisation of cnc turning for al 7020 with rsm
Parametric optimisation of cnc turning for al 7020 with rsmParametric optimisation of cnc turning for al 7020 with rsm
Parametric optimisation of cnc turning for al 7020 with rsmDr. Bikram Jit Singh
 
Optimizing the backup power systems through six sigma
Optimizing the backup power systems through six sigmaOptimizing the backup power systems through six sigma
Optimizing the backup power systems through six sigmaDr. Bikram Jit Singh
 

More from Dr. Bikram Jit Singh (20)

P22 & P91n Steels
P22 & P91n SteelsP22 & P91n Steels
P22 & P91n Steels
 
Swot
SwotSwot
Swot
 
Friction Stir Welding
Friction Stir WeldingFriction Stir Welding
Friction Stir Welding
 
Mixture DoE
Mixture DoE Mixture DoE
Mixture DoE
 
LSS in Textile Industry
LSS in Textile Industry LSS in Textile Industry
LSS in Textile Industry
 
Scrap reduction in piston die casting foundry
Scrap reduction in piston die casting foundryScrap reduction in piston die casting foundry
Scrap reduction in piston die casting foundry
 
Admissions in engineering
Admissions in engineeringAdmissions in engineering
Admissions in engineering
 
0000. the blockchain-revolution-an-analysis-of-regulation-and-technolo
0000. the blockchain-revolution-an-analysis-of-regulation-and-technolo0000. the blockchain-revolution-an-analysis-of-regulation-and-technolo
0000. the blockchain-revolution-an-analysis-of-regulation-and-technolo
 
Bjs green belt ppt
Bjs green belt pptBjs green belt ppt
Bjs green belt ppt
 
Msa presentation
Msa presentationMsa presentation
Msa presentation
 
Reliability
ReliabilityReliability
Reliability
 
FSW of AL alloys
FSW of AL alloysFSW of AL alloys
FSW of AL alloys
 
Measurement system analysis
Measurement system analysisMeasurement system analysis
Measurement system analysis
 
Enigma of 'six sigma' for foundry sm es in india
Enigma of 'six sigma' for foundry sm es in indiaEnigma of 'six sigma' for foundry sm es in india
Enigma of 'six sigma' for foundry sm es in india
 
Scope of six sigma in indian foundry operations
Scope of six sigma in indian foundry operationsScope of six sigma in indian foundry operations
Scope of six sigma in indian foundry operations
 
Risk management in complex changeovers through cfmea
Risk management in complex changeovers through cfmeaRisk management in complex changeovers through cfmea
Risk management in complex changeovers through cfmea
 
Ambience of six sigma in indian foundries
Ambience of six sigma in indian foundriesAmbience of six sigma in indian foundries
Ambience of six sigma in indian foundries
 
Operational management of a centrifugal slurry pump
Operational management of a centrifugal slurry pumpOperational management of a centrifugal slurry pump
Operational management of a centrifugal slurry pump
 
Parametric optimisation of cnc turning for al 7020 with rsm
Parametric optimisation of cnc turning for al 7020 with rsmParametric optimisation of cnc turning for al 7020 with rsm
Parametric optimisation of cnc turning for al 7020 with rsm
 
Optimizing the backup power systems through six sigma
Optimizing the backup power systems through six sigmaOptimizing the backup power systems through six sigma
Optimizing the backup power systems through six sigma
 

Recently uploaded

ZXCTN 5804 / ZTE PTN / ZTE POTN / ZTE 5804 PTN / ZTE POTN 5804 ( 100/200 GE Z...
ZXCTN 5804 / ZTE PTN / ZTE POTN / ZTE 5804 PTN / ZTE POTN 5804 ( 100/200 GE Z...ZXCTN 5804 / ZTE PTN / ZTE POTN / ZTE 5804 PTN / ZTE POTN 5804 ( 100/200 GE Z...
ZXCTN 5804 / ZTE PTN / ZTE POTN / ZTE 5804 PTN / ZTE POTN 5804 ( 100/200 GE Z...ZTE
 
High Profile Call Girls Nagpur Meera Call 7001035870 Meet With Nagpur Escorts
High Profile Call Girls Nagpur Meera Call 7001035870 Meet With Nagpur EscortsHigh Profile Call Girls Nagpur Meera Call 7001035870 Meet With Nagpur Escorts
High Profile Call Girls Nagpur Meera Call 7001035870 Meet With Nagpur EscortsCall Girls in Nagpur High Profile
 
Coefficient of Thermal Expansion and their Importance.pptx
Coefficient of Thermal Expansion and their Importance.pptxCoefficient of Thermal Expansion and their Importance.pptx
Coefficient of Thermal Expansion and their Importance.pptxAsutosh Ranjan
 
VIP Call Girls Service Kondapur Hyderabad Call +91-8250192130
VIP Call Girls Service Kondapur Hyderabad Call +91-8250192130VIP Call Girls Service Kondapur Hyderabad Call +91-8250192130
VIP Call Girls Service Kondapur Hyderabad Call +91-8250192130Suhani Kapoor
 
GDSC ASEB Gen AI study jams presentation
GDSC ASEB Gen AI study jams presentationGDSC ASEB Gen AI study jams presentation
GDSC ASEB Gen AI study jams presentationGDSCAESB
 
MANUFACTURING PROCESS-II UNIT-5 NC MACHINE TOOLS
MANUFACTURING PROCESS-II UNIT-5 NC MACHINE TOOLSMANUFACTURING PROCESS-II UNIT-5 NC MACHINE TOOLS
MANUFACTURING PROCESS-II UNIT-5 NC MACHINE TOOLSSIVASHANKAR N
 
Sheet Pile Wall Design and Construction: A Practical Guide for Civil Engineer...
Sheet Pile Wall Design and Construction: A Practical Guide for Civil Engineer...Sheet Pile Wall Design and Construction: A Practical Guide for Civil Engineer...
Sheet Pile Wall Design and Construction: A Practical Guide for Civil Engineer...Dr.Costas Sachpazis
 
Porous Ceramics seminar and technical writing
Porous Ceramics seminar and technical writingPorous Ceramics seminar and technical writing
Porous Ceramics seminar and technical writingrakeshbaidya232001
 
Introduction to Multiple Access Protocol.pptx
Introduction to Multiple Access Protocol.pptxIntroduction to Multiple Access Protocol.pptx
Introduction to Multiple Access Protocol.pptxupamatechverse
 
Processing & Properties of Floor and Wall Tiles.pptx
Processing & Properties of Floor and Wall Tiles.pptxProcessing & Properties of Floor and Wall Tiles.pptx
Processing & Properties of Floor and Wall Tiles.pptxpranjaldaimarysona
 
Analog to Digital and Digital to Analog Converter
Analog to Digital and Digital to Analog ConverterAnalog to Digital and Digital to Analog Converter
Analog to Digital and Digital to Analog ConverterAbhinavSharma374939
 
What are the advantages and disadvantages of membrane structures.pptx
What are the advantages and disadvantages of membrane structures.pptxWhat are the advantages and disadvantages of membrane structures.pptx
What are the advantages and disadvantages of membrane structures.pptxwendy cai
 
(ANVI) Koregaon Park Call Girls Just Call 7001035870 [ Cash on Delivery ] Pun...
(ANVI) Koregaon Park Call Girls Just Call 7001035870 [ Cash on Delivery ] Pun...(ANVI) Koregaon Park Call Girls Just Call 7001035870 [ Cash on Delivery ] Pun...
(ANVI) Koregaon Park Call Girls Just Call 7001035870 [ Cash on Delivery ] Pun...ranjana rawat
 
Architect Hassan Khalil Portfolio for 2024
Architect Hassan Khalil Portfolio for 2024Architect Hassan Khalil Portfolio for 2024
Architect Hassan Khalil Portfolio for 2024hassan khalil
 
OSVC_Meta-Data based Simulation Automation to overcome Verification Challenge...
OSVC_Meta-Data based Simulation Automation to overcome Verification Challenge...OSVC_Meta-Data based Simulation Automation to overcome Verification Challenge...
OSVC_Meta-Data based Simulation Automation to overcome Verification Challenge...Soham Mondal
 
IMPLICATIONS OF THE ABOVE HOLISTIC UNDERSTANDING OF HARMONY ON PROFESSIONAL E...
IMPLICATIONS OF THE ABOVE HOLISTIC UNDERSTANDING OF HARMONY ON PROFESSIONAL E...IMPLICATIONS OF THE ABOVE HOLISTIC UNDERSTANDING OF HARMONY ON PROFESSIONAL E...
IMPLICATIONS OF THE ABOVE HOLISTIC UNDERSTANDING OF HARMONY ON PROFESSIONAL E...RajaP95
 
Decoding Kotlin - Your guide to solving the mysterious in Kotlin.pptx
Decoding Kotlin - Your guide to solving the mysterious in Kotlin.pptxDecoding Kotlin - Your guide to solving the mysterious in Kotlin.pptx
Decoding Kotlin - Your guide to solving the mysterious in Kotlin.pptxJoão Esperancinha
 

Recently uploaded (20)

ZXCTN 5804 / ZTE PTN / ZTE POTN / ZTE 5804 PTN / ZTE POTN 5804 ( 100/200 GE Z...
ZXCTN 5804 / ZTE PTN / ZTE POTN / ZTE 5804 PTN / ZTE POTN 5804 ( 100/200 GE Z...ZXCTN 5804 / ZTE PTN / ZTE POTN / ZTE 5804 PTN / ZTE POTN 5804 ( 100/200 GE Z...
ZXCTN 5804 / ZTE PTN / ZTE POTN / ZTE 5804 PTN / ZTE POTN 5804 ( 100/200 GE Z...
 
High Profile Call Girls Nagpur Meera Call 7001035870 Meet With Nagpur Escorts
High Profile Call Girls Nagpur Meera Call 7001035870 Meet With Nagpur EscortsHigh Profile Call Girls Nagpur Meera Call 7001035870 Meet With Nagpur Escorts
High Profile Call Girls Nagpur Meera Call 7001035870 Meet With Nagpur Escorts
 
Coefficient of Thermal Expansion and their Importance.pptx
Coefficient of Thermal Expansion and their Importance.pptxCoefficient of Thermal Expansion and their Importance.pptx
Coefficient of Thermal Expansion and their Importance.pptx
 
VIP Call Girls Service Kondapur Hyderabad Call +91-8250192130
VIP Call Girls Service Kondapur Hyderabad Call +91-8250192130VIP Call Girls Service Kondapur Hyderabad Call +91-8250192130
VIP Call Girls Service Kondapur Hyderabad Call +91-8250192130
 
GDSC ASEB Gen AI study jams presentation
GDSC ASEB Gen AI study jams presentationGDSC ASEB Gen AI study jams presentation
GDSC ASEB Gen AI study jams presentation
 
MANUFACTURING PROCESS-II UNIT-5 NC MACHINE TOOLS
MANUFACTURING PROCESS-II UNIT-5 NC MACHINE TOOLSMANUFACTURING PROCESS-II UNIT-5 NC MACHINE TOOLS
MANUFACTURING PROCESS-II UNIT-5 NC MACHINE TOOLS
 
Sheet Pile Wall Design and Construction: A Practical Guide for Civil Engineer...
Sheet Pile Wall Design and Construction: A Practical Guide for Civil Engineer...Sheet Pile Wall Design and Construction: A Practical Guide for Civil Engineer...
Sheet Pile Wall Design and Construction: A Practical Guide for Civil Engineer...
 
Porous Ceramics seminar and technical writing
Porous Ceramics seminar and technical writingPorous Ceramics seminar and technical writing
Porous Ceramics seminar and technical writing
 
Introduction to Multiple Access Protocol.pptx
Introduction to Multiple Access Protocol.pptxIntroduction to Multiple Access Protocol.pptx
Introduction to Multiple Access Protocol.pptx
 
Processing & Properties of Floor and Wall Tiles.pptx
Processing & Properties of Floor and Wall Tiles.pptxProcessing & Properties of Floor and Wall Tiles.pptx
Processing & Properties of Floor and Wall Tiles.pptx
 
Analog to Digital and Digital to Analog Converter
Analog to Digital and Digital to Analog ConverterAnalog to Digital and Digital to Analog Converter
Analog to Digital and Digital to Analog Converter
 
★ CALL US 9953330565 ( HOT Young Call Girls In Badarpur delhi NCR
★ CALL US 9953330565 ( HOT Young Call Girls In Badarpur delhi NCR★ CALL US 9953330565 ( HOT Young Call Girls In Badarpur delhi NCR
★ CALL US 9953330565 ( HOT Young Call Girls In Badarpur delhi NCR
 
What are the advantages and disadvantages of membrane structures.pptx
What are the advantages and disadvantages of membrane structures.pptxWhat are the advantages and disadvantages of membrane structures.pptx
What are the advantages and disadvantages of membrane structures.pptx
 
(ANVI) Koregaon Park Call Girls Just Call 7001035870 [ Cash on Delivery ] Pun...
(ANVI) Koregaon Park Call Girls Just Call 7001035870 [ Cash on Delivery ] Pun...(ANVI) Koregaon Park Call Girls Just Call 7001035870 [ Cash on Delivery ] Pun...
(ANVI) Koregaon Park Call Girls Just Call 7001035870 [ Cash on Delivery ] Pun...
 
Architect Hassan Khalil Portfolio for 2024
Architect Hassan Khalil Portfolio for 2024Architect Hassan Khalil Portfolio for 2024
Architect Hassan Khalil Portfolio for 2024
 
Call Us -/9953056974- Call Girls In Vikaspuri-/- Delhi NCR
Call Us -/9953056974- Call Girls In Vikaspuri-/- Delhi NCRCall Us -/9953056974- Call Girls In Vikaspuri-/- Delhi NCR
Call Us -/9953056974- Call Girls In Vikaspuri-/- Delhi NCR
 
OSVC_Meta-Data based Simulation Automation to overcome Verification Challenge...
OSVC_Meta-Data based Simulation Automation to overcome Verification Challenge...OSVC_Meta-Data based Simulation Automation to overcome Verification Challenge...
OSVC_Meta-Data based Simulation Automation to overcome Verification Challenge...
 
DJARUM4D - SLOT GACOR ONLINE | SLOT DEMO ONLINE
DJARUM4D - SLOT GACOR ONLINE | SLOT DEMO ONLINEDJARUM4D - SLOT GACOR ONLINE | SLOT DEMO ONLINE
DJARUM4D - SLOT GACOR ONLINE | SLOT DEMO ONLINE
 
IMPLICATIONS OF THE ABOVE HOLISTIC UNDERSTANDING OF HARMONY ON PROFESSIONAL E...
IMPLICATIONS OF THE ABOVE HOLISTIC UNDERSTANDING OF HARMONY ON PROFESSIONAL E...IMPLICATIONS OF THE ABOVE HOLISTIC UNDERSTANDING OF HARMONY ON PROFESSIONAL E...
IMPLICATIONS OF THE ABOVE HOLISTIC UNDERSTANDING OF HARMONY ON PROFESSIONAL E...
 
Decoding Kotlin - Your guide to solving the mysterious in Kotlin.pptx
Decoding Kotlin - Your guide to solving the mysterious in Kotlin.pptxDecoding Kotlin - Your guide to solving the mysterious in Kotlin.pptx
Decoding Kotlin - Your guide to solving the mysterious in Kotlin.pptx
 

Six sigma case study (bjs)

  • 1.
  • 2. SOME SIX SIGMA IMPERATIVES FOR INDIAN FOUNDRIES: A CASE STUDY By Bikram Jit Singh Professor MMDU Mullana
  • 3. Main Focus 1. Introduction 2. Research Plan 3. Literature Survey 4. Research Gap 5. Problem Formulation 6. Objectives of Study 7. Research Work Findings 8. Case Study Based on DMAIC 9. Result Appraisal 10. Economic Analysis 11. Conclusions 12. Scope in Future 13. References 14. Publications From Work
  • 4. FOUNDRIES OVER THE WORLD • 35000 foundries in the world with annual production of 90 MMT • Provide employment to about 20 million people. • Indian foundry industry is the fourth largest in the world. • There are more than 7,000 foundries in India INTRODUCTION
  • 5.
  • 6. FOUNDRIES IN INDIA • 80% of foundries are in SME sector. • Sector employs 0.5 million people directly and 1.5 million indirectly. • Rs 7000 per ton produced to National exchequer by way of Excise and other levies.
  • 7.
  • 10. Performance Norms Indian Foundries Overseas Foundries Production per annum (%) 8 to 9 92 to 93 Rejection (%) 10 to 25 2 to 12 Capacity Utilization (%) 45 to55 60 to 75 Productivity (T/Man/Year) 12 to 20 100 to 120 (Japan) 50 to 55 (Germany) 10 to 30 (China) Energy Requirement (KWH/T) 700 to 900 400 to 600 Comparison of Indian and Overseas Foundries
  • 11. • For global competitiveness, Indian industries need overall operational and service excellence and are extensively engaged in Quality Circles, TQM and ISO Certification (Panchal, 2010). However, these methods have failed to deliver required performance over the last decade or so (Sadagopan et al., 2005). • It has been seen that Six Sigma is not fully explored by Indian industries (Antony and Banuelas, 2002). With the reduction of geographical barriers and the pressure of competing in the global market, overall operational and service excellence has become a necessity for these industries to remain globally competitive (Rao and Rao, 2007). Quality Programmes Undertaken
  • 12. • Satisfaction with other quality and productivity improvement initiatives turned out to be the strongest reason for not embarking on Six Sigma program, followed by lack of awareness and unsuitability of the initiative to their type of business (Montgomery, 2009). • Approximately 30 per cent of them have applied Six Sigma in their business operations and the remaining 70 per cent are yet to experience the Six Sigma initiative for a number of reasons (Sehwail and Yong, 2003).
  • 13. SO… To check low productivity levels and for global competitiveness, this industry must strive hard to achieve overall operational excellence in business by looking for flexibility, shorter lead time and defects reduction; because only such a configuration of production system can fulfill the customer expectations. In this context Six Sigma can be a powerful business improvement strategy, that enables industry to use simple but powerful statistical methods for achieving operational excellence.
  • 14. SIX SIGMA ?? A break through strategy to significantly improve customer satisfaction and shareholder value by reducing variability in every aspect of our business Improve Performance & Service • reduce defects • stabilize processes • customer satisfaction Reduce Costs • improve efficiency • eliminate waste (3.4 ppm) • reduce cost of poor quality
  • 15. SIX SIGMAS PARADIGMS SN Years/Author Company / Unit Parameters Achievements; Financial Savings LARGE SCALE UNITS 1. 1986-2001 Motorola In-process defect level 200-times reduction; $15billions 2. 1996-1999 General Electric Turnaround time at repair shops 62% reduction; $2billions 3. 1998-2000 Honeywell Concept to shipment cycle time Reduced from 18 months to 8 months; $1.2 billions 4. 2000-2002 Ford recalls and production delays Reduced defects by 70%; $1billions 5. 2000-2002 Caterpiller Quality improvement, Reduced cost structure Reduced defects by 75%; Not Reported 6. 1999-2002 Our lady of Lourdes Medical Centre Hospital bed availability delays Bed availability reduced from 267 to 235 minutes (12% reduction); $66000
  • 16. MEDIUM SCALE UNITS 1. Ingle and Roe (2001) Medium sized welding unit Optimization of welding process parameters Joint strength is increased by 26% and scrap work is reduced by 3% 2. Zu et al. (2008) A bulb manufacturing SME Improve the process and reduced the shell cracking of bulbs Sigma level increased from 3.1 to 4.5 3. Sharma (2003) Baxer Battery Limited Life of battery increased by 15% by proper utilizing of resources. Customer satisfaction and 12% annual increased in sale. 4. Holtz and Campbell (2004) Ford Motors Maintenance management by improving MTBF. Savings of $ 60000 achieved in six months. Sigma level improved from 1.4 to 2.1 5. Wang et al., et al. (2006) A medium scale IC engine manufacturing unit Improve the Cpk Process capability improved from 1.1 to 2.9
  • 17. SMALL SCALE UNITS 1. Johnson (2002) Orange box Limited Office seat and furniture design £60000 saving 2. Basu (2004) A washing machine manufacturing unit Failure of drum bearings reduction in customer complaints and customer satisfaction achieved 3. Marti (2005) A Steel valves and fittings manufacturing unit Production planning improvement 50% improvement in delivery failures and a level of 2 sigma achieved 4. Desai (2006) Two wheeler automobile company Gear pinion noise Noise reduced by 13%, Sigma level increased from 3.134 to 3.944 5. Gadallah (2009) “P S Soot Girani Ltd” Maharashtra -a cotton mill Manufacturing system performance Sigma level improved result in production of premium quality yarn
  • 18. MICRO SCALE UNITS 1. Byrne (2003) Carriage and Wagon Works Axle rejection 59% reduction in axle rejections 2. Wang et al. (2004) Tata Honeywell Limited Travel costs per kilometer per month Decreased travel cost 3. Flott (2000) General Electric company Keys for successful implementation of quality tools Finding Keys factors for successful implementation 4. Antony et al. (2007) A Bulb manufacturing unit Shell cracking of bulb Sigma level increased from 3.2 to 4.5 5. Garg (2010) Indian automobile sector Effective implementation of quality tools in Indian automobile sector Finding Success factors
  • 19. RESEARCH PLAN OBJECTIVES OF THE STUDY LITERATURE SURVEY RESEARCH GAPS PROBLEM FORMULATIONS RESEARCH PLAN IMPLEMENTATION OF SIX SIGMA’S DMAIC METHODOLOGY EXECUTION OF EACH PHASE AS PER PROPOSED FRAMEWORK RESULT APPRAISAL CONCLUSIONS AND SCOPE FOR FUTURE WORK RESEARCH FINDINGS: A CASE STUDY
  • 20. LITERATURE SURVEY The following issues were predominantly addressed during an extensive literature review on various aspects of Six Sigma and its application to foundry industry. These issues primarily covered in various journals, reference manuals, handbooks, text books, e-resources etc are: a) Six Sigma: Concept and Evolution b) Six Sigma in Manufacturing Sector
  • 21. (a) SIX SIGMA-CONCEPT AND EVOLUTION A chronological review of the concept of Six Sigma is given in table Six Sigma- The Concept SN Author(s) Six Sigma as a Concept 1. Behara et al. (1995) Six Sigma is a rating that signifies “best in class”, with only 3.4 defects per million units or operations. A defect can be anything froma faulty part to an incorrect customer bill. 2. Katayama and Bennett (1996) Six Sigma is a rigorous data gathering and statistical analysis technique which can be used to pinpoint sources of errors and suggests ways of eliminating them. 3. Mikel (1997) Six Sigma is a systematic, highly disciplined, customer-centric and profit-driven organization-wide strategic business improvement initiative. 4. Hendricks and Kelbaugh (1998) A quality improvement program with a goal of reducing the number of defects to as low as 3.4 parts per million opportunities or 0.0003 per cent. 5. Hahn et al. (1999) Six Sigma is a quality improvement initiative and quality management framework which is disciplined for quality improvement through defect reduction. 6. Sanders and Hild (2000) Six Sigma methodologies link the tools and techniques in a sequential manner. Finally, Six Sigma creates a powerful infrastructure for training of Champions, Master Blac k Belts etc. 7. Ingle and Roe (2001) A philosophy that employs a well-structured continuous improvement methodology to reduce process variability and drive out waste frombusiness using various techniques.
  • 22. 8. Antony (2002) A business performance improvement strategy that aims to reduce the number of defects – to as low as 3.4 occasions per million opportunities 9. Hong and Goh (2003) Six Sigma is a customer focus, data-driven, and robust methodology, which is well rooted in mathematics and statistics. It is based upon the phenomenon of defect reduction 10. Markarian (2004) Six Sigma is a business improvement strategy that seeks to find and eliminate causes of defects in business process by focusing on outputs that are critical for customers. 11. Marti (2005) Sigma is basically Greek term for variation. Six Sigma is extremely structured program whose prime objective is to improve business process by minimizing the variation. 12. Kwak and Anbari (2006) A business strategy used to improve business profitability, to improve the effectiveness and efficiency of all operations to meet or exceed customer needs and expectations 13. McCarty and Fisher (2007) Six Sigma becomes ingrained in the cultural context of the organization and represents a management and cultural philosophy of process orientation and continuous improvement. 14. Hamza (2008) Six Sigma is a process improvement methodology that aims to increase business performance through accurate focus. It is a symmetric approach to achieve improvement. 15. Snee (2009) A strategic, company-wide, approach focusing on variation reduction, projects have the potential of simultaneously reducing cost and increasing customer satisfaction 16. Pepper and Spedding (2010) Six Sigma is an approach to the improvement of the quality of products or services which strive for near perfection. I.e. not more then 3.4 DPMO.
  • 23. Table depicts certain themes whose synergy with Six Sigma has created considerable interest among the researchers during the last 15 years. Themes Related to Six Sigma SN Themes References 1. Quality Approaches Hoerl (1998); Hild et al. (2000); Klefsjo et al. (2001); Sadagopan et al. (2005); Jones and Johnson (2009); Parsad and Reddy (2010) 2. Six Sigma Education Echempati and White (2000); Maleyeff and Kaminsky (2002); Sehwail and De Yong (2003); Rao and Rao (2007); Gijo and Scaria (2010) 3. DAMIC/DFSS Methodology Bayle et al. (2001); Kuei and Madu (2003); Antony (2006); Bandyopadhyay and Jenicke (2007); Montgomery (2009) 4. Tools and Techniques Hendricks and Kelbaugh (1998); Graves (2002); Banuelas and Antony (2003); Banuelas et al. (2005); Antony (2007); Harjac et al. (2008) 5. Belt System Henderson and Evans (2000); Ingle and Roe (2001); Andersson et al. (2006); Savolainen and Haikonen (2007); Schroeder et al. (2008)
  • 24. 6. Benefits Behara et al. (1995); Johnson (2002); Kueiand Madu (2003); Chan et al. (2005); Das et al. (2006); Agarwaland Bajaj (2008) 7. Organizational Change Carnell and Lambert (2000); Brewer (2004); Craven et al. (2006); Davison and Al- Shaghana (2007); Fazzariand Levitt (2008) 8. Challenges Feld and Stone (2002); Goh and Xie (2004); Gijo and Rao (2005); Goh et al. (2006); Kumar (2007); 9. Success Factors Antony and Banuelas (2002); Antony and Fergusson (2004); Buch and Tolentino (2006); Chung et al. (2008) 10. Organizational Learning Carnell and Lambert (2000); De Feo and Bar-El(2002); Box (2006); Savolainen and Haikonen (2007);
  • 25. SN Research Methodology References 1. Case-Focused Articles Smith (1993); Behara et al. (1995); Hoerl (1998); Does et al. (2002); Brett and Queen (2005); Horell and Snee (2010) 2. Review-Focused Articles Kuei and Madu (2003); Andersson et al. (2006); ; Rao and Rao (2007); Aggogeri and Gentili (2008) 3. Survey-Focused Articles Bhatnagar and Pandey (2005); Chakrabarty and Tan (2007); Chang and Wang (2008); Nabeel et al. (2010) Nature of Research Methodology Used for Six Sigma Among the surveyed articles of last 20 years, 63 percent were classified as empirical using either surveys or case studies, while about 37 percent of the articles were theoretical articles that usually employ extensive literature review to focus on the development of concepts, propositions, models or theory building.
  • 26. (b) SIX SIGMA IN MANUFACTURING INDUSTRY SN Author(s) Company / Unit Parameters Achievements 1. Henderson & Evans (2000) General Electric Company Implementation as a quality tool. Reduced the cycle time at repair shops. Annual saving of $2 billion Process improvement done 2. Ingle and Roe (2001) Medium sized welding unit Optimization of welding process parameters Joint strength is increased by 26% and scrap work is reduced by 3% 3. Does et al. (2002) A bulb manufacturing SME Improve the process and reduced the shell cracking of bulbs Sigma level increased from 3.1 to 4.5 Table cites major works of the researchers related to application of Six Sigma in manufacturing sector during the past decade.
  • 27. 4. Sharma (2003) Baxer Battery Limited Life of battery increased by 15% by proper utilizing of resources. Customer satisfaction and 12% annual increased in sale. 5. Holtz and Campbell (2004) Ford Motors Maintenance management by improving MTBF. Savings of $ 60000 achieved in six months. Sigma level improved from 1.4 to 2.1 6. Hu et al. (2005) A mediumscale IC engine manufacturing unit Improve the Cpk Process capability improved from 1.1 to 2.9 7. Sokovic et al. (2006) A gravity die casting unit Casting scrap reduced from 23% to 11% 40% reduction in manufacturing cost with annual savings of $72000 p.a. 8. Aggogeri and Gentili (2008) Cranberry Drinks Ltd. Improvement in packing process. DPMO level improved from 3011 to 178 only. 17% reduction in packing time. 9. Kuthe and Tharakan (2009) Wilson Tools Shorten the heat treatment time Roughly $10000 per year savings. 2% reduction in overall Lead time 10. Bewoor and Pawar (2010) A copper wire manufacturing plant Quality improvement in rolling operation Defect are decreased by 19% with in nine months of DMAIC project
  • 28. • After an extensive literature review, it appears that the application of Six Sigma in companies other than the big multinational companies has been rare and inconsistent. Little evidence exists in literature on Six Sigma implementation in foundry industry, which is counted as the most important supplier to other manufacturing industries. Since SME industries are facing serious sickness levels, an attempt can be made to implement Six Sigma over various systems and sub systems to considerably improve their respective productivity levels. • Literature has also reported tremendous financial gains through Six Sigma in large manufacturing sector, so an attempt can be made to replicate it in foundry SME sector too. RESEARCH GAPS
  • 29. PROBLEM FORMULATION • Govt. had introduced “Automotive Mission Plan” (AMP-2006) to rise the GDP by four times up to 2016. • Main focus of Govt. is on boosting Auto sector industries (that’s why Car production is increasing exponentially after 2006) • Due to which orders of foundries (as a major Supplier of most of parts) have also been elevated from last 6 to 7 years. • But Indian foundries showed their in-capabilities to supply ordered quantities because of poor performance & productivity levels.
  • 30.
  • 31. IMPACT of AMP (2006-2016) • Auto industries are importing casted parts from other countries like; China, USA, Australia and Russia. • It means our domestic foundries are losing business because of their poor production and quality levels.
  • 32. So Primarily, the major objectives of the present study are: • To formulate a comprehensive strategy for the successful implementation of Six Sigma in Indian foundry industry without ignoring its existing constraints. • To provide standard step by step methodologies to execute different phases of DMAIC projects successfully in Indian foundry environments. • To devise a strategy for selection of right tool/technique for right problem. • To demystify the different myths prevailing about Six Sigma in Indian SMEs after implementing it in a SME itself. OBJECTIVES OF THE STUDY
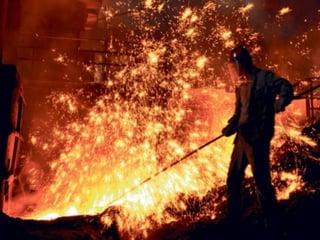
  • 33. ABOUT ORGANIZATION • A case study has been carried out in a non-ferrous foundry at Federal Mogul India Limited Bhahadurgarh, Patiala (Punjab) Foundry has a covered area of about 50144 sq. m and was established in 1954. • It is a medium scale unit used to cast pistons for export and domestic market. It uses mostly semi-automatic die casting machines. The unit under study casts pistons of diameter range from 30mm to 300mm and is capable to manufacture 13 million pistons per annum. RESEARCH WORK FINDINGS
  • 34. • Location: Patiala, Punjab, India • Product : Pistons, Pins (by semi-automatic die casting) • FM Share: 48.4% • TS 16949, • OHSAS 18001, • ISO 14001 FEDERAL MOGUL GOETZE INDIA LIMITED
  • 36. PISTON FOUNDRY MELTING NAAM Casting Cell Domestic Casting Cell HEAT TREATMENT
  • 37. DIE - CASTING Alloy Si Cu Mg Ni Fe FM132 8.5~10.5 2.0~4.0 0.5~1.5 0.5 Max 1.0 FM425 14.8~18 1.9~2.9 0.5~1.0 0.35~0.8 0.85 FM413/CSA12/ AC8A 11~13.5 0.5~1.3 0.8~1.5 0.7~1.3 0.8 CSA18 16~19 0.8~1.5 0.8~1.5 0.8~1.5 0.75 CSA24 22~26 0.5~1.3 0.8~1.5 0.7~1.3 0.7 VERTICAL GRAVITY DIE CASTING (Twin Cavity Mould) VERTICAL GRAVITY DIE CASTING (Single Cavity Mould)
  • 38. DEFINE • Problem • Voice of customer • Project charter • Project planning • Project scheduling • Snaps of problem • History of problem • COPQ matrix • Project goal • Process by SIPOC diagram MEASURE • Measure Cpk of process • Calculate present sigma level • Pareto charts to find reasons of scrap • Brainstorming by 5Ms • Access CTQs by Process mapping • Cause and effect matrix of CTQs • MSA • (Gauge R&R) • (Bias checking) • (Stability test) ANALYSE •Analysis of Shift dependency by Chi- square test •Analyse the variation of B.T. with Die coating thickness by One way ANOVA •Apply 2-Sample t-test to verify the effect of In-gate design on scrap •Analyse the impact of Operator-skill by 2- sample t-test • Multi-Regression analysis of Casting process- parameters • Fish bone -analysis of Metal sticking on pins of die • Why-Why analysis of Dimensional in - accuracy of machine variables IMPROVE • Optimization of process- parameters by Full factorial DOE • Continuous Improvement s by Kaizens • Poka-Yoke for machine & Die CONTROL • Evaluation of sigma level after improvement • X-bar R chart for controlling Bottom thickness variation of Piston. • P-charts to vigil overall scrap continuously under its control limits PHASES OF DMAIC STUDY
  • 39. The first step was to precisely define the problem, keeping in mind business objectives, customer needs and feed back. This involves identification of Critical to Quality (CTQ) issues and other items that have an impact on quality and customer satisfaction. Major Tools Used Voice of Customer (QFD), Project Charter, Project Scheduler, Snaps of Problem, Historical analysis of problem, COPQ Matrix, Process by SIPOC Diagram and Project Goals. 1. DEFINE PHASE
  • 41. Θ Θ Θ Θ ImportancetoCustomer EvaultionofVendors GoodProcessControls ReductioninScrapdueto CastingDefects LessDie/MachineSetuptime Implementationof MaintenanceSchedules EnsureAdherenceofQuality System GoodInspectionPlans Technology Upgradation/Innovation TrainingPlansforWorkForce EfficientSchedulingto completeProductionOrders Completeness Criteria M M H H M H M M L M 15 15 45 45 15 45 15 15 5 15 L M H M M M M M L L 5 15 45 15 15 15 15 15 5 5 M M M N L H H L M N 12 12 12 0 4 36 36 4 12 0 N M L H L L L H M M 0 15 5 45 5 5 5 45 15 15 L M H N N M M M M N 5 15 45 0 0 15 15 15 15 0 L L N N N L N H M L 3 3 0 0 0 3 0 27 9 3 H M H N L M M M M L 27 9 27 0 3 12 12 12 12 3 M H L N H M M M L N 15 45 5 0 15 15 15 15 5 0 M M H N L M L M N M 9 9 27 0 3 9 3 9 0 9 M M H L M M M M H H 15 15 45 5 15 15 15 15 45 45 IMPORTANCE RATING OF X's 106 153 256 110 75 170 131 172 123 95 10% Symbol Relationship Between X & Y Rating H Strong (H) 9 M Medium (M) 3 L Weak (W) 1 N No Relation (N) 0 Θ 5 3 5 3 5 5 4 3 5 5 6 5 4 3 Meet Deadlines/Schedules Strong Information System Reduce Rework TARGET DIRECTION 1 7 Satisfy Quality Initiatives (Overall Quality of the Product) Reduction in Production Cost Reduce Waste Develop Closer Supplier Relations Less Dimensional Problems Accountabilty of Supplied Product 2 Cycle Time Reduction Targer Directions More is Better Less is Better Specific Amount 125 48 117 130 230 150 VOC ( Machine Shop) TARGET VALUE OF CTC (Critical to Customer) FACTOR 128 155 78 23010 9 8 VOC (HOUSE OF QUALITY)
  • 44. 0.00% 5.00% 10.00% 15.00% 20.00% 25.00% 30.00% 35.00% 40.00% Jan Feb Mar Apr May Jun H-273 (Avg. 21.5%) H-749 (Avg. 20.9%) H-519 (Avg.22.5%) HISTORICAL ANALYSIS OF SCRAP
  • 45. COPQ MATRIX Financial Parameters H-273 H-519 H-749 Average Scrap/Month 1,866 1,100 885 Scrap Cost/Piston 183 183 183 Total Rejection Cost/ Month 3,41,478 2,01,300 1,61,955 Total Rejection Cost / Year 40,97,736 24,15,600 19,43,460 Total Rejection Cost for H- family Pistons Annually 84,56,796
  • 47. Phases Scheduled Dates Actual Dates Start date End date Start date End date Define 01/07/10 15/7/10 01/07/10 15/7/10 Measure 16/7/10 15/8/10 16/7/10 15/8/10 Analyse 16/8/10 07/10/10 16/8/10 22/9/10 Improve 08/10/10 22/11/10 23/9/10 30/11/10 Control 23/11/10 31/12/10 01/12/10 31/12/10 Schedule Chart Scheduled dates are decided after brain storming with concerned people from production, maintenance and quality departments. Actual dates are filled as different phases were accomplished with time.
  • 48. Measure phase is the second step after defining the problem which involves measurement system analysis, capability studies and finding performance gaps for the identified problem. Major Tools Used Sigma Calculator, Cpk study, Pareto Charts, FMEA Table, Cause and Effect Matrix, Gauge R&R study, Bias Checking and Stability Test. 2. MEASURE PHASE
  • 50. PROCESS MAPPING OF FOUNDRY Step 5: F A B B,C C D E J,K,L I H G Steps 10.- Die preparation Input Classification 20.- Ingots transportation to foundry Critic 30.- Ingots storage (in Cell) Controlled 40.- Furnace charge Noise 50.- Melting 60.- Degassing and flux treatment A.- Die coating 70.- Holding time and impurity flotation B.- Furnace charge relation 80.- Start up casting cell machine C.- Molten metal temperature 90.- Pouring D.- Density Index (ID) 100.- Croppers E.- Cycle time 110.- AQFD F.- Pouring speed 120.- Visual inspection and baskets accommodation G.- AQFD 130.- Storage before heat treatment H.- Without visual defects 140.- Heat Treatment I.- Aging 150.- Q.A. Release J.- Microstructure 160.- Transportation to release material area K.- Hardness 170.- Storage before machining L.- Chemical analysis Write Down and Classify the Key Process Input CTQ's 10 20 30 40 50 60 ID=1,5 max. Si No 70 80 90 100 110120130 Si No Scrap 130140150 Si No Scrap 160 170 Die temperature Die coating density Spray gun Free of humidity Free of slag Charge relation (60 Ingot /40 scrap) Temperature Metal Temp. N2 Flow RPM Time Time Water cooling system Cycle time Pouring speed Ladle cleaning Metal temperature Die Coating Water cooling time Water coling temp. Ingate separation AQFD Free of visual defects Separate in baskets by cavity Temperature Time Chemical Analysis Microstructure Hardness Q.A. Release card 10 20 30 40 50 60 ID=1,5 max. Si No 70 80 90 100 110120130 Si No Scrap 130140150 Si No Scrap 160 170 10 20 30 40 50 60 ID=1,5 max. Si No 70 80 90 100 110120130 Si No Scrap 130140150 Si No Scrap 160 170
  • 51. SIGMA CALCULATION (EXISTING) Production results of June-2010 Total number of Machined parts 8482 Scrap type Nos. Bottom Thickness Defect 480 Blow Holes 432 Cold Lap 120 Depression 120 Hydrogen Porosity 48 Shrinkage 457 Defective Pin Hole 210 Total Scrap in June 1866 Nos. of Opportunities 7 DPMO 31428 Sigma Level of Process 3.43 Yield (%) 76.96
  • 52. 10.089.929.769.609.449.289.12 LSL USL LSL 9.5 Target * USL 9.9 Sample Mean 9.59583 Sample N 60 StDev (Within) 0.150559 StDev (O v erall) 0.210772 Process Data C p 0.44 C PL 0.21 C PU 0.67 C pk 0.21 Pp 0.32 PPL 0.15 PPU 0.48 Ppk 0.15 C pm * O v erall C apability Potential (Within) C apability PPM < LSL 333333.33 PPM > USL 83333.33 PPM Total 416666.67 O bserv ed Performance PPM < LSL 262219.76 PPM > USL 21678.76 PPM Total 283898.52 Exp. Within Performance PPM < LSL 324670.34 PPM > USL 74494.82 PPM Total 399165.15 Exp. O v erall Performance Within Overall Process Capability W.R.T. BT (BEFORE) Cpk STUDY
  • 53. NUMBERS 26 19 52426 203 133 99 98 52 40 32 Percent 2.2 1.6 4.436.1 17.2 11.3 8.4 8.3 4.4 3.4 2.7 Cum % 94.0 95.6100.036.1 53.3 64.6 73.0 81.3 85.7 89.1 91.8 DEFECTS Other Cold lap Def. Blanks Inside Porosity Skirt Shrinkage Skirt Blow Holes Bottom Shrinkage Bottom Porosity Ring Zone Blow Holes Ring Zone Bottom thickness variation Shrinkage Ring Zone 1200 1000 800 600 400 200 0 100 80 60 40 20 0 NUMBERS Percent Pareto Chart of H-749 PARETO CHART FOR DEFECTS
  • 54. CTQ PROCESS FACTORS Critic Control Noise 10 9 9 6 6 10 9 Defective blanksbottom BlowHoles ColdLaps Depression Hydrogen Porosity Shrinkage DefectivePin Hole S.NO Process Step Process Input 1 Design Bottom Seating Design 5 0 0 3 0 0 0 68 2 Design Gate Feeding Design 3 3 3 0 2 5 0 146 3 Die repair Dimensional accuracy of Die parts 5 0 2 5 0 0 0 98 4 Die repair Dimensional accuracy of casting Machine parts 4 0 1 3 0 0 0 199 5 Set up Die Temperature & Preheating 0 5 4 0 5 5 2 179 6 Set Up Die Cooling Connections 0 5 4 0 4 4 0 145 7 Set Up Die Coating Thickness 4 4 4 0 4 4 0 176 8 Set up Water Cooling Pressure too low 0 3 0 0 5 4 0 97 9 Set up Discharge of Cooling water inside die parts 0 5 3 0 3 5 0 140 10 Set up Vaccum Pressure in air vents 0 3 5 0 4 2 0 116 11 Set up Ratio of water to Dycote 0 3 4 0 3 2 0 101 12 Casting Low Pouring Speed 0 2 5 0 0 3 0 93 13 Casting Die Core grouping 3 0 0 2 0 0 0 42 14 Casting Non-continuity in casting process 0 3 5 2 5 5 0 164 15 Casting Metal Sticking on Pin 0 0 0 5 0 0 5 75 16 Pouring Casting Temperature too High 0 4 0 0 5 5 0 116 17 Pouring Casting Temperature too Low 0 4 3 0 5 5 2 161 18 Pouring Degassing Procedure & waiting time 0 5 2 0 4 5 0 137 19 Pouring Skill of Operator 3 1 3 1 2 2 2 122 270 450 432 126 306 560 99 CAUSE AND EFFECT MATRIX TotalEFFECTS Correlation of Input to Output Characteristic RATING OF IMPORTANCE TO CUSTOMER Actions Decided
  • 55. GAUGE R&R STUDY (MSA) PART NAME :PISTON GAGE NAME : BT CHECKING INSTRUMENT CHARACTERISTICS:BOTTOM THICKNESS GAGE NO.: MBT-03 L.C 0.01 MM SPECIFICATIONS :0.40 MM DATA SHEET PART AVERAGE APPRAISER TRIALS 1 2 3 4 5 6 7 8 9 10 AVTAR SINGH 1 8.12 7.88 8.16 8.00 7.81 8.12 7.88 7.87 8.13 8.10 2 8.10 7.86 8.16 8.00 7.80 8.11 7.87 7.88 8.12 8.10 3 8.11 7.86 8.13 8.02 7.81 8.10 7.87 7.88 8.12 8.10 Average 8.11 7.87 8.15 8.01 7.81 8.11 7.87 7.88 8.12 8.10 Xa= 8.00 Range 0.02 0.02 0.03 0.02 0.01 0.02 0.01 0.01 0.01 0.00 Ra= 0.01 NACHATTAR SINGH 1 8.12 7.88 8.16 8.02 7.81 8.12 7.88 7.87 8.13 8.10 2 8.10 7.87 8.14 8.00 7.80 8.11 7.86 7.86 8.12 8.11 3 8.11 7.86 8.13 8.02 7.80 8.10 7.87 7.88 8.11 8.10 Average 8.11 7.87 8.14 8.01 7.80 8.11 7.87 7.87 8.12 8.10 Xb= 8.00 Range 0.02 0.02 0.03 0.02 0.01 0.02 0.02 0.02 0.02 0.01 Rb= 0.02 MOHINDER SINGH 1 8.10 7.88 8.16 8.00 7.81 8.12 7.88 7.87 8.13 8.10 2 8.10 7.90 8.16 8.00 7.82 8.11 7.90 7.88 8.12 8.11 3 8.12 7.86 8.13 8.02 7.81 8.12 7.87 7.88 8.12 8.10 Average 8.11 7.88 8.15 8.01 7.81 8.12 7.88 7.88 8.12 8.10 Xc= 8.01 Range 0.02 0.04 0.03 0.02 0.01 0.01 0.03 0.00 0.01 0.00 Rc= 0.02 16 Part Ave Xp 8.11 7.87 8.15 8.01 7.81 8.11 7.88 7.87 8.12 8.10 Rp= 0.34 17 Ra+Rb+Rc/N ofApraiser R= 0.0170 18 Max X-Min X=Xdiff Xdiff= 0.0047 19 R* D4 =UCLR UCL 0.044 20 R* D3 =LCLR LCL 0
  • 56. Two-Way ANOVA Table With Interaction Source DF SS MS F P PartID 9 0.948327 0.105370 1433.24 0.000 Operator 2 0.000243 0.000122 1.65 0.219 PartID * Operator 18 0.001323 0.000074 0.92 0.564 Repeatability 30 0.002400 0.000080 Total 59 0.952293 Alpha to remove interaction term = 0.25 Two-Way ANOVA Table Without Interaction Source DF SS MS F P PartID 9 0.948327 0.105370 1358.39 0.000 Operator 2 0.000243 0.000122 1.57 0.219 Repeatability 48 0.003723 0.000078 Total 59 0.952293 Gage R&R %Contribution Source VarComp (of VarComp) Total Gage R&R 0.0000798 0.45 Repeatability 0.0000776 0.44 Reproducibility 0.0000022 0.01 Operator 0.0000022 0.01 Part-To-Part 0.0175487 99.55 Total Variation 0.0176285 100.00 Study Var %Study Var Source StdDev (SD) (6 * SD) (%SV) Total Gage R&R 0.008932 0.053590 6.73 Repeatability 0.008807 0.052844 6.63 Reproducibility 0.001485 0.008909 1.12 Operator 0.001485 0.008909 1.12 Part-To-Part 0.132471 0.794829 99.77 Total Variation 0.132772 0.796633 100.00 Number of Distinct Categories = 20
  • 57. Part-to-PartReprodRepeatGage R&R 100 50 0 Percent % Contribution % Study Var 0.04 0.02 0.00 SampleRange _ R=0.01067 UCL=0.03485 LCL=0 1 2 3 8.2 8.0 7.8 SampleMean __ X=8.0047 UCL=8.0247 LCL=7.9846 1 2 3 10987654321 8.2 8.0 7.8 PartID 321 8.2 8.0 7.8 Operator 10987654321 8.2 8.0 7.8 PartID Average 1 2 3 Operator Gage name: B.T. Gauge Date of study : 02/08/10 Reported by : Bikram jit singh Tolerance: 0.40mm Misc: Components of Variation R Chart by Operator Xbar Chart by Operator Measure by PartID Measure by Operator Operator * PartID Interaction Gauge R & R for B.T. Gauge GAUGE R&R STUDY
  • 58. BIAS STUDY PART NAME: H-273 Gaug Name & Immersion Pyrometer Parameter Temperature L.C. 1 degree Appraiser Name Sukhdev Singh - 50972 Reference Value. 755 Degree C TRIALS(n) 1 756 1.000 2 754 0.000 3 749 -6.000 4 750 -5.000 5 751 -4.000 6 752 -3.000 7 752 -3.000 8 754 -1.000 9 753 -2.000 10 753 -2.000 11 752 -3.000 12 752 -3.000 13 750 -5.000 14 747 -8.000 15 745 -10.000 751.33333 -3.600000 -3.66667 Plot Histogram related to the reference value Anayse the histogram for any special cause Max(Xi)-Min(Xi) Calculate s Reapatability( sr)= d2* 3.0956877 Where d2* & d2 is taken from the table(appendix C) d2*= 3.5533 Calculate Where n = no. of trials d2= 3.4179 sb 0.7993031 1.7189648 Lower limit -5.38563 Pyrometer is biased and need Caliberation Upper limit -1.94770 or repair BIAS n rs X Bias BIAS STUDY (MSA)
  • 59. Date Feb 1 3 4 5 6 7 8 10 11 12 13 14 15 18 19 20 21 22 24 25 Time X1 X2 X3 X4 N/s M/s A/s N/s 1 2 3 4 5 6 7 8 9 10 11 12 13 14 15 16 17 18 19 20 X1 0.4 0.3 0.4 0.6 0.3 0.4 0.4 0.4 0.5 0.4 0.3 0.3 0.4 0.3 0.4 0.1 0.6 0.4 0.4 0.3 X2 1.2 0.2 0.3 0.4 0.4 0 0.5 0.3 0.3 0.3 0.4 1.2 0 0.4 0.3 0.2 0.4 0.5 0.4 0.4 X3 0.5 0.3 0.4 0.4 0.4 0.2 0.3 0.5 0.4 0.3 0.5 0.2 0.4 0.3 0.5 0.2 0.4 0.4 0.3 0.3 X4 0.2 0.4 0.3 0.4 0.4 0.4 0.4 0.4 0.4 0.6 0.5 2.3 0.5 0.4 0.5 0 0.5 0.4 0.4 0.3 Xbar 0.5750 0.3000 0.3500 0.4500 0.3750 0.2500 0.4000 0.4000 0.4000 0.4000 0.4250 1.0000 0.3250 0.3500 0.4250 0.1250 0.4750 0.4250 0.3750 0.3250 Range 1.000 0.200 0.100 0.200 0.100 0.400 0.200 0.200 0.200 0.300 0.200 2.100 0.500 0.100 0.200 0.200 0.200 0.100 0.100 0.100 Sub Group Size= 4 A2= 0.729 D3= 0 D4= 2.28 D2= Standard deviation (s) R = Gauge stability= s X100 % BIAS CONTROL CHART METHOD BIAS ULX = d2= Xdbar = = = LCLx = d2*= UCLr = tv,1-a/2 = Lower Limit = R bar = LCL = 0 alpha = 0.05 Upper Limit = Result Gage is not well stable 0.036220294 0.163 0.4075 2.05875 0.3350 0.76 2.06813 2.000 0.479612034 0.40750 0.16198208 28.26765674 0.6517 2.059 0.197873597 0.335388 R e a d I n g s Tolerance *2d R r =s g r b s s = STABILITY TESTING (MSA)
  • 60. STABILITY TEST PART NAME : GAUGE NAME &L.C: Vac Tester TOLERANCE : MM MASTER VALUE: mm X=Averrage X UCL= X+A2R= LCL=X - A2R= R = average R UCL=D4xR LCL=D3xR 0 0.4075 0.3350 0.7645 CSA-18 alloy 0.70 0.16330.6517 0.00 0.0000 0.1000 0.2000 0.3000 0.4000 0.5000 0.6000 0.7000 0.8000 0.9000 1.0000 1 2 3 4 5 6 7 8 9 10 11 12 13 14 15 16 17 18 19 20 0.0000 0.5000 1.0000 1.5000 2.0000 1 2 3 4 5 6 7 8 9 10 11 12 13 14 15 16 17 18 19 20 Oneunit=Oneunit= ucl Lcl ucl Lcl MEAN & RANGE CHARTS
  • 61. 3. ANALYSE PHASE The authenticity and impact realization of each SSV on scrap, is required to be judged by conducting suitable investigation under Analyze Phase. This phase helps to focus improvement efforts on those SSVs which can be highly significant for positive scrap reduction. Major Tools Used Table ahead gives a summary of various quantitative and qualitative techniques/tools used for analyzing the measured critical to quality (CTQ) process parameters.
  • 62. ANALYSIS of SSVs Type of Analysis Technique used Name of Tool used SSV’s to be analysed Hypothesis testing (OFAT) Chi Square test Analysis of Shift dependency One way ANOVA Die coating thickness 2 Sample t-test In gate design (or Vol. of R&R) Operator skill Discharge of Cooling water MFAT Multi-regression analysis Alloy temperature Die temperature Delay time Graphical Analysis Interaction Plot Vaccume Pressure Qualitative technique Fish-bone analysis Metal sticking on a pin Why-why analysis Machine‘s dimensional In- accuracy ANALYTICAL PLAN
  • 63. Null Hypothesis Ho: µ1 = µ2 = µ3 Actual Hypothesis Ha: µ1 ≠ µ2 ≠ µ3 Shifts Production Good Scrap Bottom thickness variation Blow hole Porosity Shrinkage Depression Cold lap Pin hole defect Night Shift (1) 128 102 26 13 4 1 3 2 1 2 Morning Shift (2) 124 100 24 8 6 2 3 1 2 2 Afternoon Shift (3) 127 101 27 10 2 3 5 2 3 2 ( Scrap depends upon the shifts) (Scrap is independent of Shifts) Chi-square Test TEST FOR SHIFT DEPENDENCY
  • 64. Session Confirmation from Minitab Expected value = (Row obs. total) * (Column obs. total) Grand observation Total Expected Value of “B.T.” in Defect type of the N/S E = (26 X 31)/77 = 10.47 Chi-Square = (O-E) / E Chi-Square = (13-10.47) /10.47 = 0.613 2 2 Since P Value > 0.05 ; Reject Ha , Accept Ho Hence Scrap in piston foundry is independent of shifts B.T.vary B. hole Prsty Shrkg Dep. C. lap P.H. defect Total 1 13 4 1 3 2 1 2 26 10.47 4.05 2.03 3.71 1.69 2.03 2.03 0.613 0.001 0.520 0.137 0.058 0.520 0.000 2 8 6 2 3 1 2 2 24 9.66 3.74 1.87 3.43 1.56 1.87 1.87 0.286 1.365 0.009 0.054 0.200 0.009 0.009 3 10 2 3 5 2 3 2 27 10.87 4.21 2.10 3.86 1.75 2.10 2.10 0.070 1.158 0.382 0.339 0.035 0.382 0.005 Total 31 12 6 11 5 6 6 77 Chi-Sq = 6.150, DF = 12, P-Value = 0.908 Df= 2(n-1) n= no. Of sub groups CHI SQUARE CALCULATIONS
  • 65. Null Hypothesis Ho: µ1 = µ2 = µ3 = µ4 Actual Hypothesis Ha: µ1 ≠ µ2 ≠ µ3 ≠µ4 Die coating thickness 50µm Die coating thickness 80µm Die coating thickness 110µm Die coating thickness 140µm 9.81 9.80 9.70 9.70 9.70 9.71 9.87 9.80 9.80 9.80 9.80 9.70 9.90 9.89 9.58 9.67 9.70 9.75 9.68 9.71 9.60 9.62 9.60 9.80 9.80 9.65 9.67 9.89 9.76 9.75 9.85 9.75 9.70 9.66 9.95 9.62 9.87 9.66 9.80 9.65 9.80 9.77 9.76 9.75 9.58 9.58 9.66 9.70 9.68 9.68 9.61 9.87 9.60 9.58 9.70 9.80 9.67 9.67 9.80 9.58 9.85 9.85 9.70 9.86 9.95 9.95 9.67 9.90 9.80 9.88 9.71 9.70 9.53 9.53 9.80 9.87 9.95 9.95 9.89 9.80 (Diecoating thickness do not effect Bottom thickness variation) (Diecoating thickness effects Bottom thickness variation) One way ANOVA to analyse B.T. defect with Die coating thickness ANOVA TEST FOR COATING THICKNESS
  • 66. One-way ANOVA: Die coating , Die coating , Die coating , Die coating Source DF SS MS F P Factor 3 0.0054 0.0018 0.15 0.932 Error 76 0.9361 0.0123 Total 79 0.9415 S = 0.1110 R-Sq = 0.57% R-Sq(adj) = 0.00% Level N Mean St Dev Die coating thickness 50 20 9.7525 0.1217 Die coating thickness 80 20 9.7365 0.1236 Die coating thickness 110 20 9.7400 0.1021 Die coating thickness 14 0 20 9.7560 0.0935 Individual 95% CIs For Mean Based on Pooled St Dev Level -+---------+---------+---------+-------- Die coating thickness 50 (----------------*---------------) Die coating thickness 80 (----------------*---------------) Die coating thickness 11 (----------------*---------------) Die coating thickness 14 (---------------*---------------) -+---------+---------+---------+-------- 9.690 9.720 9.750 9.780 Df= n-1 (n= nos. of data population or groups) Since p value is coming out to be more than 0.05, so Null hypothesis is accepted. Hence in present case, Die- coating thickness do not effect the Bottom- thickness variation, substantially. ANOVA STATISTICS
  • 67. ANOVA GRAPHS Die coating thickness 140µm Die coating thickness 110µm Die coating thickness 80µm Die coating thickness 50µm 10.0 9.9 9.8 9.7 9.6 9.5 Data Individual Value Plot of thickness 50µm, 80µm, 110µm, 140µm Die coating thickness 140µm Die coating thickness 110µm Die coating thickness 80µm Die coating thickness 50µm 10.0 9.9 9.8 9.7 9.6 9.5 Data Boxplot of thickness 50µm, 80µm, 110µm, 140µm 0.40.30.20.10.0-0.1-0.2-0.3-0.4 99.9 99 95 90 80 70 60 50 40 30 20 10 5 1 0.1 Residual Percent Normal Probability Plot (responses arethickness 50µm, 80µm, 110µm and 140µm)
  • 68. Null Hypothesis Ho: µ1 = µ2 Volume of riser & runner has no impact on casting scrap Actual Hypothesis Ha: µ1 ≠ µ2 Volume of riser & runner has impact on casting scrap Trails With Existing volume of Runner & Riser (240-250 cubic cm) With Enlarged volume of Runner & Riser (260-270 cubic cm) 1 18% 15% 2 20% 16% 3 19% 14% 4 17% 12% 5 21% 13% 6 16% 11% Taken 50 pistons per trail to assess the actual scrap in %age Analysis of Scrap(in %age) with variation in Volume of Riser & Runner 2 Sample t-test 2 SAMPLE t-TEST FOR IN-GATE DESIGN
  • 69. Conclusion: as P value is <0.05 So, Discard Ho and Accept Ha. It implies, there is a relation between Runner & Riser Volume and casting scrap. Two-Sample T-Test and CI: With Existing volume of , With Enlarged volume of Two-sample T for With Existing volume of Runner vs With Enlarged volume of Runner N Mean StDev SE Mean With Existing volume of 6 0.1850 0.0187 0.0076 With Enlarged volume of 6 0.1350 0.0187 0.0076 Difference = mu (With Existing volume of Runner) - mu (With Enlarged volume of Runner) Estimate for difference: 0.0500 95% CI for difference: (0.0259, 0.0741) T-Test of difference = 0 (vs not =): T-Value = 4.63 P-Value = 0.001 DF = 10 2(n-1) n= number of trails or group size t-TEST CALCULATIONS
  • 70. 2 Sample t - TEST GRAPHS With Enlarged volume of RunnerWith Existing volume of Runner 22.00% 20.00% 18.00% 16.00% 14.00% 12.00% 10.00% Data Individual Value Plot of Existing V/s Enlarged R & R With Enlarged volume of RunnerWith Existing volume of Runner 22.00% 20.00% 18.00% 16.00% 14.00% 12.00% 10.00% Data Boxplot of Existing V/s Enlarged volume of R & R 23.00% 22.00% 21.00% 20.00% 19.00% 18.00% 17.00% 16.00% 15.00% 14.00% 99 95 90 80 70 60 50 40 30 20 10 5 1 With Existing volume of Runner Percent Mean 0.185 StDev 0.01871 N 6 AD 0.136 P-Value 0.947 Probability Plot With Existing volume of R & R Normal 18.00%16.00%14.00%12.00%10.00% 99 95 90 80 70 60 50 40 30 20 10 5 1 With Enlarged volume of Runner Percent Mean 0.135 StDev 0.01871 N 6 AD 0.136 P-Value 0.947 Probability Plot With Enlarged volume of R & R Normal
  • 71. Conclusion: as P value is <0.05 So, Discard Ho and Accept Ha. It implies, Operator skill has an impact over scrap Two-Sample T-Test and CI: Semi-skilled Die operator, Skilled Die operator Two-sample T for Semi-skilled Die operator vs Skilled Die operator N Mean StDev SE Mean Semi-skilled Die operato 6 0.1833 0.0216 0.0088 Skilled Die operator 6 0.1367 0.0216 0.0088 Difference = mu (Semi-skilled Die operator) - mu (Skilled Die perator) Estimate for difference: 0.0467 95% CI for difference: (0.0189, 0.0745) T-Test of difference = 0 (vs not =): T-Value = 3.74 P-Value = 0.004 DF = 10 IMPACT OF OPERATOR SKILL
  • 72. 24.00%22.00%20.00%18.00%16.00%14.00%12.00% 99 95 90 80 70 60 50 40 30 20 10 5 1 Semi-skilled Die operator Percent Mean 0.1833 StDev 0.02160 N 6 AD 0.143 P-Value 0.934 Probability Plot of Semi-skilled Die operator Normal 20.00%18.00%16.00%14.00%12.00%10.00% 99 95 90 80 70 60 50 40 30 20 10 5 1 Skilled Die operator Percent Mean 0.1367 StDev 0.02160 N 6 AD 0.143 P-Value 0.934 Probability Plot of Skilled Die operator Normal Skilled Die operatorSemi-skilled Die operator 22.00% 20.00% 18.00% 16.00% 14.00% 12.00% 10.00% Data Individual Value Plot of Semi-skilled Die operator, Skilled Die operator Skilled Die operatorSemi-skilled Die operator 22.00% 20.00% 18.00% 16.00% 14.00% 12.00% 10.00% Data Boxplot of Semi-skilled Die operator, Skilled Die operator GRAPHICAL RESULTS
  • 73. 24.00%22.00%20.00%18.00%16.00%14.00%12.00% 99 95 90 80 70 60 50 40 30 20 10 5 1 Discharge (3-5 LPM) Percent Mean 0.1817 StDev 0.02317 N 6 AD 0.191 P-Value 0.818 Probability Plot of Discharge (3-5 LPM) Normal 18.00%16.00%14.00%12.00%10.00% 99 95 90 80 70 60 50 40 30 20 10 5 1 Discharge (7-10LPM) Percent Mean 0.1383 StDev 0.01941 N 6 AD 0.329 P-Value 0.380 Probability Plot of Discharge (7-10LPM) Normal Discharge (7-10LPM)Discharge (3-5 LPM) 22.00% 20.00% 18.00% 16.00% 14.00% 12.00% 10.00% Data Individual Value Plot of Discharge (3-5 LPM), Discharge (7-10LPM) Discharge (7-10LPM)Discharge (3-5 LPM) 22.00% 20.00% 18.00% 16.00% 14.00% 12.00% 10.00% Data Boxplot of Discharge (3-5 LPM), Discharge (7-10LPM) RESULTS FOR DISCHARGE OF WATER P = 0.007
  • 74. Alloy Temperature Stoppage (IN Sec) Die Temp Total pistons Scrap %age of Scrap 755 50 239.7 10 4 40.0 757 85 251.8 5 2 40.0 760 45 240 8 3 37.5 763 5 265 7 0 0.0 764 35 273.6 13 2 15.4 765 120 283 17 6 35.3 752 90 276.7 10 2 20.0 754 10 250.2 10 3 30.0 Mean Multi Regression Data ANALYSIS OF CASTING PARAMETERS
  • 75. REGRESSION STATISTICS Regression Analysis: %ageof Scrap versus Alloy Temp.,Stoppage(in secs) & Die Temp. Theregression equationis %ageof Scrap = 114 + 0.118 Alloy Temperature+0.306 Stoppage(in Sec) - 0.745 DieTemp Predictor Coef SE Coef T P Constant 114.4 476.2 0.24 0.822 Alloy Temperature 0.1184 0.6554 0.18 0.865 Stoppage(INSec) 0.30615 0.08153 3.76 0.020 DieTemp -0.7454 0.2130 -3.50 0.025 S = 7.70734 R-Sq = 83.5% R-Sq(adj)=71.1% Analysisof Variance Source DF SS MS F P Regression 3 1200.75 400.25 6.74 0.048 ResidualError 4 237.61 59.40 Total 7 1438.37 Source DF Seq SS Alloy Temperature 1 129.92 Stoppage(INSec) 1 343.56 DieTemp 1 727.28 As P>0.05 forAlloy temp. It implies it is already in control. As P<0.05 for Stoppage or delay It implies it effects Scrap positively. As P<0.05 for Die temperature It implies it also effects Scrap substantially. As P<0.05 for overall regression It implies, its input variables have impact on dependent variables.
  • 76. INTERATCTION PLOT DATA Die No. Vaccume Pressure( in atm) Scrap (in %age) 1 0.2-0.3 14 1 0.4-0.5 16 1 0.6-0.7 17 1 0.8-0.9 21 2 0.2-0.3 15 2 0.4-0.5 15 2 0.6-0.7 18 2 0.8-0.9 20 3 0.2-0.3 12 3 0.4-0.5 14 3 0.6-0.7 16 3 0.8-0.9 19 4 0.2-0.3 14 4 0.4-0.5 19 4 0.6-0.7 21 4 0.8-0.9 22
  • 77. Beside this parameter (Vaccume pressure) affects the scrap, but as we already working in the range of 0.2-0.3 bar, so scope of further reduction in Scrap by optimizing Vaccume Pressure, is not substantial 0.8-0.90.6-0.70.4-0.50.2-0.3 21 18 15 12 4321 21 18 15 12 Die No. Vaccume Pressure( in atm) 1 2 3 4 No. Die 0.2-0.3 0.4-0.5 0.6-0.7 0.8-0.9 (in atm) Pressure Vaccume Data Means
  • 78. FISH BONE ANALYSIS (FOR PIN DEFECTS) Pin hole Defective Die Environment Measure Methods Material Machines Man bed management policies by HR Dept. Poor grief management Lack of trainig audits worries) Distraction (mental casual labours Faulty procedure to selct In adequate Training Zerking of hydraulic rams time Given less soldification parts Play in between the die Improper die closing Non flatness of M/c bed Moulds Haphazard movement of Fix the No criteria to control plan Absence of the coating No control over Selection of Improper material coating Lack of parting temperature of Low unskilled labour Deputation of training Scaracity of Process procedures Non-standard set-up supevision In adequate Absence of check lists procedure Lack of standard caliberation No check on needed gadgets Scaracity of maintenance of Poor identify No system to assessment Improper Risk installing Lack of MSA for enviornmental Absence of conditions Bad enviornmental Less space Bad state of 5-S Lack of illumination Poor working posture coating Wear & tear of coating on Pins Scarcity of before set-up Dirty Pins on Pins Metal sticking Pins Blunt edges of diameter Variable Pin
  • 79. Out of control Causes With in control Causes Die Machine Material Method Man Measurement Enviornment VariablePin diameter Haphazard movementof Moulds Lowtemperatureof metal Lack of standard procedure In adequateTraining Lack of MSAfor installing instruments Poor working posture Bluntedges of Pins Non flatnessof M/c bed Lack of parting materialcoating Absenceof check lists Faulty procedureto selctcasuallabours Improper Risk assessment Lack of illumination Metalsticking on Pins Improper dieclosing Improper Selection of parting material In adequatesupevision Distraction (mentalworries) No system to identify deficiencies Bad stateof 5-S Dirty Pins beforeset-up Play in between thedieparts No controlover thecoating thickness Non-standard set-up procedures Lack of trainig audits Poor maintenanceof instruments Less space Scarcity of coating on Pins Given less soldification time Absenceof controlplan Scaracity of Processtraining Poor grief managementby HRDept. Scaracity of needed gadgets Bad enviornmentalconditions Wear &tear of coating Zerking of hydraulic rams No criteria to Fix therecoating period Deputation of unskilled labour bed managementpolicies No check on caliberation periods Absenceof enviornmentalsurveys ROOT CAUSE RESULTS
  • 80. WHY - WHY ANALYSIS FOR M/C Improper seatingof Die’s bottom (B.T. variation) Bottom and catcher assembly mounted on sameRam Mis-alignment of Die’s bottom w.r.t. mould seat Play or mis- alignment of bottom carryingRam Bottom tooland catcher design of machineis faulty Operator’serror Die is not checked properlyby Die- fitter beforeset-up or installation Only fourcorner head padsare provided for bottom guidance Seating arrangementof Die’s bottom is not proper. Problem in Die design Faulty Die- checking/passing procedure Key reasons Non-criticalreasons
  • 81. RESULT AFTER A-PHASE Type of Analysis Technique used Name of Tool used SSV’s to be analysed Hypothesis testing (OFAT) Chi Square test Analysis of Shift dependency One way ANOVA Die coating thickness 2 Sample t-test Volume of Runner & riser Operator skill Discharge of cooling water MFAT Multi-regression analysis Alloy temperature Die temperature Delay time Graphical Analysis Interaction Plot Vaccume Pressure Qualitative technique Fish-bone analysis Metal sticking on a pin Why-why analysis Machine’s dimensional in- accuracy OUTCOMES OF ANALYSE PHASE
  • 82. 4. IMPROVE PHASE In this phase actions are piloted and real tolerances are established to deliver desired performance. Various suggestions and new activities are added during optimization of the out-put variable. Major Tools Used: Design of Experiments (DOE), Tanguchi’s Method, RSM, Poka-Yoke, Kaizen etc.
  • 83. STEP-1 STEP-2 Improvement by optimizations Improvement by incorporating Error proofing Define objective of improve phase As prescribed from D, M and A phase Improve Phase Principles of Poka-Yoke, Pilot Studies DoE, RSM, Tanguchi Methods, Product/Process Simulation Technological innovation and overhauling Triz, Creativity, Quality Tools etc. Improvement through Continuous improvements Kaizen, Quality Circles, TPM, TQM, 5S Improvement by virtue of Training and knowledge Six Sigma Black Belt, Green Belt Training, Knowledge of Statistics PROPOSED FRAMEWORK FOR I-PHASE
  • 84. TOOL USED SSV’s TO BE IMPROVED OPTIMIZATION WITH DESIGN OF EXPERIMENTS (DOE) Volume of Runner & riser Discharge of cooling water Die temperature Delay time POKA-YOKE Machine’s dimensional in-accuracy KAIZEN Metal sticking on a pin Operator Skill On-Job Training IMPROVEMENT PLAN
  • 85. DESIGN OF EXPERIMENTS StdOrder RunOrder CenterPt Blocks Die Temp Discharge of water Delay Volume of R&R 3 1 1 1 -1 1 -1 -1 27 2 1 1 -1 1 -1 1 6 3 1 1 1 -1 1 -1 4 4 1 1 1 1 -1 -1 1 5 1 1 -1 -1 -1 -1 29 6 1 1 -1 -1 1 1 23 7 1 1 -1 1 1 -1 13 8 1 1 -1 -1 1 1 11 9 1 1 -1 1 -1 1 14 10 1 1 1 -1 1 1 9 11 1 1 -1 -1 -1 1 19 12 1 1 -1 1 -1 -1 24 13 1 1 1 1 1 -1 22 14 1 1 1 -1 1 -1 28 15 1 1 1 1 -1 1 25 16 1 1 -1 -1 -1 1 8 17 1 1 1 1 1 -1 16 18 1 1 1 1 1 1 12 19 1 1 1 1 -1 1 26 20 1 1 1 -1 -1 1 32 21 1 1 1 1 1 1 17 22 1 1 -1 -1 -1 -1 18 23 1 1 1 -1 -1 -1 2 24 1 1 1 -1 -1 -1 15 25 1 1 -1 1 1 1 20 26 1 1 1 1 -1 -1 10 27 1 1 1 -1 -1 1 5 28 1 1 -1 -1 1 -1 31 29 1 1 -1 1 1 1 7 30 1 1 -1 1 1 -1 30 31 1 1 1 -1 1 1 21 32 1 1 -1 -1 1 -1 Factors/ Levels Die Temperature oC Discharge of Water (Litre/ Minutes) Delay (Seconds) Volume of R&R (Cm3) Low 250 7 60 260 High 330 10 180 285
  • 86. StdOrder RunOrder CenterPt Blocks Die Temp Discharge of water Delay Volume of R&R Scrap (%) 3 1 1 1 250 10 60 260 14 27 2 1 1 250 10 60 285 10 6 3 1 1 330 7 180 260 18 4 4 1 1 330 10 60 260 17 1 5 1 1 250 7 60 260 15 29 6 1 1 250 7 180 285 11 23 7 1 1 250 10 180 260 12 13 8 1 1 250 7 180 285 11 11 9 1 1 250 10 60 285 9 14 10 1 1 330 7 180 285 16 9 11 1 1 250 7 60 285 10 19 12 1 1 250 10 60 260 13 24 13 1 1 330 10 180 260 18 22 14 1 1 330 7 180 260 20 28 15 1 1 330 10 60 285 15 25 16 1 1 250 7 60 285 9 8 17 1 1 330 10 180 260 18 16 18 1 1 330 10 180 285 12 12 19 1 1 330 10 60 285 13 26 20 1 1 330 7 60 285 15 32 21 1 1 330 10 180 285 13 17 22 1 1 250 7 60 260 16 18 23 1 1 330 7 60 260 19 2 24 1 1 330 7 60 260 18 15 25 1 1 250 10 180 285 9 20 26 1 1 330 10 60 260 17 10 27 1 1 330 7 60 285 15 5 28 1 1 250 7 180 260 17 31 29 1 1 250 10 180 285 10 7 30 1 1 250 10 180 260 14 30 31 1 1 330 7 180 285 16 21 32 1 1 250 7 180 260 17 EXECUTION OF EXPERIMENTS
  • 87. Factorial Fit: Scrap (%) versus Die Temp, Discharge of water, Estimated Effects and Coefficients for Scrap (%) (coded units) Term Effect Coef SE Coef T P Constant 14.281 0.1362 104.84 0.000 Die Temp 3.937 1.969 0.1362 14.45 0.000 Discharge of water -1.813 -0.906 0.1362 -6.65 0.001 Delay 0.438 0.219 0.1362 1.61 0.128 Volume of R&R -4.313 -2.156 0.1362 -15.83 0.002 Die Temp*Discharge of water 0.062 0.031 0.1362 0.23 0.821 Die Temp*Delay -0.187 -0.094 0.1362 -0.69 0.501 Die Temp*Volume of R&R 0.563 0.281 0.1362 2.06 0.056 Discharge of water*Delay -0.687 -0.344 0.1362 -2.52 0.026 Discharge of water*Volume of R&R 0.312 0.156 0.1362 1.15 0.268 Delay*Volume of R&R -0.187 -0.094 0.1362 -0.69 0.501 Die Temp*Discharge of water*Delay 0.187 0.094 0.1362 0.69 0.501 Die Temp*Discharge of water* -0.813 -0.406 0.1362 -2.98 0.009 Volume of R&R Die Temp*Delay*Volume of R&R -0.313 -0.156 0.1362 -1.15 0.268 Discharge of water*Delay* -0.313 -0.156 0.1362 -1.15 0.268 Volume of R&R Die Temp*Discharge of water*Delay* -0.437 -0.219 0.1362 -1.61 0.128 Volume of R&R S = 0.770552 PRESS = 38 R-Sq = 97.09% R-Sq(pred) = 88.36% R-Sq(adj) = 94.36% DOE ANALYSIS OF ORTHOGONAL MATRIX
  • 88. 151050-5-10-15-20 99 95 90 80 70 60 50 40 30 20 10 5 1 Standardized Effect Percent A Die Temp B Discharge of water C Delay D Volume of R&R Factor Name Not Significant Significant Effect Type ABD BC D B A Normal Plot of the Standardized Effects (response is Scrap (%), Alpha = .05) C BC ABD B A D 1614121086420 Term Standardized Effect 2.06 A Die Temp B Discharge of water C Delay D Volume of R&R Factor Name Pareto Chart of the Standardized Effects (response is Scrap (%), Alpha = .05) RELATIVE IMPACT OF CTQ FACTORS
  • 89. ONE FACTOR AT A TIME ANALYSIS 330250 16 15 14 13 12 107 18060 16 15 14 13 12 285260 Die Temp Mean Discharge of water Delay Volume of R&R Data Means
  • 90. TWO WAY INTERACTION PLOTS 107 285260 18 15 12 18 15 12 18 15 12 330250 18 15 12 18060 Die Temp Discharge of water Delay Volume of R&R 250 330 Temp Die 7 10 of water Discharge 60 180 Delay 260 285 of R&R Volume Data Means
  • 91. 10 910 15 8 50 20 100 7 150 Scrap (%) Discharge of water Delay Surface Plot of Scrap (%) vs Discharge of water, Delay Delay Dischargeofwater 1801601401201008060 10.0 9.5 9.0 8.5 8.0 7.5 7.0 > – – – – – < 10 10 12 12 14 14 16 16 18 18 20 20 (%) Scrap Contour Plotof Scrap(%) vs Discharge of water, Delay SURFACE PLOT FOR BC
  • 92. THREE WAY INTERACTION PLOT (ABD) 285 260 10 7 330250 Volume of R&R Discharge of water Die Temp 13.25 15.5010.25 9.50 17.50 18.7516.25 13.25
  • 93. Scrap (y) = 57.4 + 0.03 (Die Temp) - 0.71 (Discharge of water) + 0.03 (Delay) - 0.19 (Volume of R&R) - 0.003 (Discharge of water * Delay) + 7.13 (Die temp. * Discharge * Volume of R&R) Scrap (y) = 57.4 + 0.03 (A) - 0.71 (B) + 0.03 (C) - 0.19 (D) - 0.003 (B * C) + 7.13 (A * B * D) OPTIMIZATION EQUATION
  • 94. OPTIMIZATION BY RESPONSE OPTIMIZER Cur High Low0.99998 D Optimal d = 0.99998 Targ: 10.0 Scrap (% y = 10.0002 0.99998 Desirability Composite 260.0 285.0 60.0 180.0 7.0 10.0 250.0 330.0 Discharg Delay Volume oDie Temp [250.0] [9.9602] [136.3636] [281.7172]
  • 95. Response Optimization Parameters Goal Lower Target Upper Weight Import Scrap (%) Target 8 10 20 1 1 Starting Point Die Temp = 250 Discharge of = 7 Delay = 60 Volume of R& = 260 Solution Die Temp = 250 Discharge of = 9.96019 Delay = 136.364 Volume of R& = 281.717 Predicted Responses Scrap (%) = 10.0002 , desirability = 0.999982 Composite Desirability = 0.999982 OPTIMIZATION RESULTS
  • 96. Existing Feeding System with No Top Riser After Modification Feeding System with Top Riser Provided CHANGE IN RUNNER & RISER DESIGN
  • 97. Existing semi-automatic die casting Machine POKA-YOKE FOR M/C
  • 98. After improvement semi-automatic die casting Machine POKA-YOKE FOR M/C
  • 100. Four head Pads for sitting Full Head seat Provided For Head Sitting Existing Design Modified Design SEATING ARRANGEMENT (BOTTOM TOOL)
  • 101. Graphite Coating on Die-Pins Die-Pins with Metal Sticking 1. Pins sorted in the Stand KAIZEN FOR DIE - PINS
  • 102. 2. Cleaning of Pins by Buffing 3. Dipping of Pins in Caustic Soda solution for 2 hrs STANDARD CLEANING PROCEDURE
  • 103. 4. Dipping of cleaned pins in Graphite solution (1:2) for 50 mins 5. Pins after Cleaning and Graphite Coating
  • 104. Cell: H-273 Opistons Master Trainer: Shift: All Girish Kumar / Daljeet Singh Supervisor:DPS/SM/MIJ Status Date: 30.08.2010 51051 TARLOK SINGH To Be Trained for Temperature Checking of Holding Furnaces by 30 Sept. 51267 GURBAZ SINGH To be trained to shot blast and clean the die with shot blasting machine by 4 oct. 51807 PAWAN KUMAR to be trained to see temp by pyorometer by 30 sept. 51150 SUNIL KUMAR To be Trained on Full Self Inspection by 30 Sept. 51751 JASSA SINGH To be trained to do degassing and de slagging the molten metal by oct 5. 56771 GURMEET SINGH Trained the working on die casting machine 20 by 4 oct. DCM20 WASHINGMAN TEMPERATURE CHECKING SELFINSPECTION DCM9 DIEFITTER LINEHELPER/RING SHOTBLASTING COREMAKING Comments, Training Plans TRAINING MATRIX Capture Training Requirements Empty Square No training completed to date. and produces the quantity required by production targets. and is capable of training other team members. Knows and applies all job instructions and safety rules . . . and ensures quality according to work station job instructions.
  • 105. 23-Dec2-Dec11-Nov27-Oct7-Oct16-Sep26-Aug5-Aug15-Jul 26 24 22 20 18 16 14 12 10 Date Scrap Actual Fits Variable Trend Analysis Plot for Scrap Linear Trend Model Yt = 25.20 - 0.518610*t DOE Implementation (7% reduction in scrap) Poka-yoke of M/C (2%) Kaizen (graphite coating of Pin 2% ) Training of human resource (1%) Target Scrap Parameters are getting Out of control SCRAP REDUCTION ACHIEVED
  • 106. 5. CONTROL PHASE In this phase, process monitoring and corrective or preventive actions are documented and executed. Basically this phase tries to check and monitor the improved process and its parametric values. Major Tools Used Control Plan, X bar and R Chart for BT variation and p- Chart for overall scrap tracking.
  • 107. STEP-1 STEP-2 Final capability is re-defined Checking the scope of achieved improvements Validate the measuring system Do necessary Calibration Control Phase Transfer of technique among similar areas Sigma Calculator, Cpk Study Sustaining the improved process Check Lists, Audit Sheets, 5S, Poka-Yoke, TPM, Patrolling teams etc. Monitoring and revision of control documents and risk management Control Charts, SPC, Control Plan, FMEA, CUMSUM Charts Financial benefits reviewed Cost and Benefit Analysis PROPOSED FRAMEWORK FOR C-PHASE
  • 108. IMPROVED SIGMA LEVEL Production Results of Dec-2010 Total number of Machined parts 14079 Scrap type Nos. Bottom Thickness Defect 410 Blow Holes 320 Cold Lap 95 Depression 85 Hydrogen Porosity 40 Shrinkage 350 Defective Pin Hole 166 Total Scrap in December 1466 Nos. of Opportunities 7 DPMO 14875 Sigma Level of Process 3.67 Yield (%) 96.96
  • 109. IMPROVED Cpk 9.909.849.789.729.669.609.54 LSL USL LSL 9.5 Target * USL 9.9 Sample Mean 9.71617 Sample N 60 StDev (Within) 0.0417718 StDev (O v erall) 0.0421897 Process Data C p 1.60 C PL 1.72 C PU 1.47 C pk 1.47 Pp 1.58 PPL 1.71 PPU 1.45 Ppk 1.45 C pm * O v erall C apability Potential (Within) C apability PPM < LSL 0.00 PPM > USL 0.00 PPM Total 0.00 O bserv ed Performance PPM < LSL 0.11 PPM > USL 5.39 PPM Total 5.50 Exp. Within Performance PPM < LSL 0.15 PPM > USL 6.58 PPM Total 6.73 Exp. O v erall Performance Within Overall
  • 110. X BAR & R CHART FOR BT VARIATION 5:00 AM3:00 AM1:00 AM11:00 PM9:00 PM7:00 PM5:00 PM3:00 PM1:00 PM11:00 AM9:00 AM7:00 AM 1 0 .0 9 .8 9 .6 9 .4 T ime SampleMean __ X=9.72 UCL=9.9516 LCL=9.4884 1 21 11 0987654321 0 .8 0 .6 0 .4 0 .2 0 .0 Sample SampleRange _ R=0.4014 UCL=0.8488 LC L=0 11 1 Xbar-R Chart of BT
  • 111. p- CHART FOR OVERALL SCRAP REDUCTION 30th Dec 27th Dec 24th Dec 21st Dec 18th Dec 15th Dec 12th Dec 9th Dec 6th Dec 3rd Dec 0.20 0.18 0.16 0.14 0.12 0.10 0.08 0.06 Time individualpvalues _ X=0.1043 UCL=0.1380 LCL=0.0707 111 1 1 1 1 1 1 1 p-value (np/n) chart
  • 112. RESULT APPRAISAL Parameters Before After DMAIC DPMO 31,428 14,875 Cpk Index 0.21 1.47 Sigma Level 3.43 3.67 Scrap (%age) 21.7 10.4 Savings (Rs.) 30.7 Lakhs per Annum With mere 0.24 improvement in Sigma Level
  • 113. • In Improvement Phase, four casting process parameters (i.e. Volume of R&R, Die temperature, Discharge of cooling water and Delay with in process) have been optimized to bring a significant reduction of 7% in scrap. The machine‟s dimensional in-accuracy has been enhanced by altering the design of machine through Poka-yoke principles and this helped to achieve a net reduction of around 2% in scrap. The metal sticking on pins has been avoided by introducing a standard process of pin cleaning by using Kaizen rules of continues improvement and hence bring a further eduction of 2% in scrap. Then a proposed training schedule has reduced the scrap by around 1%. So overall 11% to 12% (approximately) reduction in scrap has been achieved in Improvement Phase of the case study.
  • 114. • Diversification of technology definitely increases the financial/non financial benefits. It leads to stability of system, which ultimately causes the customer satisfaction. After successful reduction of scrap for H-273 pistons, the same techniques and tools have been applied for other H-family pistons like H-749 and H-519 pistons that are similar as far as design, process parameters, casting machine and dies are concerned. • Total savings of around 30.7 lakhs per annum has been assessed after improving the sigma level by 0.24 only.
  • 115. 1. H-273 pistons: Average Scrap Saved per month = 400 (Approx.) Scrap Cost per Piston = 183 (Approx.) Total rejection cost saved per month = 400*183 = Rs 73,200/- Total rejection cost saved per year = 73,200*12 = Rs 8, 78,400/- 2. H-519 pistons: Average Scrap Saved per month = 600 (Approx.) Scrap Cost per Piston = 183 (Approx.) Total rejection cost saved per month = 600*183 = Rs 1, 09,800/- Total rejection cost saved per year = 73,200*12 = Rs 13, 17,600/- 3. H-749 pistons: Average Scrap Saved per month = 400 (Approx.) Scrap Cost per Piston = 183 (Approx.) Total rejection cost saved per month = 400*183 = Rs 73,200/- Total rejection cost saved per year = 73,200*12 = Rs 8, 78,400/- ECONOMIC ANALYSIS
  • 116. • The existing high scrap (21.7% approx.) has been defined as most serious issue as far as overall productivity of pistons is concerned in foundry and machine shop. • Casting scrap has been found primarily due to defects like; shrinkage, bottom thickness variation, blow holes, porosity, pin hole defect and cold lap. • Process parameters (SSVs) like; In-gate design, dimensional inaccuracy of machine, die temperature, die coating thickness, discharge of cooling water, metal sticking on pins, alloy temperature, shift dependency and operator skill have been measured as main reasons of above defects in piston castings. SUMMARY
  • 117. • Although during Measurement System Analysis (MSA), Gauge R&R of BT gauge has been found ok, yet Immersion Pyrometer (Temp. measuring device) has been found Biased and Vac-tester (Metal density checker) was coming out to be un-stable over a span of one month only. So both the measuring equipments were repaired and calibrated suitably before starting Analyse phase. • After analysis of all the eleven SSVs with appropriate statistical tools, following seven critical process parameters have emerged as responsible for high scrap. These are In-gate design (Volume of Runner & Riser), operator skill, discharge of cooling water, die temperature, delay time, metal sticking on pins and dimensional in accuracy of machine.
  • 118. • Earlier existing sigma level was 3.43 and after improvement it has been raised by 0.24 but even this has resulted in savings of around 30.7 lakhs per annum and is remarkable for a medium scale make-to-order foundry unit. • Overall scrap of foundry has been monitored by drawing shift wise p-chart and controlled up to 10.43% only, after Six Sigma case study. BT variation has also been monitored at casting machine itself by chalking out X bar & Range chart hourly. Cpk study has also been conducted by SQC operator after every 4 shifts for time to time process capability-checking of casting process with respect to bottom thickness variation.
  • 119. • This study has significantly reaffirmed the efficacy of Six Sigma strategy in Indian foundry industry to reduce scrap/waste from the operations, thus greatly improving the production efficiency. It also demystify the myth that Six-Sigma is only meant for big industries and require a lot of effort money and training etc. • „Project based‟ approach for Six Sigma implementation (rather then planning or investing in different phases of Six Sigma approach) is more motivating and helps a lot to demystify various fears on Six Sigma. CONCLUSIONS
  • 120. • Researchers have laid more emphasis on defining various tools and techniques of Six Sigma but „tool selection criterion‟ for each phase, as per the given constraints and environment, is not available to industries. • Due to lack of this vital information, usually wrong tools and techniques are chosen and so DMAIC project fails by moving in a wrong direction, with course of time. But this fear is eradicated because of step-wise proposed frameworks for each phase of DMAIC project, which also categorizes concerned tools. • The challenge for all organizations is to integrate Six Sigma into their core business processes and operations rather than managing it as a separate initiative.
  • 121. FUTURE SCOPE • Beside non-ferrous foundries, Six Sigma approach can be explored for ferrous foundries to bring breakthrough in rejections and increase yield per annum. • Six Sigma can also be used in energy intensive foundries, as it not only enhances productivity by process improvement but also it is a step to create „zero defect foundries‟ which indirectly leads to huge energy savings. • It can be implemented in green sand foundries specifically in sand re-use plants for not only to reduce the lead time of process but also to cast cost effective castings.
  • 122. • Apart from foundry industries, other manufacturing sectors like; forging, forming, welding and machining industries can also take benefit to lean their business operations. • Six Sigma should further be explored service sector like; hospitals, education institutes, banking, traffic etc in India. FUTURE SCOPE
  • 123. •Agarwal, R. and Bajaj, N. (2008), “Managing outsourcing process: applying Six Sigma”, Business Process Management Journal, Vol. 14, No. 6, pp. 829-37. •Aggogeri, F. and Gentili, E. (2008), “Six Sigma methodology: an effective tool for quality management”, International Journal of Manufacturing Technology and Management, Vol. 14, No 3/4, pp. 289-98. •Andersson, R., Eriksson, H. and Torstensson, H. (2006), “Similarities and differences between TQM, Six Sigma and lean”, The TQM Magazine, Vol. 18, No. 3, pp. 282-96. •Antony, J. (2002), “Design for Six Sigma: a breakthrough business improvement strategy for achieving competitive advantage”, Work Study, Vol. 51, No. 1, pp. 6-8. •Antony, J. and Banuelas, R. (2002), “Key ingredients for the effective implementation of Six Sigma program”, Measuring Business Excellence, Vol. 6, No. 4, pp. 20-7. •Antony, J. and Fergusson, C. (2004), “Six Sigma in the software industry: results from a pilot study”, Managerial Auditing Journal, Vol. 19, No. 8, pp. 1025-32. •Antony, J. (2004), “Six Sigma in the UK service organizations: results from a pilot survey”, Managerial Auditing Journal, Vol. 19, No. 8, pp. 1006-13. •Antony, J. (2006), “Six Sigma for service processes”, Business Process Management Journal, Vol. 12, No. 2, pp. 234-48. REFERENCES
  • 124. •Antony, J. (2007), “Six Sigma: a strategy for supporting innovation in pursuit of business excellence”, International Journal of Technology Management, Vol. 37, No 1/2, pp. 8-12. •Banuelas, R., Antony, J. and Brace, M. (2005), “An application of Six Sigma to reduce waste”, Quality and Reliability Engineering International, Vol. 21, pp. 553-70. •Bayle, P., Farrington, M., Sharp, B., Hild, C. and Sanders, D. (2001), “Illustration of Six Sigma assistance on a design project”, Quality Engineering, Vol. 13, No. 3, pp. 341-8. •Behara, R.S., Fontenot, G.F. and Gresham, A. (1995), “Customer satisfaction measurement and analysis using Six Sigma”, International Journal of Quality & Reliability Management, Vol. 12, No. 3, pp. 9-18. •Bhatnagar, J. and Pandey, A. (2005), “HR metrics: HR Six Sigma in Indian organizations”, Management and Labor, Vol. 30, No. 4, pp. 327-56. •Box, T. (2006), “Six Sigma quality: experiential learning”, S.A.M. Advanced Management Journal, Vol. 71, No. 1, pp. 20-3. •Brewer, P. (2004), “Six Sigma helps a company create a culture of accountability”, Journal of Organizational Excellence, Vol. 23, No. 3, pp. 45-59. •Brett, C. and Queen, P. (2005), “Streamlining enterprise records management with lean Six Sigma”, Information Management Journal, Vol. 39, No. 6, pp. 52-62. •Buch, K. and Tolentino, A. (2006), “Employee perceptions of the rewards associated with Six Sigma”, Journal of Organizational Change Management, Vol. 19, No. 3, pp. 356-64.
  • 125. •Carnell, M. and Lambert, J. (2000), “Organisational excellence through Six Sigma discipline”, Measuring Business Excellence, Vol. 4, No. 2, pp. 18-25. •Chakrabarty, A. and Tan, K. (2007), “The current state of Six Sigma application in services”, Managing Service Quality, Vol. 17, No. 2, pp. 194-208. •Chang, K. and Wang, F. (2008), “Applying Six Sigma methodology to collaborative forecasting”, International Journal of Advanced Manufacturing Technology, Vol. 39, No. 9/10, pp. 1033-44. •Das, N., Gauri, S. and Das, P. (2006), “Six Sigma principles in marketing: an application”, International Journal of Six Sigma and Competitive Advantage, Vol. 2, No. 3, pp. 243-62. •Davison, L. and Al-Shaghana, K. (2007), “The link between six sigma and quality culture: an empirical study”, Total Quality Management and Business Excellence, Vol. 18, No. 3, pp. 249-65. •De Feo, J. (2000), “Six Sigma: new opportunities for HR, new career growth for employees”, Employment Relations Today, Vol. 27, No. 2, pp. 1-6. •Does, R., Van Den Heuvel, J., De Mast, J. and Bisgaard, S. (2002), “Comparing non-manufacturing with traditional applications of Six Sigma”, Quality Engineering, Vol. 15, No. 1, pp. 177-82. •Fazzari, A. and Levitt, K. (2008), “Human resources as a strategic partner: sitting at the table with Six Sigma”, Human Resource Development Quarterly, Vol. 19, No. 2, pp. 171-80. •Feld, K. and Stone, W. (2002), “Using Six Sigma to change and measure improvement”, Performance Improvement, Vol. 41, No. 9, pp. 20-6.
  • 126. • Gijo, E. and Rao, T. (2005), “Six Sigma implementation – hurdles and more hurdles”, Total Quality Management and Business Excellence, Vol. 16, No. 6, pp. 721-5. •Goh, T.-N. and Xie, M. (2004), “Improving on the Six Sigma paradigm”, The TQM Magazine, Vol. 16, No. 4, pp. 235-40. •Goh, T.-N., Tang, L.-C., Lam, S.-W. and Gao, Y.-F. (2006), “Six Sigma: a SWOT analysis”, International Journal of Six Sigma and Competitive Advantage, Vol. 2, No. 3, pp. 233-42. •Hahn, G., Hill, W., Hoerl, R. and Zinkgraf, S. (1999), “The impact of Six Sigma improvement: a glimpse into the future of statistics”, The American Statistician, Vol. 53, No. 3, pp. 208-15. •Harry Mikel (1997), “The Vision of Six Sigma”, Tri Star Publishing, Phoenix, Arizona. Henderson, K. and Evans, J. (2000), “Successful implementation of Six Sigma: benchmarking General Electric Company”, Benchmarking: An International Journal, Vol. 7, No. 4, pp. 260-81. •Henderson, K. and Evans, J. (2000), “Successful implementation of Six Sigma: benchmarking General Electric Company”, Benchmarking: An International Journal, Vol. 7, No. 4, pp. 260-81. •Hendricks, C. and Kelbaugh, R. (1998), “Implementing Six Sigma at GE”, Journal for Quality and Participation, Vol. 21, No. 4, pp. 48-53. •Hild, C., Sanders, D. and Cooper, T. (2000), “Six Sigma on continuous processes: how and why it differs”, Quality Engineering, Vol. 13, No. 1, pp. 1-9. •Hiroshi Katayama, David Bennett, (1996), "Lean production in a changing competitive world: a Japanese perspective", International Journal of Operations & Production Management, Vol. 16, No. 2, pp.8-23.
  • 127. •Holtz, R. and Campbell, P. (2004), “Six Sigma: its implementation in Ford‟s facility management and maintenance functions”, Journal of Facilities Management, Vol. 2 No. 4, pp. 320-9. Hong, G. and Goh, T. (2003), “Six Sigma in software quality”, The TQM Magazine, Vol. 15, No. 6, pp. 364-73. •Ingle, S. and Roe, W. (2001), “Six Sigma black belt implementation”, The TQM Magazine, Vol. 13, No. 4, pp. 273-80. Johnson, A. (2002), “Six Sigma in R&D”, Research Technology Management, Vol. 45, No. 2, pp. 12- 16. •Jones, B. and Johnson, R.T. (2009), “Design and analysis for the Gaussian Process Model”, Quality & Reliability Engineering International, Vol. 25, pp. 515-24. Klefsjo¨, B., Wiklund, H. and Edgeman, R. (2001), “Six Sigma seen as a methodology for total quality management”, Measuring Business Excellence, Vol. 5, No. 1, pp. 31-5. •Kuei, C.-H. and Madu, C. (2003), “Customer-centric Six Sigma quality and reliability management”, International Journal of Quality & Reliability Management, Vol. 20, No. 8, pp. 954-64. •Kuthe, A.M. and Tharakan, B.D. (2009), “Application of ANN in Six Sigma DMADV and its comparison with regression analysis in view of a case study in a leading steel industry”, International Journal of Six Sigma and Competitive Advantage, Vol. 5, No.1, pp. 59-74. •Kwak, Y.H. and Anbari, F.T. (2006), “Benefits, obstacles and future of Six Sigma approach”, Technovation, Vol. 26, pp. 708-15. •McCarty, T. and Fisher, S. (2007), “Six Sigma: it is not what you think”, Journal of Corporate Real Estate, Vol. 9, No. 3, pp. 187-96. •Maleyeff, J. and Kaminsky, F. (2002), “Six Sigma and introductory statistics education”, Education þ Training, Vol. 44, No. 2, pp. 82-9.
  • 128. •Markarian, J. (2004), “Six Sigma: quality processing through statistical analysis”, Plastics, Additives and Compounding, Vol. 6, No. 4, pp. 28-31. •Marti, F. (2005), “Lean Six Sigma method in phase 1 clinical trials: a practical example”, Quality Assurance Journal, Vol. 9, No. 1, pp. 35-9. •Pepper, M.P.J. and Spedding, T.A. (2010) “The evolution of lean Six Sigma”, International Journal of Quality & Reliability Management, Vol. 27, No. 2, pp. 138-155. •Prasada G.P. and Reddy, V.V. (2010), “Process improvement using Six Sigma – a case study in small scale industry”, International Journal of Six Sigma and Competitive Advantage, Vol. 6, No.1/2, pp. 1-11. •Rao, K. and Rao, K. (2007), “Higher management education: should Six Sigma be added to the curriculum?”, International Journal of Six Sigma and Competitive Advantage, Vol. 3, No. 2, pp. 156-70. •Savolainen, T. and Haikonen, A. (2007), “Dynamics of organizational learning and continuous improvement in Six Sigma implementation”, The TQM Magazine, Vol. 19, No. 1, pp. 6-17. •Sehwail, L. and De Yong, C. (2003), “Six Sigma in health care”, Leadership in Health Services, Vol. 16, No. 4, pp. 1-5. •Snee, R.D. (2009), “Get moo-ving”, Six Sigma Forum Magazine, May, pp. 30-1. •Vote, D. and Huston, J. (2005), “Six Sigma approach to improve surgical site infections: a key variable”, American Journal of Infection Control, Vol. 33, No. 5, pp. 167-8. •Wright, J. and Basu, R. (2008), “Project management and Six Sigma: obtaining a fit”, International Journal of Six Sigma and Competitive Advantage, Vol. 4, No. 1, pp. 81-94.
  • 129. PUBLICATIONS OUT OF WORK (A) Papers ‘Published’ in International Journals 1. Singh, B.J. and Khanduja, D. (2010), DMAICT: A Roadmap to Quick Changeovers, International Journal of Six Sigma and Competitive Advantage, Vol.6, No.1/2, pp.31-52. 2. Singh, B.J. and Khanduja, D. (2010), SME Sector of Punjab (India): From Renaissance to Recession, International Journal of Indian Culture and Business Management, Vol. 3, No. 5, pp. 544-559. 3. Singh, B.J. and Khanduja, D. (2010), SMED: For Quick Changeovers in Foundry SMEs, International Journal of Productivity and Performance Management, Vol. 59, No. 1, pp.98-116. 4. Singh, B.J. and Khanduja, D. (2010), Synergy of Cross Functional Process Mapping and SMED for Quick Changeovers: A Case Study, International Journal of Science Technology & Management, Vol-2, No. 2, pp.107-116. 5. Singh, B.J. and Khanduja, D. (2011), Enigma of Six Sigma for Foundry SMEs in India: A Case Study, International Journal of Engineering Management and Economics, Vol. 2, No. 1, pp. 81-105. 6. Singh, B.J., Khanduja, D. and Singh, A. (2011), Demystifying MSA: A Structured Approach for Indian Foundry SMEs, International Journal of Quality and Innovation, Vol. 1, No. 3, pp. 217-236. 7. Singh, B.J. and Khanduja, D. (2011), Does Analysis Matter in Six Sigma?: A Case Study, International Journal of Data Analysis Techniques and Strategies, Vol. 3, No. 3, pp. 300-324. 8. Singh, B.J. and Khanduja, D. (2011), Introduce Quality Processes through DOE: A Case Study in Die Casting Foundry, International Journal of Productivity and Quality Management, Vol. 8, No. 4, pp. 373-397.
  • 130. 9. Singh, B.J. and Khanduja, D. (2011), Design for Set-ups: A Step towards Quick Changeovers in Foundries, International Journal of Sustainable Designs, Vol. 1, No. 4, pp. 402-422. 10. Singh, B.J. and Khanduja, D. (2012), Essentials of D-phase to Secure the Competitive Advantage through Six Sigma, International Journal of Business Excellence, Vol. 5, No. 1/2, pp. 31-51. 11. Singh, B.J. and Khanduja, D. (2012), Ambience of Six Sigma in Indian Foundry SMEs-An Empirical Investigation, International Journal of Six Sigma and Competitive Advantage, Vol. 7, No. 1, pp. 12-40. 12. Singh, B.J. and Khanduja, D. (2012), Risk Management in Complex Changeovers through CFMEA: An Empirical Investigation, International Journal of Industrial and System Engineering, Vol. 10, No. 4, pp. 470- 494. 13. Singh, B.J. and Khanduja, D. (2012), Scope of Six Sigma in Indian Foundry Operations, International Journal of Services and Operation Management, Vol. 13, No.1, pp.65-97. 14. Singh, B.J. and Bakshi, Y. (2012), Six Sigma for Sustainable Energy Management: A Case Study, International Journal of Science Technology & Management, Vol. 2, No. 2, pp. 60-72. 15. Singh, B.J. and Khanduja, D. (2012), Developing Operation Measurement Strategy during Six Sigma Implementation: A Foundry Case Study, International Journal of Advanced Operation Management, Vol.4, No. 4, pp. 323-349. 16.Singh, B.J. and Khanduja, D. (2014), “Perspectives of Control Phase to manage Six Sigma implements: A Foundry Case”, International Journal of Business Excellence (IJBEX), Vol.7, No.1, pp. 88-111.
  • 131. (B) Papers ‘Presented’ in International Conferences 1.Singh, B.J. and Khanduja, D. (2010), DMAIC(S): Incubates Core Competencies in Indian Foundry SMEs: An Empirical Study in State of Punjab, 2nd International Conference on Production and Industrial Engineering (CPIE-2010), NIT, Jalandhar, India, pp. 1443-53. 2.Singh, B.J. and Khanduja, D. (2011), Enhancing Competitiveness of Foundry SMEs through Design for Changeover (DFC): A Case Study, International Conference on Emerging Trends in Mechanical Engineering (ICETME-2011), Thapar University, Patiala, India, pp. 507-515. 3.Singh, B.J., Khanduja, D. and Jaglan, P. (2012), “Six Sigma for Sustainable Energy Management in Foundries: A Case Study”, SOM-2012 Conference, IIT, Delhi (Held in Dec 2012). 4.Bakshi, Y., Singh, B.J., Singh, S.S. and Singla, R. (2012), “Performance Optimization of Backup Power Systems through Six Sigma: A Case Study”, IETET-2012, GITA Institutes, Kurukshetra (Held in Nov 2012) 5.Sodhi, H.S., Singh, B.J. and Khanduja, D. (2012), “Behavior Study of Cutting Parameters on Material Removal Rate for a Non-Ferrous Material While Turning on a CNC Turning Center”, IETET-2012, Kurukshetra (Held in Nov 2012). 6.Singh, B.J. and Khanduja, D. (2013), “Leveraging Six Sigma Disciplines to Reduce Scrap in Indian Foundry SMEs”, 26th SEAANZ Conference, Sydney (NSW), Australia, pp. 6-24. (Held in July-2013)
  • 132. (C) Papers ‘Presented’ in National Conferences 1. Singh, B.J. and Khanduja, D. (2009), Set-Up Time Reduction for Higher Productivity in Indian Foundries, Indian Institute of Foundry Men (IIF) organized by Chandigarh Chapter at Ludhiana, pp. 51-57. 2. Singh, B.J. and Khanduja, D. (2010), Exploring Set-up Management in Indian Foundries, Advances in Mechanical Engineering (AME-2010), Organized by B.B.S.B.C.E. Fatehgarh Sahib, Punjab, pp. 70-76. 3. Singh, B.J., Bakshi, Y. and Kaushik, P. (2011), Role of Six Sigma in Engineering Institutes: A Case Study, 41st ISTE Convention, India, pp. 7-20. 4. Sachin, Singh, B.J. and Dhull, V. (2013), “Six Sigma: From Concept to Implementation”, AMMM-2013 National Conference, Haryana.
  • 133. THANKS