1. Chapter 1. INTRODUCTION
1.1 Introduction
Up until the 1950s, businesses around the world functioned in pretty much the same way:
they focused on mass production, on quantity. After World War II, W. Edwards Deming
helped the Japanese to revitalize their industries by focusing on quality. His approach became
known as Total Quality Management (TQM)—a term that Deming never liked. He just saw
this as a more intelligent way to get better results, an approach that reduced costs, improved
customer satisfaction, and facilitated greater growth and profitability.
Because of the phenomenal success of the Japanese industries, U.S. businesses started to take
a serious look at TQM. By the 1980s, many business leaders began to see Deming’s point
that the use of statistics, teamwork, and process control would lead to continuous
improvement, higher quality, and lower costs. Those companies that adopted TQM
underwent major changes: quality became the focus and the name of the game. By the mid-
1980s, however, some in the business community had become impatient and disenchanted
with TQM. Continuous improvement is worthwhile, of course, but it wasn’t producing the
great financial results that many had expected. The solution to this was Six Sigma. This was
not a rejection of TQM, but a refinement of it to introduce a methodology for achieving
results more systematically.
1.2 Background
Six Sigma methodology was first espoused by Motorola in the mid 1980s. (Antony &
Banuelas, 2002; Wiklund & Wiklund, 2002). At that time, Motorola was facing Japanese
competition in the electronics industry and needed to make drastic improvements in its levels
of quality (Harry and Schroeder, 2000; Linderman et al., 2003). A Six Sigma initiative ,which
is originally focused on manufacturing process and product quality (Harry & Schroeder,
2000), is also designed to change the culture in an organization through breakthrough
improvement in all aspects of the business (Breyfogle III et al., 2001, p.32). The Six Sigma
architects at Motorola focused on making improvements in all operations within a process—
thus producing results far more rapidly and effectively (Harry & Schroeder, 2000).
The successful implementation of the Six Sigma program in Motorola led to huge benefits.
Motorola recorded a reduction in defects and manufacturing time, and also began to reap
financial rewards. Within four years, the Six Sigma program had saved the company $2.2
billion (Harry & Schroeder, 2000). The crowning achievement was being recognized with the
Malcolm Baldrige National Quality Award (Breyfegle III et al., 2001; Wiklund & Wiklund,
2002).
IBM, SONY, and Allied Signal successfully followed Motorola in implementing Six Sigma.
Allied Signal began its Six Sigma activities in the early 1990s, It successfully attained
savings of US$2 billion during a five-year period (Klefsjö et al., 2001). Sooner, the
impressive results obtained by Allied Sigma induced General Electric (GE) to undertake a
thorough implementation of the Six Sigma program in 1995 (Pande et al., 2000) as a
corporate initiative to improve net profits and operating margin (Hendricks and Kelbaugh,
1998). The 1999 annual report of GE showed that the implementation produced more than
US$2 billion in benefit (Slater, 2001; Coronado & Antony, 2002, Raisinghani et al., 2005).
As a result, the impressive benefits of implementing Six Sigma programs in Motorola, Allied
Signal, and GE led the Six Sigma methodology being widely adopted by industries
throughout the world. American Express, Ford, Honda, and Samsung have all applied the
methodology (Klefsjö et al., 2001; Sandholm & Sorqvist, 2002; Yun and Chua, 2002). The
2. Six Sigma has become the most prominent trend in quality management (Sandholm &
Sorqvist, 2002; Yang, 2004) not only for manufacturing and service industries, but also for
non-profit organizations and government institutes.
The GE-six sigma program and the Motorola Six Sigma program did have some differences.
Whereas Six Sigma activities in Motorola had focused on product quality and the
manufacturing process, the GE-six sigma program extended the improvement activities to
cover all key processes related to customer satisfaction.
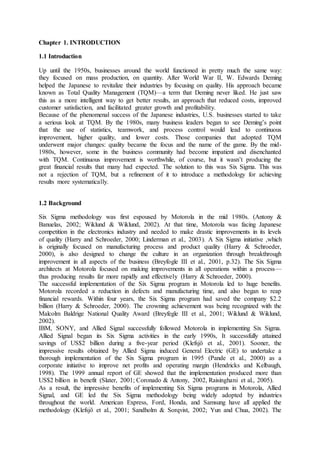
1.3 Statistical Theory Behind Six Sigma
The Six Sigma concept has derived from statistical distribution known as “standard normal
distribution” illustrated by symmetrical bell-shaped curve. “Theoretically this bell-shaped
curve has been extensively studied and has been proven very useful as numerous natural
continuous phenomena seem to follow it or can be approximated by it.”1 The curve
represents the total “population” (whatever is measuring) by the infinite series of segments in
its both directions. Each segment has been named “Sigma” which symbolize by “σ” (Greece
letter) and is deviation from “mean” (μ: average or peak of the bell-shaped curve) in
Statistical terms. The considerable part of the curve is the range between ̶ 3σ and +3σ due to
covering 99.73% of the population where as Six Sigma considers the range between ̶ 6σ and
+6σ which covers 99.9997% of the data. The contraction of the curve illustrates that the main
population is cumulatively around average and in specification limits which presents the
excellence performance. Graph.1 illustrate that only 0.0003% of data are out of range.
Fig 1.1 Evolvement from 3σ to 6σ reduces the number of defects to 3.4 per million
opportunities.
3. Chapter 2. CONCEPT OF SIX SIGMA
2.1 Six sigma principles
The aim of Six Sigma is to improve the quality near perfection which means 3.4 defects per
million opportunities (DPMO), to maximize the customer satisfaction and business benefits.
This goal will occur when the sigma level is 6. For instance, at 3 sigma level 93.3% of items
meet requirements and are without any defects (yield) where 66,800 defects occur per million
opportunities (DPMO), but improving the performance to 5 sigma level reduces the number
of defects to 320 items per million opportunities. Therefore, any companies work on Six
Sigma should strive for the goal 6 sigma level performance. Table.1 illustrates the rate of
defects per million opportunities in different sigma levels.
Yield DPMO Sigma level
30.9 690,000 1
69.2 308,000 2
93.4 66,800 3
99.4 6,210 4
99.98 320 5
99.9997 3.4 6
Table 2.1. Overview of sigma levels and DPMO
In order to obtain high quality of 6 sigma level at the low price, Six Sigma uses the statistical
metrics and techniques to measure the processes performance and rate the defects, and
teaches involved people appropriate tools to analyze their performance and improve the way
of business.
4. 2.2 The basic components of six sigma
There are three basic concepts that are common to all businesses that Six Sigma addresses:
processes, defects, and variation.
2.2.1 Process
A fundamental concept of Six Sigma is process. A process is any set of repetitive steps—in
any manufacturing, services, or transactional environment to achieve some result. There are
processes for all core business activities and functions. They are the steps that the people in
an organization go through to do their jobs and deliver products or services. Understanding
them and making them work at the highest level possible is the goal of Six Sigma.
2.2.2 Defects
Part of the Six Sigma methodology includes measuring a process in terms of defects. Six
Sigma helps eliminate those defects so that the organisation can consistently and profitably
produce and deliver products or services that meet and exceed customers’ expectations. It’s
not unusual for a small business to have a minimum of 10 percent of its net income being
wasted by process defects. In other words, those defects are money wasted!
2.2.3 Variation
The Six Sigma methodology reduces variations in business processes. It seems obvious, but
organisations can’t consistently produce a high quality product or service (their output) if
they have variations in their processes. Basically, they have achieved six sigma when their
processes deliver only 3.4 defects per million opportunities (DPMO). For example, this
would mean that out of one million bags checked in at the airport luggage counter, only 3.4
would be lost. In other words, their processes are working almost perfectly. Of course, this is
very difficult to do, but they can begin to approach it (or at least get a lot better) by
implementing the DMAIC steps. The fact is that most businesses operate at three to four
sigma quality levels, which translates to about 25 percent of their revenue lost to defects in
their processes. Those defects represent waste, rework, higher costs, and dissatisfied
customers.
5. 2.3 Six Sigma Methodologies
Six Sigma has two key methods (Kwak and Anbari, 2006):
• DMAIC process (Define, measure, analyze, improve, control).
• DFSS methodology (Design for Six Sigma)
DMAIC is for existing processes which requires significant improvement due to falling
below expected quality specification (Forbes and Ahmed, 2009).
DFSS as a systematic methodology is for designing new products and/or process at Six
Sigma quality levels (Kwak and Anbari, 2006).
2.3.1 DMAIC methodology and its main steps are explained by (Stamatis, 2003) and these
steps are summarized below.
2.3.1.1 Define, first stages of DMAIC is for team forming, determining the responsibilities of
team members, establishing team goals and review the process steps, basic steps are
(Stamatis, 2003):
a. Define the problem: Problem should be based on measurable data and specific
b. Identify the customer: Identification of the customer includes the analyses of problem
impacts and a detailed analysis of COPQ (Cost of poor quality).
c. Identify CTQ characteristics: Identification of CTQ (Critical to quality) is the
determination of the important issues for customers.
d. Map the process: A visual representation of the existing process should be prepared in
order to look beyond functional activities and core process.
e. Scoping the project: Reduction of project scope is the main focus of this step.
Determination of specific project issues, a problem statement and brainstorm session are the
purposes of scoping the project.
2.3.1.2 Measure, second stage of DMAIC, is for having a plan for data collection, preparing
a sufficient data sample and preliminary analysis of this sample. In this stage, Six Sigma team
analyzes current performance through valid data in order to understand improvement
opportunities and identify KPIV (Key process input variables) , basic steps are (Stamatis,
2003):
a. Identify measurement and variation: Types, sources, causes and detailed impacts of
variation on process should be defined by the establishment of measurement.
b. Determine data type: Six Sigma team should define data types that will be collected. The
main focus is to decide what kind of data and knowledge required for process improvement.
6. c. Develop a data collection plan: Data collection plan provides data collection responsible
and data displaying formats.
d. Perform measurement system analysis: Graphical and baseline analysis should be
performed through MSA (Measurement System Analysis) in order to be sure that data
collection plan works accurately and collected data are confidential.
e. Collect the data: Collected data should be proper and provide enough information to Six
Sigma team in order to determine root causes of the problem.
2.3.1.3Analyze, thirds stages of DMAIC is for finding the root causes of defects, right
approach styles to data and improvement opportunities, basic steps are (Stamatis, 2003):
a. Perform capability analysis: Baseline capability should be realized in order to understand
performance level of the process.
b. Select analysis tools: Six Sigma team should control the graphical analysis and decide
which tools will be used in order to find the details of variation and performance.
c. Apply graphical analysis tools: A visual performance indications should be realized
through graphical analysis techniques.
d. Identify sources of variation: Statistical tools are used in order to define the variations
sources. The main focus in this step is to find and repair significant variations.
2.3.1.4 Improve, fourth stages of DMAIC, is for designing, implementing and validating the
improvements. This stage includes FMEA (Failure Mode and Effect Analysis), a preliminary
cost/benefit analysis and preparation of necessary actions, basic steps are (Stamatis, 2003):
a. Generate improvement alternatives: Focus of this step is to define, generate and evaluate
the possible improvements.
b. Create a "should be" process map: Mapping of best improvement opportunities should be
realized by Six Sigma team.
c. Conduct FMEA (Failure Mode and Effect Analysis): This analysis is used in order to make
the situation analysis of “before the failure”.
d. Perform a cost/benefit analysis: Cost/Benefit analysis is the comparison between expected
benefits and improvements costs.
e. Conduct a pilot implementation: The implementation of planned improvements should be
conducted on a small scale.
f. Validate improvement: Sigma values before and after “Improve Stage” should be compared
in order to understand the effect of process improvement.
7. 2.3.1.5 Control, last stage of DMAIC, is for the institutionalization of process/product
improvements and following performance. This is a transition phase of process from Six
Sigma team to original executers under detailed control plan, basic steps are (Stamatis, 2003):
a. Mistake-proofing: Remove the error possibilities is the main focus of this step. It is
important to remove errors before provoking defects in the process.
b. Long-term MSA (Measurement System Analysis): Data collection should be distributed
over the long-term in order to measure and monitor inputs/outputs of process improvements
through Measurement System Analysis.
2.3.2 Design For Six Sigma: Due to being relatively new, DFSS has more than one road-
map in use (Sleeper, 2005). Some of them are:
i. ICOV (Identify, Characterize, Optimize, and Verify) (El-Haik and YANG, 2003).
ii. CDOV (Concept, Design, Optimize, Verify) (Creveling et al., 2003).
iii. DMADV (Define, Measure, Analyze, Design, Verify) (Brue and Launsby, 2003).
iv. PIDOV (Plan, Identify, Design, Optimize, and Validate) (Brue and Launsby, 2003).
2.3.2.1PIDOV:
PIDOV is summarized as follows:
a. Plan: Developing goals and metrics for Six Sigma projects considering VOC (Voice of the
Customer) is the main focus of this phase. DFSS team should decide which ideas will be
developed and how they will be structured.
b. Identify: Identification of product concepts which can satisfy customer requirements is the
main purpose. Focusing on VOC (Voice of the Customer) by the way right tools is the
prerequisite of success.
c. Design: New products and process should be designed by engineers based on functions and
statistics. Drawings and specifications has to be developed in this step.
d. Optimize: Creating a balance between quality and cost is the main issue. Statistical
methods are used in this phase in order to make products and processes less sensitive to
variations.
e. Validate: Data should be collected from prototypes and appropriate tests should be
conducted in order to validate customer requirements. The balance between quality and cost
has to be controlled through Statistical Process Control tools and methods.
8. Appropriate and applicable charts (statistical process control): Graphical representation
of process should be realized in order to control processes with lower and upper limits.
Reaction plan: That is a detailed plan of controlling issues and necessary actions if the
revised process is no longer under control.
The new or revised SOPs (standard operating procedures): Six Sigma team should
periodically revise the existing documents and procedures in order to reflect
improvements results.
If the existing products/processes have inherently defective designs, DMAIC methods cannot
be successful to repair them. However, DFSS can be successful on new products/process
developments and meet customer expectations for performance, quality, reliability and cost
(Sleeper, 2005).
2.4 Some key views on Six Sigma
Several prominent researchers have expressed views on Six Sigma.
* Hahn et al. (1999) emphasized that Six Sigma improvement is a highly disciplined and
statistically based approach for removing defects from products, processes, and transactions,
involving everyone in the corporation.
* Harry & Schroeder (2000) emphasized that Six Sigma provides maximum value to
companies—in the form of increased profits and maximum value to the consumer through
high-quality products or service at the lowest possible cost.
* Harry & Schroeder (2000) also concluded that Six-Sigma is a business strategy and
philosophy built around the concept that companies can gain a competitive edge by reducing
defects in their industrial and commercial processes.
* Pande et al. (2000) commented that Six Sigma is a comprehensive and flexible system for
achieving, sustaining, and maximizing business success. It is driven by close understanding
of customers’ needs and disciplined use of facts, data, and statistical analysis.
* Pearson (2001) described Six Sigma as a program that combines the most effective
statistical and non-statistical methods to make overall business improvements.
* Slater (2001) stated that the Six Sigma approach provides a very specific control program
with control techniques that ensure continuation of improved processes.
* Lucas (2002) described Six Sigma as a statistical business system and a functional
methodology for disciplined quality improvement that achieves successful outcomes.
* Treichler et al. (2002) concluded that Six Sigma is a highly disciplined process that helps
organizations to focus on developing and delivering near-perfect products and services. It is
also, in Treichlers’ (2002) view, a change-acceleration process that focuses on pursuing
success and the rapid adoption of change.
9. 2.5 Belt system
In terms of implementation, it can be said that this is a “top-down” approach from top
manager to entire involved people. Six Sigma stresses the importance of people involvement;
therefore it is essential to define the involved people and their roles and responsibilities in
any Six Sigma project from top to down. Those roles and responsibilities are defined as
below:
1. Executive leadership: This encourages and drives force behind the scene to adopt Six
Sigma in organization since the first day.
2. Executive champion: The CEO appoints this to support and supervise the whole mission.
Executive champion has to aware everyone who is involved in implementing Six Sigma.
3. Deployment champions: They provide Six Sigma project with resources, work and
commitment, set the goals and ensure their alignment with the organization priorities.
They may administrate the project and take the logistics roles.
4. Project champions: They are the process owners who support and supervise project and
find the necessary personnel to do the job.
5. Master Black Belts: They are the Six Sigma project managers and the most responsible
people for fundamental changes. They are usually outside consultants but work full-time
as inside experts during the implementation. They are the coaches who help champions
to choose the appropriate people and projects and teach Black Belts Six Sigma main
points.
6. Black Belts: “The Black Belts are the people who really work. They are the ones, apart
from Master Black Belts, who work full-time on the job. They are the key to the whole
projects, the true leaders of Six Sigma.”
7. Green Belts: Their job is similar to Black Belts but they work mainly on their real job in
the organization and part-time on Six Sigma, support the Black Belts and provide their
needs.
As it explained above, Six Sigma offers the certification program and certifies the
participants as Green Belts, Black Belts, and Champions and so on. This is the elaborate
training which is arranged and organized in details to teach Six Sigma tools and skills and
their suitability, priorities, scopes and applications. The training scheme can be divided into
three different categories, which considers specific roles and responsibilities. First is the
Champions program which lasts one day to give the comprehensive perspective of Six Sigma
principles, determine the champions’ roles and responsibilities to drive the Six Sigma project,
and to identify the expected outcomes of the project. Second is the Black Belts program
which takes 4 weeks of training and can be spread over couple of months so after each week
the trainees can practice the learning items at their workplace. Third is the Green Belts
program which can be half of the Black Belts. Green Belts also can be trained by the Black
Belts. The certified Black Belts are supposed to be able to utilize Six Sigma tools and skills
such as statistics and design of experiments in order to measure, analyze, improve and control
the processes in a way that meet customer satisfaction and financial benefits. However, it is
10. of paramount importance to link the appropriate people to the appropriate roles and involve
them in right projects and teach them the right tools.
Due to belt system, team members use the same technical terms and it makes the deployment
and implementation of Six Sigma much easier within the company.
2.6 Deploying & Implementation
(Hahn, 2005) prepared twenty key lessons learned from the deployment of Six Sigma in
General Electric. These tips are the mix of published articles and his experiences, these key
lessons are (Hahn, 2005):
• The time is right: Six Sigma is very popular since its concept includes the combination of
competitive pressures and management recognition of Cost of Poor Quality (COPQ).
• The enthusiastic commitment of top management is essential: Mostly, quality improvement
have been applied by lower or middle managers. However, Six Sigma are introduced by
executive managers of the companies.
• Develop an infrastructure: Six Sigma needs a formal infrastructure which should include the
definitions of key objectives & responsibilities, development of budget and measurement
techniques.
• Commit top people: Implementers of Six Sigma should be imaginative and persuasive
employers who are also the candidates for management positions.
• Invest in relevant hands-on training: The engagement of knowledgeable trainer to training
processes is a prerequisite for the success of
• Select initial projects to build credibility rapidly: Selection of right projects for the
beginning of Six Sigma increases the momentum within company.
• Make it all pervasive, and involve everybody: Involvement of everybody to Six Sigma
implementation makes faster the integration.
• Emphasize Design for Six Sigma (DFSS): DFSS is very vital since the process design has a
fundamental role on the product quality.
• Do not forget design for reliability: Design for reliability which aims to increase long-term
quality is very important
• Focus on the entire system: Even though, Six Sigma focuses on specific CTQs at the
beginning, the main focus should be on the entire system and overall performance
improvement.
11. • Emphasize customer critical to quality characteristics (CTQs): External improvements
which target customer CTQs is important as well as internal improvements.
• Include commercial quality improvement: Quality improvement should be extended from
transactional to commercial quality.
• Recognize all savings: Recognition of all savings is very important in order to see the real
financial effects of Six Sigma.
• Customize to meet business needs: Six Sigma is applicable to all processes. However, right
tools for specific process and proper planning for different kind of process are very vital.
• Consider the variability as well as the mean: Reducing variations is one of the main goals of
Six Sigma in addition to improving the mean.
• Plan to get the right data: Continuous data collection and procurement system for entire
system is better than data collection for specific problems.
• Beware of dogmatism: Adaptation of Six Sigma to the specific problems and business areas
is mostly difficult due to the dogmatism of the project team. The main goal is to make
considerable improvements within the entire system not to use some specific tools.
• Avoid non-essential bureaucracy: Avoiding unnecessary bureaucracy in Six Sigma
implementation can maximize the effects of continuous process improvement.
• Keep the toolbox vital: The advantage of Six Sigma comes from the practical usage of
different tools and technical concepts into a process. Some original tools can be extracted
from process improvement and some not included originally can be added.
• Expect Six Sigma to become a more silent partner: Continuous and broader applications can
increase the momentum of Six Sigma within the company. Also, Six Sigma should be
evaluated as an ordinary part of work process.
12. 2.7 Common Concerns About Implementing Six Sigma
2.7.1 Fear of Change.
It makes sense that if an organisation is going to improve the way their business functions
they are going to have to make some changes, some of them major. But, many people are
afraid of change. Nevertheless, while they might feel comfortable doing the same things
every day, this means they will just keep making the same mistakes over and over. In other
words, if they are not willing to change how they do some things in their business, they won’t
be able to improve their business.
2.7.2 Fear of Commitment.
Again, this is a common problem for many people. It’s true that to reach the gains that Six
Sigma can produce, they have to be dedicated to it. Six Sigma requires a high level of
commitment.
2.7.3 Increased Cost.
Implementing Six Sigma or any new program is going to cost money and the organisation is
not sure it will be worth the cost. This is a reasonable concern, but if they do it properly, they
can be sure that they will decrease, not increase, their costs.
2.7.4 Wasted Time Without Results.
Maybe they’ve tried other programs to make their operations more efficient and after a while
these just didn’t work. This is valid, but this shouldn’t be a problem with Six Sigma. It’s
aimed at specific problems with a specific problem-solving methodology, with the goal of
eliminating forever that problem.
2.8 Objectives of Six Sigma
• Identify hidden waste and costs
• Identify and eliminate defects
• Increase profit margins
• Increase customer satisfaction
• Increase employees’ satisfaction and level of commitment
• Grow and expand business
2.9 Advantages and Disadvantages of six sigma
2.9.1 Advantages
One of the biggest advantages of using Six Sigma lies in the methodology statements
which assert that "no project shall be approved if a bottom line impact has not been
clearly defined". With goals being unmistakably defined, there is less vagueness to deal
with and decisions are implemented that are derived from statistical data and research,
13. not haphazard assumptions.
Other benefits include:
• Emphasis on achieving attainable goals
• Implementing projects that will produce results
• Effective use of scientific techniques and precise tools
• Infuses upper management with passion and dedication
• Integrated concepts benefiting employees and customers
• Using information that has real world meaning
In addition, improvements are measured using statistical ratios that can be empirically
modified to reflect financial results. Financial results mean an increase in shareholders,
which further benefits an organization and its employees. A recent trend reveals that
many companies are being requested by shareholders to use the Six Sigma system prior
to purchasing stock in their company.
2.9.2 Disadvantages
While Six Sigma is rapidly spreading throughout a variety of industries and
organizations, some limitations can be said to exist within its procedures and
measurements. Projects which are directed are selected by organizations subjectively
rather than objectively, which means that goals may be mistakenly thought of as
attainable and favorable when in fact they may eventually be a waste of resources and
time.
Also, researchers investigating the trend have noticed that some individuals calling
themselves "experts" in Six Sigma methodology actually do not comprehend the
techniques and complex tools necessary to effectively implement the quality control
process in an organization. Thus, these companies hiring "experts" are being treated to a
substandard version of the principles which will do nothing to help their company and
only lend a warped perspective of what it is supposed to do.
In order to keep this from happening further, the Six Sigma community must come
together and stand up for strict training and certification standards to be issued throughout
14. 2.10 Common myths about six sigma
Here are some of the most common myths about Six Sigma:
• It applies only to large companies.
• It only works in manufacturing settings. Although it’s true that Six Sigma started in
manufacturing, it has been applied successfully in all segments of business—banking,
healthcare, the military, fast food chains, airlines, hotels, retail stores, and on and on and on.
• You must hire an outside consultant.
• You need experts (i.e., “Black Belts”), to make it work.
• Six Sigma is a complicated, statistical methodology that the ordinary person is incapable of
understanding.
• Six Sigma doesn’t include customer requirements. That’s totally false. Every Six Sigma
project starts with the customers, with determining the factors that are critical to the
customer. Those factors focus the project.
• Six Sigma is repackaged Total Quality Management. Quality programs are valuable in that
they can create a quality perspective and culture. But Six Sigma fixes identifiable, chronic
problems that directly impact your bottom line. Six Sigma projects are selected to reduce or
eliminate waste, which translates into lower costs, happier customers and real money for the
bottom line. Six Sigma is not theory. It defines, measures, analyzes, improves, and controls
the vital few processes that matter most, to tie quality improvement directly to bottom-line
results.
• Six Sigma is an accounting game without real savings.
• Six Sigma is just training.
• Six Sigma is a “magic pill” to fix problems with little effort.
15. Chapter 3.APPLICATION OF SIX SIGMA
3.1 Applying the DMAIC Steps to Process Improvement Projects
“Define, Measure, Analyze, Improve, Control” is the Roadmap to Improving Processes
fig 3.1 breaking down of process into three basic elements
Project managers, in just about any industry, are faced with the challenge of improving the
efficiency and productivity of their businesses. To do this, they need to understand the best
methodology and tools to study and analyze processes correctly. After all, to improve results,
the best approach is to improve the process that gives those results.
So, it is imperative for project managers to have a rudimentary understanding of process
thinking when managing improvement efforts. As shown in the graph above, a process can be
broken down into three basic elements: the inputs to the process, the process under study and
the outputs from the process. The concept of improvement is quite simple; to improve the
outputs of a process, you simply improve the inputs and the process itself. To improve the
output (also called the “Y” or the “Key Measure”), identify, measure and improve the inputs
and process metrics (also known as the “X’s”). Focusing on the results, the output Y
measures instead of the X’s is an after-the-fact, reactive, expensive and inefficient approach
to improving results. The concept that Y is a function of X (Y=f(X1, X2, …Xn) is at the core
of the: Define, Measure, Analyze, Improve and Control; also known as DMAIC steps.
16. fig 3.2 DMAIC process cycle
The roadmap for improving processes and key measures of a business is a straightforward,
easy to understand set of five steps. DMAIC is an iterative process that gives structure and
guidance to improving processes and productivity in the workplace. Project managers and Six
Sigma practitioners apply the DMAIC steps and appropriate analysis tools under each step, to
analyze and improve key metrics of a business. Metrics are established, variation is studied
and reduced and processes are improved and optimized. The result is improved performance,
fewer errors and increased efficiency and productivity.
The DMAIC steps are the true backbone of any process improvement initiative. The steps
make sense, they are easy to understand and they are logical in their sequence. The steps
allow a team to adequately scope the problem, measure the current performance, analyze the
root causes of problems and inefficiency, test and verify improvement recommendations and
then implement changes for sustainability over the long haul. Process improvement projects
are the norm these days. Improving key measures is something every project manager is
going to be faced with sooner or later; therefore, a project manager should be skilled in the art
of applying the DMAIC steps to improve results.
The DMAIC steps work because they are understandable and make sense. These steps can be
applied to any process, any industry, any company to help guide a process improvement
team. Before they can be applied, however, the project leader should lead his or her team to
scope the problem, perhaps using a Supplier, Input, Process, Output, and Customer or SIPOC
diagram as shown below. Using the SIPOC tool can help project managers scope the
problem, think in terms of processes, and help the team pinpoint what and where to measure.
The SIPOC tool helps link metrics to the inputs, the process, and the outputs thus allowing
for the Y=f(X) thinking.
17. fig 3.3 SIPOC diagram (Supplier, Input, Process, Output and Customer)
3.1.1 DEFINE
Essentially the purpose of the Define step is to set project up for success. Project managers
are familiar with the things that need to be done when starting off a project. Essential project
elements are accomplished in this step, such as:
Attaining sponsorship for the project
Establishing the project charter and appropriate scope
Identifying stakeholders and team members
Establishing team ground rules
Planning and conducting a successful kickoff meeting
In addition to the normal project deliverables listed above, for a process improvement effort,
the project manager would facilitate his or her team in developing an “As-Is” process map.
This will help the team not only get on the same page in terms of the process, but also will
help the team identify problematic steps in the process. Process maps, or Deployment maps ,
can also be useful in identifying non-value added steps and can be vital in determining
process measures.
Lastly, the team may require some basic training on the application of the DMAIC steps so
that everyone knows what to do and when to do it.
18. 3.1.2 MEASURE
The Measure step is often a step which, unfortunately, is skimmed over by most teams. One
of the biggest mistakes made when trying to improve results is to make decisions based on
“gut” feeling, intuition or anecdotal information. Instead, what is imperative is to base
decisions on facts and data and that is the main goal of the measure step. In the Measure step,
the team should:
Identify and operationally define key metrics
Develop a data collection plan
Conduct a measurement system analysis to verify that the data is accurate
Stratify the data
Establish baseline charts
Make charts and graphs to help the team better understand what the process is currently
delivering in terms of processing times, errors or defects
3.1.3 ANALYZE
The Analyze step is all about getting to the root cause of the problem. Too often when trying
to solve a problem, people or teams tend to focus on a symptom as opposed to the true root
cause of the problem. The tools and techniques in the Analyze step lead project teams to
gather clues for improvement and ascertain what the root cause, or causes, are that are the
most important drivers. The Y is a function of X formula is at play in the Analyze step. A
team will analyze the process, perhaps using value-added analysis, statistical analysis, or
maybe a fishbone chart, a cause and effect diagram, to get to what they think are the root
causes. Then the team would gather data on the root causes to determine if there is a cause
and effect relationship with the problem. Verifying cause and effect is a crucial step in the
Analyze phase; a step which many people, unfortunately, skip or simply take for granted
based on their opinions.
3.1.4 IMPROVE
Once a team moves through the Define, Measure and Analyze steps, they are now ready to
use what they’ve learned about the process to be innovative when solving the problem at
hand. Improve is the step where creative solutions to existing problems can be developed and
tested, using various experiment or piloting techniques. The key deliverable in the Improve
step is verifiable improvement through measurement. The best ideas for improvement, based
on what was learned in Measure and Analyze, are tested and implemented on a limited basis
to determine if there is statistical evidence of sustained improvement. Once a team improves
a process, the results should become quite clear on a control chart. When stakeholders can see
19. the proof of improved performance, they will be more likely to accept and actually
implement the team’s recommendations. Improve is about taking the emotion out of decision
making. Improve is about verification and validation of recommendations. Often times, teams
make the mistake of thinking they “know” what will work. Thus, they blindly implement
what they think is the best solution without proper testing. The result, more times than not, is
that there is no measurable or sustainable improvement.
3.1.5 CONTROL
The real strength of the DMAIC steps is the Control step. Too often, teams do a lot of hard
work, actually improve the process and results, and then implementation of the improved
process doesn’t go smoothly. There is pressure to move on; time isn’t spent on having a
smooth transition and the buy-in for full implementation just isn’t quite there. The result is
that sustaining the improvement realized in the Improve step becomes difficult. The purpose
of the Control step is to ensure a successful implementation of the team’s recommendation so
that long-term success will be attained. The new and improved process will be flowcharted
and these new methods will become the new standard operation procedures. Results will
continue to be tracked so that any “drift” back to previous results can be monitored and
addressed in a proactive manner. The Control step is about the transfer of responsibilities and
establishing plans for long-term process control.
The DMAIC steps are a proven roadmap for any process improvement project. There are
only five steps so they are relatively easy to remember. They offer a structured approach to
solving problems and improving results. There are certain questions to be addressed under
each step and certain tools and techniques can be utilized to answer those questions through
facts and data.
When the DMAIC steps are properly applied, they offer any project team an organized
approach, a structure, to solving key business problems. The DMAIC steps are flexible and
can be used in any industry or with any type of process improvement effort. They just make
sense, which is why they are so powerful. Every team leader should be familiar with, and
incorporate, the DMAIC steps into all process improvement projects.
What is the
problem?
What data is
available?
What are the
root causes of
the problem?
Do we have the
right solutions?
What do we
recommend?
What is the
scope?
Is the data
accurate?
Have the root
causes been
verified?
How will we
verify the
solutions work?
Is there support
for our
suggestions?
What key metric
is important?
How should we
stratify the data?
Where should
we focus our
efforts?
Have the
solutions been
piloted?
What is our plan
to implement?
Who are
stakeholders?
What graphs
should we
make?
What clues have
we uncovered?
Have we
reduced
variations?
Are results
sustainable?
Table 3.1 Questions to be addressed under each step
20. Chapter 4. SIX SIGMA IN CONSTRUCTION INDUSTRY
4.1 Introduction:
Construction industry has essential role in many other industries and is the infrastructure of
the numerous organizations, therefore any improvement and development in construction
industry results in progress of the associated business and industry. Despite the importance of
high quality level in construction industry regarding to its close interaction with the other
firms, achievement of appropriate quality level in construction industry has long remained
questionable. However, inefficient handlings of the resources, lack of systematic quality
improvement, and pragmatic approach in management, have caused significant losses and
wastes in construction industry during the years. Hence, numbers of quality improvement
principles such as just-in-time (JIT), lean production, and pull scheduling have been adopted
in construction industry to attain high quality level in construction operations. However, Six
Sigma principles as an effective methodology in construction industry, stress on reducing
variation and eliminating the root causes of defects. In contrast to the other improvement
methodologies Six Sigma metrics and tools are able to measure the defects rate, analyze the
performance and improve the quality level in construction projects.
4.2 Applying Six Sigma to a Construction Project:
4.2.1 Define:
The first step in this phase is to identify customers and their requirements, obviously different
kinds of clients can be defined, but in this project focus is on the company itself as an internal
customer and the customers of the built houses such as individual people or any housing
association as an external customer. In terms of business and finance, company aims to
reduce the costs and maximize financial benefits as well as customer satisfaction to be back
for further business, on the other hand customers wish to pay as less as possible for on time
delivery and high quality (with no defects). According to these requirements the goal of
implementing Six Sigma principles is to handle resources such as material, time, money, and
work force, efficiently and effectively in order to reduce the defects and costs.
Defect is anything that does not meet the requirements, On the other hand defect can be
defined as any fault, failing, and weakness in the construction, and different quality
dimensions such as safety, appearance and environmental impact are considerable to identify
the defects. Moreover, any construct project includes different phases and subprojects so in
each phase different defects and failures are identifiable.
Delay or late delivery of the products is defined as a significant defect in all phases from
cradle to grave, since affects the other phases subsequently. Delay can cause following
disadvantages and COPQ (cost of poor quality):
• Customers are dissatisfied
• Company has to cost for extra labour and equipment to accelerate constructing.
• Company has to cost for maintaining labour and equipments on site for extra days.
• Company probably has to pay the penalty for delay.
• Delay means less productivity and business for the company.
The other types of defects occur on the complete building or during each phase. These types
of defects are mainly associated with aesthetic aspects, safety measures, appropriate function,
and flawlessness. These defects can be identified through collecting appropriate data from the
previous projects and/or by monitoring all processes during the project.
21. As an example, in order to identify the defects, a complete building can be studied and tested
regarding different perspectives as below:
• Material tests
• Functional tests: water-tightness of the walls, windows, doors and any moisture area,
appropriate performance of the water piping, heating centre and equipments, electrical
equipments, air conditions, isolation, kitchen equipments, and etc.
• Safety tests: perseverance and tolerance to storm, earthquake, flood, lightening, and etc.
• Internal finishes: flawlessness of the walls, roofs, ceilings, doors, windows, and components
in different internal locations such as bedrooms, kitchen, toilets, bathrooms and etc.
• External finishes: flawlessness of the walls, roofs, ceilings, doors, windows, and etc of the
main building as well as any other external area and facility such as parking, balcony, fences,
and etc.
Note.1:
In terms of flawlessness it is necessary to consider the items such as joint and gaps,
smoothness and roughness, cracks, damages, straightness, functionality, and etc.
Note.2:
In order to recognize the defects properly it is essential to define technical characteristics of
each item according to the customer requirements, which is possible through technical tests
such as simulation and laboratory work and comprehensive survey of customer requirements.
The next step in this phase is to identify the key processes such as logistics, purchase, design,
construct and assembly as well as process owners and any involved people such as different
engineers, managers, coordinators, labour, and etc. This leads Six Sigma project to prioritize
the processes for implementation of Six Sigma and allocate an appropriate role to specific
person. According to the explanation of different roles and responsibilities and Six Sigma
certification, and importance of those roles such as Black Belts and Champions, it is requisite
to arrange the task force and assign those responsibilities to appropriate people at the
beginning of the program.
The paramount question that must be answered in advance is the feasibility and possibility of
the plan considering different aspects and prerequisites such as availability of data. Besides,
since Six Sigma is a business oriented strategy and all achievements state in financial terms,
it is required to estimate the investment and expends of implementing Six Sigma principles,
determine the expected outcomes, and approximate its profitability earlier.
4.2.2 Measure
In this phase current performance of the processes and products are evaluated and measured,
therefore a systematic performance measurement based on Sis Sigma principle is required to
manage it appropriately. The essential main factors to establish the systematic performance
measurement are performance indicators and CTQ (critical total quality). CTQs are the key
input variables for the DMAIC procedure which affect the performance rate, On the other
hand it can be said that CTQ (critical total quality) is the customer requirements but in
quantitative terms. Since DMAIC is the continuous procedure, input CTQs and output values
are evaluated and calculated continuously, this assessment and modification procedure can be
determined as a simple framework: Identify performance indicators and CTQs, operate
DMAIC procedure, and evaluate the outputs. As construction projects include numerous
uncertainties, this framework is able to provide the entire Six Sigma project with quantitative
inputs and outputs by the mean of CTQs and performance improvement, respectively. That
framework can be illustrated as below:
22. fig 4.1 Framework for input CTQ’s and output values
Different activities are demanded to define CTQs, such as interview with the engineers,
managers and any other involved people in the project and collecting their opinions, analyze
diagrams, process analysis, and etc. Following steps leads Six Sigma project to determine the
appropriate CTQs and quantitative targets for performance improvement.
fig 4.2 Steps to determine CTQ’s and output
The next step in this phase is to collect appropriate data for CTQs in order to measure
performance of the processes and/or products. Those data can be collected via studying the
documentation of the previous projects, inspection and monitoring of the current project,
survey and/or interview with the customers, engineers and any other involved people, etc.
Subsequently, appropriate measurement tools are required to measure current processes and
products performance based on defined CTQs. Several Six Sigma metrics are available to
measure the sigma level of the performance; one of them is process capability index on the
supposition that numerical data for CTQs are available, mean and standard deviation are
calculable by using those data, and acceptable boundaries are given. Process capability index
expresses by following formula.
Input CTQ
DMAIC
Procedure
Performance
Improvement
Principle
Indices
CTQ
Target CTQ
And Goal
23. (Process capability index) Cp= (USL-µ)/ (3*σ)
Where, USL= upper specification limits
Sigma level=3*Cp
As an example, where the on time delivery set as principle indices of performance then
variation of time cycle is reasonable to assume as the CTQ due to its close association with
on time delivery. In this regard process capability index is suitable to measure performance
level if target
CTQ is defined as maximum limit for cycle time variation, and mean and deviation are
calculated according to the collected data from previous projects.
In the matter of flawlessness, Six Sigma offers following formula to calculate percentage of
the flawless products (yield) and number of defects per million opportunities (DPMO)
according to the collected data from the first inspection of the complete house. Those data
can be categorized in a data sheet collection, it is necessary to consider all opportunities of
the defects and all parts of the complete house in this data sheet.
Yield= (total number of correct item/number of opportunities)
DPMO= (NO. Of defects/No. of opportunities* no of units)*1,000,000
As it mentioned earlier number of defects per million opportunities (DPMO), leads to the
sigma level of performance. In other words, those formulas quantify the quality of the houses
and provide the Six Sigma project with accurate data.
4.2.3 Analyze
In this phase the main task is to identify when, where and why the defects occur in the
construction project, which includes actual and potential problems and these purpose will be
satisfied through finding the root causes of problems. A cause-and-effect analysis in
association with process owners, field engineers, and/or any other team members is an
appropriate tool to find out the general causes of defects. In order to run an appropriate
investigation and analysis of root causes of problems, it is advantageous to study an overall
project in three different sections as below:
• Pre-construction activities and processes
• Construction work flow and involved processes and activities
• Quality of material, level of equipment, and competency of team members
Since a construction project includes numerous subprojects, processes, and preceding
activities, comprehensive review of them with regard to resource efficiency and effectiveness
during the overall project is required to lead this phase properly. Clearly a well done cause-
and-effect analyses will identify the problematic preceding activities which affect the success
of the project.
On the other hand as it explained above any construction project demands heavy reliance on
different processes and activities and their interconnection, therefore it is necessary to
consider the coordination of these processes and activities and their interface to meet the
success.
24. Moreover it can be said that each process is a customer of some other processes and poor
coordination between these processes reveals that each process team works individually and
the process members do not consider their customers. For example the assembly team is a
customer of logistics team, so in case that the logistics team is not fully aware of the needs of
the assembly team and do not consider their needs, assembly process might face with
considerable problems such as receiving damaged material or with delay. However,
departmentalization and lack of effective coordination of the different activities and processes
and their interface causes main problems for overall project. From the CTQs perspective, the
first priority in this phase is to identify the factors which influence the CTQs, classify those
factors and determine the critical influence factors. Those critical factors that affect CTQs can
be explored through an Ishikawa diagram; further more it should be considered that a cause-
and-effect analysis in cooperation with engineers, project supervisors, team members, and
using their knowledge, information and experience is able to investigate the critical influence
factors. Subsequently, an evaluation of the effects of those critical factors and verification of
their serious impacts on CTQs are vital to consider those factors as the root causes of the
problems. To simplify the earliest tasks, Six Sigma offers different tools such as simulation
test, “what if” analysis, and etc. However, identification of critical factors and the consequent
determination of the root causes of problems are achieved through the comprehensive
analysis of the project regarding the CTQs and all independent variables, either.
Note: as “the construction process is an outdoor activity that is affected by external
conditions and repetitive than manufacturing process”6 Besides all typical influence factors
such as site access, equipment, logistics, resources, team members skill and competence, it
should be noted that natural phenomena have considerable effects on the progress of the
construction projects and influence the quality of the complete houses. For example a bad
weather condition might cause delay in cycle time and subsequently reduce the rate of
productivity, and also humidity might cause mould and cracks after while if they were not
considered during the different phases such as design and assembly, and these mean poor
quality and customer dissatisfaction.
4.2.4 Improve
In this phase Six Sigma project aims to eliminate the identified defects through the
knowledge derived from analyze phase. As it mentioned earlier elimination of the root causes
of problems and modification of critical factors which cause deviation from target CTQs and
goal, result in elimination of defects, enhancement of sigma level and performance
improvement. In accordance to the analyze phase and demands for great coordination
between different processes and activities and their interface, it is necessary to organize a
formulated program to link the main teams and activities. The importance of the coordination
program is considerable because of the wide range of activities during an overall construction
project. Such program provides the project with meetings and workshops in which project
teams are able to discuss the whole project improvement, their requirements for efficient
work, future problems, and etc. An appropriate coordination program offers following
advantages:
• Eliminates the gaps between different processes and/or activities.
• Leads preceding activities and subprojects to fulfill the requirements of the other processes
which known as their customer.
• Minimize the impacts of failure in one process or activity on the other ones.
25. • Leads to identify the potential problem areas and act before occurrence.
• Enhances cooperation to eliminate the failures immediately to prevent forming the chain of
problems, Etc.
However, effective coordination of the different processes and activities and their interface
are required to improve the entire construction project. On the other hand although Six Sigma
principles emphasize on collaboration and team work, it is significant to motivate the team
members to be the owners of their work and strive for their own specific goal regarding their
tasks beside the cooperation and effort toward the common goal and overall success of the
project.
As it mentioned above the main task in this phase is the elimination of the root causes of
problems based on the knowledge and information obtained in previous phase, such as
upgrading equipments, purchasing the material of higher quality, and improving the
competency, but it is absolutely imperative to consider its financial benefits. There is no
doubt that improvement and progress demands investment and capital expenditure, but it is
non value added work and is not advocated unless it is able to improve the business and
increase the profitability in midterm or long term in some cases. Therefore it is strongly
recommended to estimate the profitability in advance to avoid of risks and inefficient costs.
In short, it is necessary to implement an alternative action that provides financial benefits and
business development apart from improving the performance and sigma level as high as
possible. Optimization methods lead the project to maximize profits in an appropriate
performance level. For instance, in case improvement from level 5 to 6 demands numerous
activities and vast investments whereas business stands at its former level, the improvement
is not reasonable and sensible and operates ineffectively. Hence, this matter is of paramount
importance to maintain stable at the optimal point of improvement.
Subsequently, elaborate improvement schemes, such as competence development program
are required to eradicate identified gaps and weaknesses of the whole project in its all
different aspects. Finally, it should be noted that improvement and high quality level attain
gradually during the years in an upstream flow.
4.2.5 Control
The control phase is responsible to ensure the sustainability and development of the
improvements that have been obtained through the implementation of Six Sigma principles.
In this matter, it is requisite to collect data continuously during the project and measure the
performance, continuous review of the project and monitoring the improvements provide the
following advantages and opportunities for the Six Sigma project.
• Leads to proper evaluation of improvement to ensure that estimated improvements have
been attained.
• Leads to prevention of reversion to the former failures
• Explore the potential area for further improvements and continual perfection.
The next task in this phase is recording and documentation of the knowledge and experiences
which gained during the different revision of the project and sharing that knowledge with
team members and team supervisors and receiving their feedback. The importance of
continual actions through the control of performance improvement, necessitate the
establishment of the comprehensive control plan. It is even recommended to allocate the
specific people to this process, who are responsible to monitor the overall project.
26. Chapter 5. MATERIAL MANAGEMEANT IN CONSTRUCTION INDUSTRY
5.1 Introduction:
Materials management is defined as a management system that is required in planning and
controlling the quality & quantity of the material, punctual equipment placement, good price
and the right quantity as required. Material management is a management system that
integrates purchasing, shipping and material control from suppliers. Based on those
definitions, generally materials management can be defined as a process of planning,
executing, and controlling the right source of materials with the exact quality, at the right
time and place suitable for minimum cost construction process. Capability to coordinate and
integrate purchasing, shipping and material control from suppliers is required for material
cost control. Three important phases that holds the key to a successful materials management
are materials purchasing, materials usage, and storage .It is used to reduce the cost, which
increases profitability and streamlines the production. Apart from management of material
cost and its supply it helps in its proper utilization, transportation, storage, handling and
distribution. Selection of personnel for marketing, purchasing, inventory control, stores
management and materials handling and their training and placement is also to be seen by the
materials management department This indicates that it is very essential to have a materials
management department in any organization to support the management in the production
activities. It also helps in the marketing, sales promotion and control of all the types of
materials for its quantity, quality and cost.
5.2 Methodologies:
1. Analysis of site and management
2. Analysis on Inventory controlling
3. Analysis on purchasing procedures
4. Analysis on Procurement and Tracking
5. Analysis on costs
5.2.1 Analysis of Site and Management
This analysis is done to understand what are all the problems occurring in the company
because of improper application of material management. The solutions that provided in this
work may cost a lot in the beginning, but it will help the company in the long run by
providing solutions to the key problems like lack of specification, delay, improper
procurement etc. According to the problems that generally occur in the site due to the
improper material management, is categorised each problem and a cause-effect diagram is
27. prepared, where factors such as, inventory, purchase, procurement, are all generally
addressed to procurement cycle. For this purpose, the study is done by visiting the site. Site
survey is done and prepared questionnaires accordingly and problems to each above
mentioned groups are analysed and solutions thus were given. Substantial evidences in the
form of photos are taken to analyse the procurement problems occurring in the industry.
Questions are prepared accordingly and those prepared questions are given as a challenge to
the site managers, quality control inspector, project manager, purchase manager. From the
questionnaires prepared and the answers thus obtained from them are categorized into each
class of problems. Thus the problems are pointed out to them and corrections would be
implemented by them in their next oncoming projects.
5.2.2 Analysis on Inventory Controlling
In the inventory process, the methodology adopted is preparing questionnaires and allocating
marks for each, by categorizing them into each of their subsystem problems, such as supply,
materials and equipments, weightages are given substantially. Then, based on this solutions
can be offered in the form of cause – effect diagram and flow charts, graphs are prepared,
depicting problems such as delay, lack of specification, excess and lack of inspection.
Inventory Planning
i. Production planning requires purchase and inventory planning decisions for an organization
to control expenses and finances.
ii. To get the purchase benefits, discounts, reduced transportation and ordering cost the bulk
purchase may be economical. Inventory of such materials are stored for longer time.
5.2.3 Analysis on Purchasing Procedures
All the organizations need an efficient and economic purchasing and procurement of its
various supplies of materials from the suppliers.
Process of Purchasing
The process of purchasing involves various steps to be followed as routine matter by the
purchase department.
i) Identification of materials: Identify the materials to be purchased by receiving the
requisitions received from various departments.
(ii) Purchase requisitions: Purchase requisitions are documents listing the requirements of
materials from the various stores written by the storekeeper received by the purchase
department from various departments. The planning department for special purchases for
non-stock items also prepares the purchase requisitions. The purchase requisitions are made
as Bill of Materials (BOM) of a product, which specifies quantities, needed. The purchase
requisitions are generally prepared in triplicate. One copy sent to the purchase department
signed by the storekeeper, works manager and production controller, second copy sent to
materials control or planning department and third copy is retained by the requisitioned.
28. 5.2.4 Analysis on Procurement and Tracking
In this, the concept is based on procurement and tracking of the materials which is done with
the help of RFID and bar coding scanners. In procurement tracking, the concept of tracking
the material is done mainly with the help of barcode scanners, where the quality control
manager can view the materials to where it is being transported. Hence a check on the
materials can be done. Once the transportation has arrived at site, the material is passed by
cross checking it with the bill of quantities and bill of loading, with the consignee. Once the
consignee accepts the bill of loading it is then conveyed to the consigner.
5.2.5 Analysis on Cost
5.2.5.1 ABC Analysis
This is based on cost criteria. It helps to exercise selective control when confronted with large
number of items it rationalizes the number of orders, number of items & reduce the
inventory.
About 10 % of materials consume 70 % of resources
About 20 % of materials consume 20 % of resources
About 70 % of materials consume 10 % of resources
5.2.5.2First In First Out (FIFO) Method
In this method, the material stored first is issued first. For using this procedure, the following
methods are used.
5.2.5.3 Double Area System: In this particular method, two areas are used for each item to
be stored and issued. The new lots of items are stored in second empty area and materials are
issued from first area where previous old lot is stored. When first area is emptied, the material
from second area is shifted to first area so that second area is emptied to receive the fresh
materials.
5.2.5.4 Moving Division System: In this method is the place selected for each item is more
in area than required to provide space between new and old lots. The materials supplied first
are placed first in right hand side area from where it is issued. The fresh lot is supplied in the
second area on left hand side and shifted to right hand side when it is emptied.
5.2.5.5 Gravity Feed System: The new materials are fed at the top of the containers or piles
and removed from the bottom.
29. Chapter 6. ABC ANALYSIS AND ECONOMIC ORDERED QUANTITY
6.1 ABC Analysis:
This is most popular inventory control technique adopted as Pareto’s Law. Large amount of
capital is invested in purchase of costly items in small number. Eighty percent of the cost of
materials purchased is required for only Twenty percent costly items for efficient inventory
control in stores where the large number of materials are to be handled, the classification of
them is necessary to take particular care of costly items, which are less in number. The ABC
analysis is commonly used in most of the organizations to classify the materials according to
their sales values. In this method, all the items of stores are classified in three groups as A, B
and C as explained below.
(i) The quantity of each item used annually multiply by its unit sales price is sales value of
that item. All such sales values of all the items are calculated and tabulated.
(ii) The items, its quantity sold and sales values are tabulated in decreasing order and the
sales values are added item-wise and shown in next column.
(iii) The totals of quantity and sales values of all the items used annually are found out. The
percentage sales values of
each item is found out and percentage of quantity of each item is also found out. These two
columns are added showing percentage of total sales values item wise and percentage of total
quantity of sales.
(iv) Seventy percent of total sales value items will be listed in A category. Its percentage
quantity used is found out.
(v) About 20 % of total sales value items will be listed in B category. Its percentage quantity
used is found out.
(vi)Balanced about 10 % of total sales value items will be listed in C category. Its percentage
quantity will be remaining balance.
6.1.1 Characteristics of ABC Items
A-Items
These items have 70% of sales value but less in quantity about 15 to 20%. The capital should
not be blocked in these items. They can be ordered frequently and consumed immediately.
The purchase of these items will be controlled by Director and cared most in the company.
They are only 10 to 15% quantity wise and require special attention in stores.
B-Items
30. They have about 20 to 25% sales value and same quantity to purchase. Since they are
medium valued items therefore large inventory of them is not necessary. They can be ordered
frequently but at the same time the quantity ordered should be such that it will be economic
to purchase and its shortage should not be there. They are less valued than A items and
quantity-wise about 15 to 25%.
C-Items
They have the least sales cost about 10%. They are required in large quantity about 50 to
60%. They can be purchased in bulk to avail large discounts and fewer prices to pay. This
will also reduce the cost of ordering and purchasing. They can be purchased once or twice in
a year. They are least-valued items.
6.1.2 Advantages of ABC Analysis:
(i) The inventory control of different categories of items will be better if costlier items are not
stored for large period, which reduces capital investment.
(ii) The quantities of various categories of items are economically ordered and stored as per
need. It saves the cost of ordering and carrying the inventories.
(iii) The purchasing of various categories of items becomes easy and discounts are also
obtained on large purchase of items of C category.
(iv)Better record keeping of different categories of items helps in good inventory control
6.2 Economic Ordered Quantity:
One of the basic decisions that must be made in any stock control system is that of
determining the quantity to order since investment in inventories largely depends upon the
quantities in which the items are ordered for replenishment.
Ordering large lots less frequently reduces administrative work but increases investment in
the stocks. Ordering small lots frequently keeps the investment low but increases
administrative work. This is because small lots require high ordering frequency, more
purchase requisitions are required to be raised, more frequent inquiries are to be made, more
frequent comparative statements must be prepared, more frequent purchase orders must be
raised, material is received more frequently, more bills must be handled. All these activities
call for more staff and hence more administrative costs and overheads. Therefore, a rotational
approach is needed for fixing the ordered quantity of an item.
Economic ordered quantity is the level of inventory that minimizes the total inventory
holding costs and ordering costs. It is one of the oldest classical production scheduling
models. EOQ applies only when demand for a product is constant over the year and each new
order is delivered in full when the inventory is zero. There is a fixed cost for each order
placed, regardless of the number of units ordered. There is also a cost for each unit held in
storage, sometimes expressed as a percentage of the purchase cost of the item..
31. The required parameters to the solution are the total demand for the year, the purchase cost
for each item, the fixed cost to place the order and the storage cost for each item per year.
Note that the number of times an order is placed will also affect the total cost, though this
number can be determined from the other parameters.
6.2.1 Assumptions underlying the EOQ model:
1. The ordering cost is constant.
2. The rate of demand is known, and spread evenly throughout the year.
3. The time elapsed between the placing of a replenishment order and receiving the item
into the stock, called as the lead time, is zero.
4. The purchase price of the item is constant and independent of the order size.
5. The replenishment can be made instantaneously, i.e. the whole batch can be delivered
at once.
6. The inventory carrying charges vary directly and linearly with the size of the
inventory and are expressed as a percentage of the average inventory investment.
7. The item can be procured in the quantities desired, without there being any
restrictions of any kind.
8. The items have a fairly long shelf live, and there is no fear of any deterioration or
spoilage.
fig 6.1 Graph to determine EOQ
In the above figure it can be seen that the optimal ordered quantity occurs at a point where the
ordering cost curve and carrying cost curve intersect. The optimal order quantity occurs at a
point where the total order cost is equal to the total holding cost. This fact importantly
reduces development of the EOQ model.
32. 6.2.2 Derivation of EOQ:
Variables used:
Annual consumption of the item (units) : S
Price per unit(₹) : Cu
Procurement cost per order(₹) : Cp
Inventory carrying cost as a percentage of average inventory investment(decimal) : i
Order quantity(units) : q
Economic ordered quantity : q0
Preparation of the model:
Annual procurement cost= No. of orders per year x Procurement cost per order
= (Annual consumption / Order Quantity) x
(Procurement cost per order)
= [(S/ q) x Cp ] ..……..(1)
Annual Inventory Carrying Cost = (Average inventory investment ) x
(Inventory carrying cost)
=1/2(Ordered quantity x Price per unit) x
(Inventory carrying cost)
= (q x Cp x i) / 2 …..……(2)
Annual Total Cost (ATC) = [(S/q) x Cp] + [(q x Cp x i)/ 2] ………..(3)
Optimization of Model:
To determine economic ordered quantity (q0), that minimizes the total cost,
Differentiate ATC with respect to decision variable q and set the first derivative to zero.
𝑑(𝐴𝑇𝐶)
𝑑𝑞
= [
−𝑆. 𝐶 𝑝
𝑞2 ] + [
𝐶 𝑢 ×𝑖
2
] = 0
Or 𝑞2
= [
2.𝑆. 𝐶 𝑝
𝐶 𝑢 . 𝑖
] (when order quantity equals EOQ the q= q0)
Or q0 =√
2 .𝑆 .𝐶 𝑝
𝐶 𝑢 . 𝑖
𝐸𝐶𝑂𝑁𝑂𝑀𝐼𝐶 𝑂𝑅𝐷𝐸𝑅𝐸𝐷 𝑄𝑈𝐴𝑁𝑇𝐼𝑇𝑌
=
√
2 × [𝐴𝑛𝑛𝑢𝑎𝑙 𝑐𝑜𝑛𝑠𝑢𝑚𝑝𝑡𝑖𝑜𝑛 𝑢𝑛𝑖𝑡𝑠 ×
𝑃𝑟𝑜𝑐𝑢𝑟𝑒𝑚𝑒𝑛𝑡 𝑐𝑜𝑠𝑡
𝑁𝑜. 𝑜𝑓 𝑂𝑟𝑑𝑒𝑟𝑠
]
𝑃𝑟𝑖𝑐𝑒 𝑝𝑒𝑟 𝑢𝑛𝑖𝑡 × 𝐼𝑛𝑣𝑒𝑛𝑡𝑜𝑟𝑦 𝐶𝑎𝑟𝑟𝑦𝑖𝑛𝑔 𝐶𝑜𝑠𝑡
33. Chapter 7. MATERIAL MANAGEMENT USING SIX SIGMA
7.1 Introduction:
Planning of material requirements in construction is a necessary function in any organization,
as inventory of materials involves about 60% of the total investment of the organization. The
profit earned depends on the utilization of these materials.
7.2Advantages:
The main advantages of a good system of material management are as follows:
1. Reduce production delays by ensuring unrestricted and continuous supply of material on
time.
2. Minimizes the capital investment on the stock of materials.
3. Reduce the cost of storage and issuing of materials.
4. Reduce wastage and loss of material through pilferage, theft, spoilage, evaporation etc.
5. To ascertaining the position of inventory and accurate valuation of closing stock is possible
by introducing perpetual inventory control system.
6. Ensure the purchase of material at reasonable price.
7. It helps the management in initiating and formulating proper purchase policies of materials.
8. It reduces the annual operating costs by introducing suitable infrastructure and material
handling devices.
9. Improve aesthetics of the manufacturing unit by planning storage of material.
7.3 Survey:
Through direct communication, 5 questionnaires were circulated to builders of different
construction companies and the case study is based on the responses received.
34.
35.
36. 7.4 Conclusion:
Construction industry suffers from several problems out of which material
management is a major problem.
By solving problems related to material management huge losses can be prevented as
the investment in inventory is large.
Hence we choose implementation of six sigma methodology to solve problems related
to material management.