![Funding Requirements
$75,000 from Friends Family and Fools
Will pay back with positive net income
Capital Equipment
Will spend $14252.46 on Equipment
Most will come from Wasser Strom
Range from Food appliances and clean up material
[2]
5
Operating Costs
Sales Projections
[1]](data:image/gif;base64,R0lGODlhAQABAIAAAAAAAP///yH5BAEAAAAALAAAAAABAAEAAAIBRAA7)
Recommended
More Related Content
Similar to FORK THE PORKZane & Brian1Assumptions6 .docx
Similar to FORK THE PORKZane & Brian1Assumptions6 .docx (20)
More from budbarber38650
More from budbarber38650 (20)
Recently uploaded
Recently uploaded (20)
FORK THE PORKZane & Brian1Assumptions6 .docx
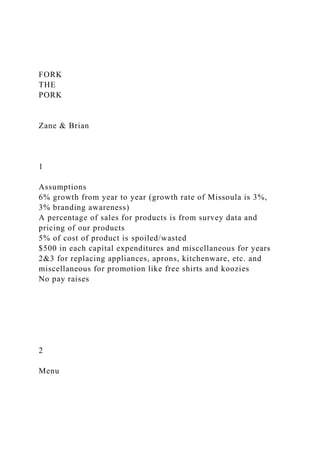
- 1. FORK THE PORK Zane & Brian 1 Assumptions 6% growth from year to year (growth rate of Missoula is 3%, 3% branding awareness) A percentage of sales for products is from survey data and pricing of our products 5% of cost of product is spoiled/wasted $500 in each capital expenditures and miscellaneous for years 2&3 for replacing appliances, aprons, kitchenware, etc. and miscellaneous for promotion like free shirts and koozies No pay raises 2 Menu
- 2. Funding Requirements $75,000 from Friends Family and Fools Will pay back with positive net income Capital Equipment Will spend $14252.46 on Equipment Most will come from Wasser Strom Range from Food appliances and clean up material [2] 5 Operating Costs Sales Projections [1]
- 3. Break Even Analysis Break even in August of year 2. Startup Fixed Costs: $70,179.32 Variable Cost/ sale: $3.47 Average Sale Revenue: $8.20 Sensitivity Analysis 9 10
- 4. THANK YOU [1] CalendarMayJuneJulyAugustSeptember11Out to Lunch18011Garden City brewfest57922Downtown ToNight186223Out to Lunch1803334Downtown ToNight186444555Out To Lunch1805666Downtown ToNight1866777788Out to Lunch1808899Downtown ToNight1869910Out to Lunch18010101011Downtown ToNight186111111121212Out To Lunch18012Hemp Fest613131313Downtown ToNight18613141414141515Out to Lunch18015151616Downtown ToNight186161617Out to Lunch18017171718Downtown ToNight186181818191919Out To Lunch18019202020Downtown ToNight18620212121212222Out to Lunch18022Roots Fest338222323Downtown ToNight18623Roots Fest3382324Out to Lunch1802424Roots Fest3382425Downtown ToNight186252525262626Out To Lunch18026272727Downtown ToNight18627282828282929Out to Lunch18029293030Downtown ToNight18630303131Total579Total1465Total1652Total2478Tot al613 [1] [2]
- 5. Cash DisbursementsJan.Feb.Mar.Apr.MayJuneJulyAugSept.Oct.Nov. Dec. Inventory-$ -$ -$ 377.82$ 2,089.44$ 3,945.50$ 4,849.21$ 4,849.72$ 1,600.63$ Rent-$ -$ -$ 200.00$ 248.00$ 488.00$ 560.00$ 776.00$ 248.00$ -$ -$ -$ Wages-$ -$ -$ -$ 165.00$ 693.00$ 874.50$ 1,369.50$ 214.50$ -$ -$ -$ Capital expenditures50,000.00$ 14,252.46$ Insurance1,500.00$ Licensing340.00$ Registration150.00$ 500.00$ MDA payment282.43$ 701.02$ 779.83$ 1,170.59$ 296.62$ Taxes0000651.96$ 1,646.60$ 1,842.06$ 2,770.77$ 688.84$ 000 Total Cash Disbursements51,650.00$ 14,752.46$ -$ 917.82$ 2,784.87$ 5,827.52$ 7,063.53$ 8,165.81$ 2,359.75$ -$ -$ -$ If we cant make it to events Event Events / Year Estimated Customers Estimated Oportunity Cost/Event Oportunity Cost for all Events Roots Fest11013(8,935.31)$ (8,935.31)$ Out to Lunch13180(1,588.50)$ (20,650.50)$
- 6. Downtown Tonight13186(1,644.24)$ (21,375.08)$ Hemp Fest1613(5,412.67)$ (5,412.67)$ Garden City Brewfest1579(5,110.48)$ (5,110.48)$ Year 1 Contribution Margin Income Statement JanFebMarAprMayJunJulAugSepOctNovDecTotals Sales4,748.55$ 12,015.16$ 13,542.95$ 20,317.66$ 5,029.33$ 55,653.64$ Cost of Good Sold1,511.27$ 3,823.94$ 4,310.18$ 6,466.29$ 1,600.63$ 17,712.32$ Labor-$ 165.00$ 693.00$ 874.50$ 1,369.50$ 214.50$ 3,316.50$ Mama's Pantry Rent200.00$ 248.00$ 488.00$ 560.00$ 776.00$ 248.00$ 2,520.00$ Contribution Margin-$ -$ -$ (200.00)$ 2,824.27$ 7,010.22$ 7,798.27$ 11,705.86$ 2,966.20$ -$ -$ - $ 32,104.82$ Insurance (Vehicle)1,500.00$ 1,500.00$ Registration150.00$ 500.00$ 650.00$ Licensing340.00$ 340.00$ Depreciation 6,425.25$ 6,425.25$ Miscellaneous -$ Earning before tax(1,650.00)$ (500.00)$ -$ (540.00)$ 2,824.27$ 7,010.22$ 7,798.27$ 11,705.86$ 2,966.20$ -$ -$ (6,425.25)$ 23,189.58$ MDA percentage282.43$ 701.02$ 779.83$ 1,170.59$ 296.62$ 3,230.48$ Earning after MDA payment(1,650.00)$ (500.00)$ -$ (540.00)$ 2,541.85$ 6,309.19$ 7,018.44$ 10,535.28$ 2,669.58$ -$ -$ (6,425.25)$ 19,959.10$ Taxes0000651.96$ 1,646.60$ 1,842.06$ 2,770.77$ 688.84$ 0007,600.24$ Depreciation 10,000.00$ Net Income(1,650.00)$ (500.00)$ -$ (540.00)$ 1,889.89$ 4,662.60$ 5,176.38$ 7,764.51$ 1,980.73$ -$ -$ 3,574.75$ 22,358.86$ Fork The Pork
- 7. Proforma Income Statement For the Year Ending 2016 Variable Expenses Fixed Expenses Jan.Feb.Mar.Apr.MayJuneJulyAugSept.Oct.Nov.Dec. Cash Reciepts Revenue$0.00$0.00$0.00$0.00$4,748.55$12,015.16$13,542.95$ 20,317.66$5,029.33$0.00$0.00$0.00 Depreciation$0.00$0.00$0.00$0.00$0.00$0.00$0.00$0.00$0.00$ 0.00$0.00$10,000.00 Operating Cash Flow$0.00$0.00$0.00$0.00$4,748.55$12,015.16$13,542.95$20, 317.66$5,029.33$0.00$0.00$10,000.00 Financing Equity$75,000.00 Loan Financing Cash Flow$75,000.00 Cash Disbursements Inventory$0.00$0.00$0.00$377.82$2,089.44$3,945.50$4,849.21 $4,849.72$1,600.63 Rent$0.00$0.00$0.00$200.00$248.00$488.00$560.00$776.00$2 48.00$0.00$0.00$0.00 Wages$0.00$0.00$0.00$0.00$165.00$693.00$874.50$1,369.50$ 214.50$0.00$0.00$0.00 Capital expenditures$50,000.00$14,252.46 Insurance$1,500.00 Licensing$340.00 Registration$150.00$500.00 MDA payment$282.43$701.02$779.83$1,170.59$296.62 Taxes0000$651.96$1,646.60$1,842.06$2,770.77$688.84000 Total Cash Disbursements$51,650.00$14,752.46$0.00$917.82$2,784.87$5,8 27.52$7,063.53$8,165.81$2,359.75$0.00$0.00$0.00 Net Cash Flow $23,350.00-$14,752.46$0.00- $917.82$1,963.68$6,187.64$6,479.41$12,151.85$2,669.58$0.00
- 8. $0.00$10,000.00 Begin cash balance$0.00$23,350.00$8,597.54$8,597.54$7,679.72$9,643.40 $15,831.04$22,310.45$34,462.30$37,131.88$37,131.88$37,131. 88 Cash reciepts$75,000.00$0.00$0.00$0.00$4,748.55$12,015.16$13,542 .95$20,317.66$5,029.33$0.00$0.00$10,000.00 Cash disbursements$51,650.00$14,752.46$0.00$917.82$2,784.87$5,8 27.52$7,063.53$8,165.81$2,359.75$0.00$0.00$0.00 End cash balance$23,350.00$8,597.54$8,597.54$7,679.72$9,643.40$15,8 31.04$22,310.45$34,462.30$37,131.88$37,131.88$37,131.88$4 7,131.88 Fork The Pork Pro Forma Cash Flow Statement For Year Ending 2016 Event NameAttendanceEstimatedFood Truck optionsCustomer ShareEstimated CustomersHours of operationCustomers/hr Roots Fest15000167%10132344 Out to Lunch3000206%180360 Downtown Tonight3000196%186362 Hemp Fest6000910%6131061 Garden City Brewfest6500119%579872 Food Events % eating elsewhere0.2Yellow - (Other Events) People don't go specifically to eat Unique Factor0.02Green- (Food Events) People Go to event to eat Red- (High Alternatives) Various alternatives other than food trucks Other Events % eating elsewhere0.35Formula Unique Factor0.03Attendance * (1 - [% eating elsewhere]) * [Customer Share] + Unique Factor
- 9. High AlternativesCustomer Share =1 / [Estimated Food Truck Options] % eating elsewhere0.4 Unique Factor0.03 ItemQuanitityUnit PriceTotal Food Truck1 50,000.00$ 50,000.00$ Smoker wood31 31.50$ 976.50$ Approx 25 to 30 lbs per box (1.7 cubic feet) http://www.bestbarbecuewood.com/ Smoker15,535.00$ 5,535.00$ http://www.yodersmokers.com/pricelist.html Refidgerator Case11,881.54$ 1,881.54$ http://www.shortorder.com/manufacturers/true/true-reach-in- refrigeration-t-12-115- 1?utm_campaign=affiliate&utm_medium=CJ&utmsource=affilia te&utm_source=7023305 Heating Case13,338.00$ 3,338.00$ http://www.centralrestaurant.com/Camtherm-Low-Heat-With- Security---Case-of-12- c64p31426.html?utm_source=bing&utm_medium=cpc&utm_cam paign=BPA:+250-E64- GRASAND&utm_term=cambro%20heating%20case Sauce Bottles48 1.08$ 51.84$ 16oz bottleshttps://www.ebottles.com/showbottles-familyid- 321.htm Large sauce Bottles3 22.84$ 68.52$ 22 Qt containerhttp://www.wasserstrom.com/restaurant- supplies-equipment/GCSearchCmd?storeId=10051&langId=- 1&catalogId=1000148&pageDisplay=grid&maxResults=20&ran
- 10. kBy=relevancy&search_field=cambro+food+storage+containers &utm_source=google&utm_medium=cpc&utm_term=cambro%2 0food%20storage%20containers&kwid=6dfa57c9bf6f4710a6b4f 242f903159a Cutting Board3 17.92$ 53.76$ 12x18 cutting boardhttp://www.wasserstrom.com/restaurant- supplies-equipment/Product_648227 Electric Hot Food Table1 771.99$ 771.99$ http://www.foodservicewarehouse.com/eagle/sdht2- 120/p333624.aspx?utm_source=criteo&utm_medium=cpc&utm_ campaign=Channel+Advisor+Eagle+Criteo&utm_content=Eagle +%20SDHT2-120&CA_6C15C=1939415650 Sheet Pan3 11.88$ 35.64$ Full Sizehttp://www.wasserstrom.com/restaurant-supplies- equipment/GCSearchCmd?storeId=10051&langId=- 1&catalogId=1000148&pageDisplay=grid&maxResults=20&ran kBy=&search_field=sheet+pan Hotel Pans3 90.92$ 272.76$ Full Sizehttp://www.wasserstrom.com/restaurant-supplies- equipment/Product_100010 Kitchen Scissors3 12.98$ 38.94$ http://www.wasserstrom.com/restaurant-supplies- equipment/Product_216329 Serving Spoons5 7.16$ 35.80$ http://www.wasserstrom.com/restaurant-supplies- equipment/Product_208000 Tongs5 12.80$ 64.00$ http://www.wasserstrom.com/restaurant-supplies- equipment/Product_205388
- 11. Trash Can2 35.67$ 71.34$ 16 Gal Waste Can http://www.wasserstrom.com/restaurant- supplies-equipment/Product_654703 Mop Handle1 15.80$ 15.80$ http://www.wasserstrom.com/restaurant-supplies- equipment/Product_607447 Mop Head2 9.23$ 18.46$ http://www.wasserstrom.com/restaurant-supplies- equipment/Product_337282 Broom1 10.60$ 10.60$ http://www.wasserstrom.com/restaurant-supplies- equipment/Product_686243 Mop Bucket1 63.58$ 63.58$ http://www.wasserstrom.com/restaurant-supplies- equipment/Product_653323 Dust Pan1 17.01$ 17.01$ http://www.wasserstrom.com/restaurant-supplies- equipment/Product_620110 Cash Box1 29.00$ 29.00$ http://www.globalindustrial.com/p/office/cash-handling/cash- boxes/cb1210-cash-box-keylock-5-compartments-lift-out- tray?utm_source=msn&utm_medium=shp&utm_term=B1517675 &utm_campaign=Cash-Boxes- Trays&infoParam.campaignId=WR Ipad mini 16gb1 219.00$ 219.00$ http://www.walmart.com/ip/33093101?wmlspartner=wmtlabs&a did=22222222222022153250&veh=sem POS Square & Stand1
- 12. 429.00$ 429.00$ https://squareup.com/shop/market-ipad-mini Seasoning Shakers5 7.38$ 36.90$ http://www.wasserstrom.com/restaurant-supplies- equipment/Product_125780 Mixing Bowls5 11.26$ 56.30$ http://www.wasserstrom.com/restaurant-supplies- equipment/Product_137433 Apron10 7.09$ 70.90$ http://www.wasserstrom.com/restaurant-supplies- equipment/Product_372015 Rubber Scrapers10 0.99$ 9.90$ http://www.wasserstrom.com/restaurant-supplies- equipment/Product_684621 Measuring Cups2 3.65$ 7.30$ http://www.wasserstrom.com/restaurant-supplies- equipment/Product_6003207 Measuring Spoons2 0.99$ 1.98$ http://www.wasserstrom.com/restaurant-supplies- equipment/Product_134460 Liquid measuring cups2 4.03$ 8.06$ http://www.wasserstrom.com/restaurant-supplies- equipment/Product_555809 Napkin Dispensers4 15.76$ 63.04$ http://www.wasserstrom.com/restaurant-supplies- equipment/Product_987530 Total less food truck 14,252.46$
- 13. Fork the Pork $ Critical Point 3 Critical Point 3 Fork the Pork Page 1 of 13 Page 4 of 13 Olivia Darrow Spencer Bolt Brian Hybner Zane Weber Steven McClain Overview Fork the Pork is a seasonal BBQ mobile food truck that will offer home-style BBQ options, such as pulled pork sandwiches, beef brisket, and baby back ribs. As a seasonal mobile food truck, sales will be focused around select downtown events: Brewfest, Downtown ToNight (every Thursday evening from June-August), Out to Lunch (every Wednesday from June to August), River City Roots Festival, and various events occurring during the summer period (MDA Events). Assumptions for Financials Fork the Pork has made the following assumptions regarding its financial projections over the course of its first three years of operation. 6% Sales Growth Each Year Fork the Pork estimates that it will experience a 6% growth rate each year. This figure is supported by the annual growth rate of
- 14. Missoula of 3%, in addition to another 3% sales growth from an increase of brand awareness, Sales Mix Fork the Pork used survey data, as well as made inferences about consumer buying habits based on item price to determine an estimated percentage of sales for each item. Item Pulled Pork Beef Brisket Rib Plate Percent of Sales 45% 20% 25% Menu Price $5.00 $8.50 $8.00 In addition, Fork the Pork estimates 60% of its customers will purchase one of its three side options for an additional $1.50 and 55% of customers will purchase one of its two beverage options (lemonade and iced tea) for $1.00. Wastage Fork the Pork has assumed a 5% wastage cost due to spoilage or some other cause such as employee grazing. Future Capital Expenditures and Miscellaneous Expenses Fork the Pork assumes $500 in year 2 and 3 for replacing equipment such as utensils, pots and pans, kitchenware, and other assorted items. Fork the Pork also assumes $500 in year 2 and 3 for miscellaneous expenses for promotion items such as Koozies and t-shirts.
- 15. Fixed Wages Fork the Pork assumes that wages will remain constant over the next three years, and that there will not be a minimum wage increase mandated by either the state or federal governments. Capital Expenditures Fork the Pork has the following capital expenditures. · Food Truck - $50,000 · Smoker - $5,535 · Miscellaneous Equipment - $8,717 For a complete breakdown of capital expenditures, see Appendix 1 – Fixed Asset and Equipment List. Funding Requirements Fork the Pork will need $75,000 to fund the initial start-up, which will be raised by a combination of owner equity, and friend and family contributions. Sales Scenarios and Projections The following table illustrates the estimated sales projections for each of the events that Fork the Pork plans on selling its product at. The River City Roots Fest will be a large event, since it lasts for three days, and Fork the Pork will be able to sell for a long period of time each day. However, Out to Lunch and Downtown Tonight will be its most consistent source of revenue and cash flow due to the frequent occurrence of each event; 26 events when combined. The similarities in market demographics, attendance, and event characteristics such as length of service will allow Fork the Pork to streamline operations over time.Event NameAttendanceEstimated Food Truck optionsCustomer ShareEstimated CustomersEvents / YearHours of operationRoots Fest15000166.75%1013123Out to Lunch3000206.00%180133Downtown Tonight3000196.21%186133Hemp Fest6000910.22%613110Garden City Brewfest6500118.91%57918 Pro Forma Income Statements The following are the Pro Forma Income Statements for the first three years of operations. The first year is detailed month by month, whereas the second and third years are broken up by
- 16. quarter. Income Statement By Month For First Year Income Statement By Quarter For Year 2 Income Statement By Quarter For Year 3 Pro Forma Cash Flows The following are the Pro Forma Cash Flows for the first three years of operations. The first year is detailed month by month, whereas the second and third years are broken up by quarter. Cash Flow By Month For First Year Cash Flows By Quarter For Year 2 Cash Flows by Quarter For Year 3 Breakeven Analysis According to our breakeven analysis, Fork the Pork will break- even toward in Year 2, at the end of July. Sensitivity Analysis As an outdoor food vendor, Fork the Pork is very dependent on environmental factors such as inclement weather including rain, low temperatures, and poor air quality. These types of events can drastically effect Fork the Pork’s sales. Appendix 1 – Fixed Asset and Equipment ListItemQuantity Unit
- 17. Price Total Food Truck1 $50,000.00 $50,000.00 Smoker wood31 $31.50 $976.50 Smoker1 $5,535.00 $5,535.00 Refrigerator Case1 $1,881.54 $1,881.54 Heating Case1 $3,338.00 $3,338.00 Sauce Bottles48 $1.08 $51.84 Large sauce Bottles3 $22.84 $68.52 Cutting Board3 $17.92 $53.76 Electric Hot Food Table1 $771.99 $771.99 Sheet Pan3 $11.88 $35.64 Hotel Pans3 $90.92 $272.76 Kitchen Scissors3 $12.98 $38.94 Serving Spoons5 $7.16 $35.80 Tongs5 $12.80 $64.00 Trash Can2 $35.67 $71.34 Mop Handle1 $15.80 $15.80 Mop Head2 $9.23 $18.46 Broom1 $10.60 $10.60 Mop Bucket1 $63.58 $63.58 Dust Pan1 $17.01 $17.01 Cash Box1 $29.00 $29.00 Ipad mini 16gb1 $219.00 $219.00 POS Square & Stand1 $429.00 $429.00 Seasoning Shakers5 $7.38 $36.90 Mixing Bowls5 $11.26 $56.30 Apron10 $7.09 $70.90 Rubber Scrapers10 $0.99 $9.90 Measuring Cups2 $3.65 $7.30 Measuring Spoons2 $0.99 $1.98 Liquid measuring cups2 $4.03 $8.06 Napkin Dispensers4 $15.76 $63.04 Appendix 2 – Operating/Cost of Goods Sold Disclosure The following sections provide disclosure for labor costs, cost of goods sold, and a cost breakdown of a menu items by ingredient. Labor Costs The following table breaks down labor costs. Fork the Pork will require two workers, both paid $7.50/hr, to handle service, preparation tasks, and closing duties. The numbers reflect the total number of labor hours for both employees. Menu Item Cost (Cost of Goods Sold)
- 18. The Weighted Average COGS factors in all of the components of involved in selling a menu item including the different foodstuffs (i.e., meat, bread, sauce), the disposable paper goods, as well as side items and drinks. Component Breakdown The following tables breakdown the costs of menu item components including sauce, bread, sides and drinks. References Smoking Wood Chunks. (n.d.). Retrieved April 8, 2015, from http://www.bestbarbecuewood.com/ Yoder Smokers - Competition Grade BBQ Products. (n.d.). Retrieved April 8, 2015, from http://www.yodersmokers.com/pricelist.html True Reach In Refrigeration T-12, 115/1. (n.d.). Retrieved April 8, 2015, from http://www.shortorder.com/manufacturers/true/true-reach-in- refrigeration-t-12-115- 1?utm_campaign=affiliate&utm_medium=CJ&utmsource=affilia te&utm_source=7023305 Camtherm Low Heat With Security - Case of 12. (n.d.). Retrieved April 8, 2015, from http://www.centralrestaurant.com/Camtherm-Low-Heat-With- Security---Case-of-12- c64p31426.html?utm_source=bing&utm_medium=cpc&utm_cam paign=BPA: 250-E64-GRASAND&utm_term=cambro heating
- 19. case BBQ SAUCE BOTTLES - BARBECUE PLASTIC BOTTLES. (n.d.). Retrieved April 8, 2015, from https://www.ebottles.com/showbottles-familyid-321.htm Market POS Kit for iPad Mini | Square Shop. (n.d.). Retrieved April 8, 2015, from https://squareup.com/shop/market-ipad-mini Manufacturer Spotlight:. (n.d.). Retrieved April 8, 2015, from http://www.wasserstrom.com/restaurant-supplies-equipment FSA Spring Catalog. (2015, March 1). Sales Per Month Pulled Pork Sliders May June July August September 1302.954545454545 3296.842105263158 3716.052631578948 5574.967105263158 1380.0 Beef Briscuit May June July August September 984.4545454545454 2490.947368421053 2807.684210526316 4212.197368421053 1042.666666666667 Ribs May June July August September 1621.454545454545 4102.736842105262 4624.421052631578 6937.736842105262 1717.333333333333 #REF! May June July August September 1.0 Sides May June July August September 694.9090909090905 1758.315789473684 1981.894736842105 2973.315789473685 736.0 Drinks May June July August September 318.5000000000001 805.8947368421054 908.3684210526317 1362.769736842105 337.3333 333333333 May June July August September May June July August September May June July August September Total 4922.272727272727 12454.73684210526 14038.42105263158 21060.98684210526 5213.333333333332
- 20. Break Even Needed Break Even Sales May Jun Jul Aug Sep May Jun Jul Aug Sep 14836.06022359506 14256.96931450415 12791.70615660941 11140.12720924099 8662.364051346252 8049.030718012918 7122.485263467465 4778.064210835885 2135.537895046411 -1828.883157585168 Expected Sales May Jun Jul Aug Sep May Jun Jul Aug Sep 579.090909090909 1465.263157894737 1651.578947368421 2477.763157894737 613.3333333333332 926.5454545454545 2344.42105263158 2642.526315789474 3964.42105263158 981.3333333333332 Year 1 Contribution Margin Income Statement Jan Feb Mar Apr May Jun Jul Aug Sep Oct Nov Dec Totals Sales 4,748.55$ 12,015.16$ 13,542.95$
- 35. Taxes 0 0 0 0 651.96$ 1,646.60$ 1,842.06$ 2,770.77$ 688.84$ 0 0 0 7,600.24$
- 38. Fork The Pork Proforma Income Statement For the Year Ending 2016 Variable Expenses Fixed Expenses Year 1 Contribution Margin Income Statement JanFebMarAprMayJunJulAugSepOctNovDecTotals Sales 4,748.55$ 12,015.16$ 13,542.95$ 20,317.66$ 5,029.33$ 55,653.64$ Cost of Good Sold 1,511.27$ 3,823.94$ 4,310.18$ 6,466.29$ 1,600.63$ 17,712.32$ Labor -$ 165.00$ 693.00$ 874.50$ 1,369.50$
- 39. 214.50$ 3,316.50$ Mama's Pantry Rent 200.00$ 248.00$ 488.00$ 560.00$ 776.00$ 248.00$ 2,520.00$ Contribution Margin -$ -$ -$ (200.00)$ 2,824.27$ 7,010.22$ 7,798.27$ 11,705.86$ 2,966.20$ -$ -$ -$ 32,104.82$ Insurance (Vehicle) 1,500.00$ 1,500.00$ Registration 150.00$ 500.00$ 650.00$ Licensing 340.00$ 340.00$ Depreciation 6,425.25$ 6,425.25$ Miscellaneous -$ Earning before tax (1,650.00)$ (500.00)$ -$ (540.00)$ 2,824.27$ 7,010.22$ 7,798.27$ 11,705.86$ 2,966.20$ -$ -$ (6,425.25)$ 23,189.58$ MDA percentage 282.43$
- 40. 701.02$ 779.83$ 1,170.59$ 296.62$ 3,230.48$ Earning after MDA payment (1,650.00)$ (500.00)$ -$ (540.00)$ 2,541.85$ 6,309.19$ 7,018.44$ 10,535.28$ 2,669.58$ -$ -$ (6,425.25)$ 19,959.10$ Taxes 0000 651.96$ 1,646.60$ 1,842.06$ 2,770.77$ 688.84$ 000 7,600.24$ Depreciation 10,000.00$ Net Income (1,650.00)$ (500.00)$ -$ (540.00)$ 1,889.89$ 4,662.60$ 5,176.38$ 7,764.51$ 1,980.73$ -$ -$ 3,574.75$ 22,358.86$ Fork The Pork Proforma Income Statement For the Year Ending 2016 Variable Expenses Fixed Expenses Year 1 Contribution Margin Income Statement
- 41. Quarter 1 Quarter 2 Quarter 3 Quarter 4 Sales -‐$ 17,769.53$ 41,223.33$ -‐$
- 47. -‐$ -‐$
- 60. 19,990.38$ Fork The Pork Proforma Income Statement For the Year Ending 2017 Year 1 Contribution Margin Income Statement Quarter 1Quarter 2Quarter 3Quarter 4 Sales -$
- 61. 17,769.53$ 41,223.33$ -$ Cost of Good Sold -$ 5,655.33$ 13,119.73$ Variable Expenses Labor -$ 858.00$ 2,458.50$ -$ Mama's Pantry Rent -$ 936.00$ 1,584.00$ -$ Contribution Margin -$ 10,320.20$ 24,061.10$ -$ Fixed Expenses Insurance (Vehicle) 1,500.00$ -$ -$ -$ Registration 650.00$ -$ -$ -$ Licensing -$ 340.00$ -$ -$
- 62. Depreciation -$ -$ -$ 10,000.00$ Capital Expenditures 500.00$ -$ -$ -$ Miscellaneous -$ 500.00$ -$ -$ Earning before tax (2,650.00)$ 9,480.20$ 24,061.10$ (10,000.00)$ MDA percentage -$ 948.02$ 2,406.11$ -$ Earning after MDA payment (2,650.00)$ 8,532.18$ 21,654.99$ (10,000.00)$ Taxes 0 2,133.04$ 5,413.75$ 0 Depreciation -$ -$ -$ 10,000.00$ Total Net Income (2,650.00)$ 6,399.13$ 16,241.25$ -$
- 63. 19,990.38$ Fork The Pork Proforma Income Statement For the Year Ending 2017 Year 1 Contribution Margin Income Statement Quarter 1 Quarter 2 Quarter 3 Quarter 4 Sales -‐$ 18,835.70$ 43,696.74$
- 75. -‐$ -‐$ -‐$
- 80. Taxes 0 2,296.59$ 5,793.15$ 0 Depreciation -‐$ -‐$
- 83. Ending 2018 Year 1 Contribution Margin Income Statement Quarter 1Quarter 2Quarter 3Quarter 4 Sales -$ 18,835.70$ 43,696.74$ -$ Cost of Good Sold -$ 5,994.65$ 13,906.91$ Variable Expenses Labor -$ 858.00$ 2,458.50$ -$ Mama's Pantry Rent -$ 936.00$ 1,584.00$ -$ Contribution Margin -$ 11,047.05$ 25,747.32$ -$ Fixed Expenses Insurance (Vehicle) 1,500.00$ -$ -$ -$ Registration 650.00$ -$ -$ -$
- 84. Licensing -$ 340.00$ -$ -$ Depreciation -$ -$ -$ 10,000.00$ Capital Expenditures 500.00$ -$ -$ -$ Miscellaneous -$ 500.00$ -$ -$ Earning before tax (2,650.00)$ 10,207.05$ 25,747.32$ (10,000.00)$ MDA percentage -$ 1,020.71$ 2,574.73$ -$ Earning after MDA payment (2,650.00)$ 9,186.35$ 23,172.59$ (10,000.00)$ Taxes 0 2,296.59$ 5,793.15$ 0 Depreciation -$ -$ -$
- 85. 10,000.00$ Total Net Income (2,650.00)$ 6,889.76$ 17,379.44$ -$ 21,619.20$ Fork The Pork Proforma Income Statement For the Year Ending 2018 Jan. Feb. Mar. Apr. May June July Aug Sept. Oct. Nov. Dec. Cash Reciepts Revenue $0.00 $0.00 $0.00 $0.00 $4,748.55 $12,015.16 $13,542.95 $20,317.66 $5,029.33 $0.00 $0.00 $0.00 Depreciation $0.00 $0.00 $0.00 $0.00 $0.00 $0.00 $0.00 $0.00 $0.00 $0.00 $0.00 $10,000.00 Operating Cash Flow $0.00 $0.00 $0.00 $0.00 $4,748.55 $12,015.16 $13,542.95 $20,317.66 $5,029.33 $0.00 $0.00 $10,000.00 Financing Equity $75,000.00 Loan Financing Cash Flow $75,000.00 Cash Disbursements Inventory $0.00 $0.00 $0.00 $377.82 $2,089.44 $3,945.50 $4,849.21 $4,849.72 $1,600.63 Rent $0.00 $0.00 $0.00 $200.00 $248.00 $488.00 $560.00 $776.00 $248.00 $0.00 $0.00 $0.00 Wages $0.00 $0.00 $0.00 $0.00 $165.00 $693.00 $874.50 $1,369.50 $214.50 $0.00 $0.00 $0.00
- 86. Capital expenditures $50,000.00 $14,252.46 Insurance $1,500.00 Licensing $340.00 Registration $150.00 $500.00 MDA payment $282.43 $701.02 $779.83 $1,170.59 $296.62 Taxes 0 0 0 0 $651.96 $1,646.60 $1,842.06 $2,770.77 $688.84 0 0 0 Total Cash Disbursements $51,650.00 $14,752.46 $0.00 $917.82 $2,784.87 $5,827.52 $7,063.53 $8,165.81 $2,359.75 $0.00 $0.00 $0.00 Net Cash Flow $23,350.00 -‐$14,752.46 $0.00 -‐$917.82 $1,963.68 $6,187.64 $6,479.41 $12,151.85 $2,669.58 $0.00 $0.00 $10,000.00 Begin cash balance $0.00 $23,350.00 $8,597.54 $8,597.54 $7,679.72 $9,643.40 $15,831.04 $22,310.45 $34,462.30 $37,131.88 $37,131.88 $37,131.88 Cash reciepts $75,000.00 $0.00 $0.00 $0.00 $4,748.55 $12,015.16 $13,542.95 $20,317.66 $5,029.33 $0.00 $0.00 $10,000.00 Cash disbursements $51,650.00 $14,752.46 $0.00 $917.82 $2,784.87 $5,827.52 $7,063.53 $8,165.81 $2,359.75 $0.00 $0.00 $0.00 End cash balance $23,350.00 $8,597.54 $8,597.54 $7,679.72 $9,643.40 $15,831.04 $22,310.45 $34,462.30 $37,131.88 $37,131.88 $37,131.88 $47,131.88
- 87. Pro Forma Cash Flow Statement For Year Ending 2016 Jan.Feb.Mar.Apr.MayJuneJulyAugSept.Oct.Nov.Dec. Cash Reciepts Revenue $0.00$0.00$0.00$0.00$4,748.55$12,015.16$13,542.95$20,317.6 6$5,029.33$0.00$0.00$0.00 Depreciation $0.00$0.00$0.00$0.00$0.00$0.00$0.00$0.00$0.00$0.00$0.00$1 0,000.00 Operating Cash Flow $0.00$0.00$0.00$0.00$4,748.55$12,015.16$13,542.95$20,317.6 6$5,029.33$0.00$0.00$10,000.00 Financing Equity $75,000.00 Loan Financing Cash Flow $75,000.00 Cash Disbursements Inventory $0.00$0.00$0.00$377.82$2,089.44$3,945.50$4,849.21$4,849.72 $1,600.63 Rent $0.00$0.00$0.00$200.00$248.00$488.00$560.00$776.00$248.00 $0.00$0.00$0.00 Wages $0.00$0.00$0.00$0.00$165.00$693.00$874.50$1,369.50$214.50 $0.00$0.00$0.00
- 88. Capital expenditures $50,000.00$14,252.46 Insurance $1,500.00 Licensing $340.00 Registration $150.00$500.00 MDA payment $282.43$701.02$779.83$1,170.59$296.62 Taxes 0000 $651.96$1,646.60$1,842.06$2,770.77$688.84000 Total Cash Disbursements$51,650.00$14,752.46$0.00$917.82$2,784.8 7$5,827.52$7,063.53$8,165.81$2,359.75$0.00$0.00$0.00 Net Cash Flow $23,350.00-$14,752.46$0.00- $917.82$1,963.68$6,187.64$6,479.41$12,151.85$2,669.58$0.00 $0.00$10,000.00 Begin cash balance $0.00$23,350.00$8,597.54$8,597.54$7,679.72$9,643.40$15,831 .04$22,310.45$34,462.30$37,131.88$37,131.88$37,131.88 Cash reciepts $75,000.00$0.00$0.00$0.00$4,748.55$12,015.16$13,542.95$20, 317.66$5,029.33$0.00$0.00$10,000.00 Cash disbursements $51,650.00$14,752.46$0.00$917.82$2,784.87$5,827.52$7,063.5 3$8,165.81$2,359.75$0.00$0.00$0.00 End cash balance $23,350.00$8,597.54$8,597.54$7,679.72$9,643.40$15,831.04$2 2,310.45$34,462.30$37,131.88$37,131.88$37,131.88$47,131.88 Pro Forma Cash FlowStatement For Year Ending 2016 Quarter 1 Quarter 2 Quarter 3 Quarter 4 Cash Reciepts Revenue $0.00 $17,769.53 $41,223.33 $0.00
- 89. Depreciation $0.00 $0.00 $0.00 $10,000.00 Operating Cash Flow $0.00 $17,769.53 $41,223.33 $10,000.00 Financing Equity Loan Financing Cash Flow $0.00 $0.00 $0.00 $0.00 Cash Disbursements Inventory $0.00 $5,655.33 $13,119.73 $0.00 Rent $0.00 $936.00 $1,584.00 $0.00 Wages $0.00 $858.00 $2,458.50 $0.00 Capital Expenditures $500.00 $0.00 $0.00 $0.00 Miscellaneous $0.00 $500.00 $0.00 $0.00 Insurance $1,500.00 $0.00 $0.00 $0.00 Licensing $0.00 $340.00 $0.00 $0.00 Regristration $650.00 $0.00 $0.00 $0.00 MDA payment $0.00 $948.02 $2,406.11 $0.00 Taxes $0.00 $2,133.04 Total Cash Disbursements $2,000.00 $8,289.33 $17,162.23 $0.00 Net Cash Flow -‐$2,000.00 $9,480.20 $24,061.10 $10,000.00 Begin cash balance $47,131.88 $45,131.88 $54,612.08 $78,673.19 Cash
- 90. reciepts $0.00 $17,769.53 $41,223.33 $10,000.00 Cash disbursements $2,000.00 $8,289.33 $17,162.23 $0.00 End cash balance $45,131.88 $54,612.08 $78,673.19 $88,673.19 For the Year Ending 2017 Quarter 1Quarter 2Quarter 3Quarter 4 Cash Reciepts Revenue $0.00$17,769.53$41,223.33$0.00 Depreciation $0.00$0.00$0.00$10,000.00 Operating Cash Flow $0.00$17,769.53$41,223.33$10,000.00 Financing Equity Loan Financing Cash Flow $0.00$0.00$0.00$0.00 Cash Disbursements Inventory $0.00$5,655.33$13,119.73$0.00 Rent $0.00$936.00$1,584.00$0.00 Wages $0.00$858.00$2,458.50$0.00 Capital Expenditures $500.00$0.00$0.00$0.00 Miscellaneous $0.00$500.00$0.00$0.00 Insurance $1,500.00$0.00$0.00$0.00 Licensing $0.00$340.00$0.00$0.00 Regristration $650.00$0.00$0.00$0.00 MDA payment $0.00$948.02$2,406.11$0.00 Taxes $0.00$2,133.04 Total Cash Disbursements$2,000.00$8,289.33$17,162.23$0.00 Net Cash Flow -$2,000.00$9,480.20$24,061.10$10,000.00
- 91. Begin cash balance $47,131.88$45,131.88$54,612.08$78,673.19 Cash reciepts $0.00$17,769.53$41,223.33$10,000.00 Cash disbursements $2,000.00$8,289.33$17,162.23$0.00 End cash balance $45,131.88$54,612.08$78,673.19$88,673.19 For the Year Ending 2017 Quarter 1 Quarter 2 Quarter 3 Quarter 4 Cash Reciepts Revenue $0.00 $18,835.70 $43,696.74 $0.00 Depreciation $0.00 $0.00 $0.00 $10,000.00 Operating Cash Flow $0.00 $18,835.70 $43,696.74 $10,000.00 Financing Equity Loan Financing Cash Flow $0.00 $0.00 $0.00 $0.00 Cash Disbursements Inventory $0.00 $5,994.65 $13,906.91 $0.00 Rent $0.00 $936.00 $1,584.00 $0.00 Wages $0.00 $858.00 $2,458.50 $0.00 Capital Expenditures $500.00 $0.00 $0.00 $0.00 Miscellaneous $0.00 $500.00 $0.00 $0.00 Insurance $1,500.00 $0.00 $0.00 $0.00
- 92. Licensing $0.00 $340.00 $0.00 $0.00 Regristration $650.00 $0.00 $0.00 $0.00 MDA payment $0.00 $1,020.71 $2,574.73 $0.00 Taxes 0 $2,296.59 $5,793.15 0 Total Cash Disbursements $2,000.00 $8,628.65 $17,949.41 $0.00 Net Cash Flow -‐$2,000.00 $10,207.05 $25,747.32 $10,000.00 Begin cash balance $88,673.19 $86,673.19 $96,880.24 $122,627.56 Cash reciepts $0.00 $18,835.70 $43,696.74 $10,000.00 Cash disbursements $2,000.00 $8,628.65 $17,949.41 $0.00 End cash balance $86,673.19 $96,880.24 $122,627.56 $132,627.56 Fork The Pork Pro Forma Cash Flow Statement For the Year Ending
- 93. 2018 Quarter 1Quarter 2Quarter 3Quarter 4 Cash Reciepts Revenue $0.00$18,835.70$43,696.74$0.00 Depreciation $0.00$0.00$0.00$10,000.00 Operating Cash Flow $0.00$18,835.70$43,696.74$10,000.00 Financing Equity Loan Financing Cash Flow $0.00$0.00$0.00$0.00 Cash Disbursements Inventory $0.00$5,994.65$13,906.91$0.00 Rent $0.00$936.00$1,584.00$0.00 Wages $0.00$858.00$2,458.50$0.00 Capital Expenditures $500.00$0.00$0.00$0.00 Miscellaneous $0.00$500.00$0.00$0.00 Insurance $1,500.00$0.00$0.00$0.00 Licensing $0.00$340.00$0.00$0.00 Regristration $650.00$0.00$0.00$0.00 MDA payment $0.00$1,020.71$2,574.73$0.00 Taxes 0$2,296.59$5,793.150 Total Cash Disbursements$2,000.00$8,628.65$17,949.41$0.00 Net Cash Flow -$2,000.00$10,207.05$25,747.32$10,000.00 Begin cash balance $88,673.19$86,673.19$96,880.24$122,627.56 Cash reciepts $0.00$18,835.70$43,696.74$10,000.00 Cash disbursements $2,000.00$8,628.65$17,949.41$0.00 End cash balance $86,673.19$96,880.24$122,627.56$132,627.56 Fork The Pork Pro Forma Cash FlowStatement For the Year Ending 2018 If we cant make it to events Event
- 94. Events / Year Estimated Customers Estimated Oportunity Cost/Event Oportunity Cost for all Events Roots Fest11013(8,935.31)$ (8,935.31)$ Out to Lunch13180(1,588.50)$ (20,650.50)$ Downtown Tonight13186(1,644.24)$ (21,375.08)$ Hemp Fest1613(5,412.67)$ (5,412.67)$ Garden City Brewfest1579(5,110.48)$ (5,110.48)$ Labor (hours) April May June July August Sept Service 0 8 24 30 47 10 Prep 0 2 12 15 24 2 Close 0 1 6 8 12 1 0 11 42 53 83 13 Labor Cost -‐$
- 99. Labor (hours) AprilMay JuneJulyAugustSept Service 0824304710 Prep 021215242 Close 0168121 01142538313 Labor Cost-$ 165.00$ 693.00$ 874.50$ 1,369.50$ 214.50$ Tax 16.50$ 69.30$ 87.45$ 136.95$ 21.45$ Total Labor Cost 181.50$ 762.30$ 961.95$ 1,506.45$ 235.95$ Menu Item Cost Pulled Pork Slider(1/2 lb) Beef Brisket(1/2 lb) Baby
- 100. Back Rib plate (half rack) Coleslaw Beans Fries Lemonade/Iced Tea Meat (.5lb.;.5lb;1.5lb) 0.83$ 1.88$
- 101. 3.20$
- 102. $0.03 $0.09 $0.08 $0.01 Sauce (2 tbsb; 2
- 104. 0.60$
- 105. -‐$
- 106. $0.00 -‐$ -‐$
- 107. Bread (1 roll) 0.25$ 0 0 -‐$
- 108. -‐$ Plate/cup 0.02$
- 109. 0.02$
- 110. 0.02$
- 111. 0.02$ 0.02$
- 112. 0.02$ 0.02$
- 113. Napkins 0.01$ 0.01$
- 114. 0.01$
- 115. 0.01$
- 116. 1.41$ 2.21$
- 117. 3.83$
- 118. 0.05$
- 119. 0.11$ 0.11$ 0.03$
- 120. Estimated % of Sales 45% 20% 35% 20% 20% 20% 55% Estimated Spillage/Waste 0.12$
- 122. Total Spillage/waste 843.44$ Menu Item Cost Pulled Pork Slider(1/2 lb)Beef Brisket(1/2 lb)Baby Back Rib plate (half rack)ColeslawBeansFriesLemonade/Iced Tea Meat (.5lb.;.5lb;1.5lb) 0.83$ 1.88$
- 123. 3.20$ $0.03$0.09$0.08$0.01 Sauce (2 tbsb; 2 tbsb; 4 tbsb) 0.30$ 0.30$ 0.60$ -$ $0.00-$ -$ Bread (1 roll) 0.25$ 00-$ -$ Plate/cup 0.02$ 0.02$ 0.02$ 0.02$ 0.02$ 0.02$
- 124. 0.02$ Napkins 0.01$ 0.01$ 0.01$ 0.01$ 1.41$ 2.21$ 3.83$ 0.05$ 0.11$ 0.11$ 0.03$ Estimated % of Sales 45% 20% 35%20%20%20% 55% Estimated Spillage/Waste 0.12$ Weighted Average COGS 2.61$ Total Spillage/waste 843.44$
- 125. Sauce Cost (2 Gallons) Quantity (cups) Ingredient Cost 16 Ketchup 4.14$ 5.5 Brown sugar 1.48$
- 126. 5.5 Vinegar 1.18$ 1 Chili Powder 2.54$ 0.125 Cayenne Pepper 0.32$
- 127. 1 Paprika 2.54$ 0.125 Pepper 0.16$ 0.125 Salt 0.13$
- 128. 1 Granulated Garlic 0.33$ 1 Granulated Onion 2.54$
- 129. 0.0625 Liquid Smoke 0.70$ 1 Molasses 0.20$ 32.4375 16.26$
- 131. 1 gallon=128fl. Ounces 8 Sauce Cost (2 Gallons) Quantity (cups)Ingredient Cost 16Ketchup 4.14$ 5.5Brown sugar 1.48$ 5.5Vinegar 1.18$ 1Chili Powder 2.54$ 0.125Cayenne Pepper 0.32$ 1Paprika 2.54$ 0.125Pepper 0.16$ 0.125Salt 0.13$ 1Granulated Garlic 0.33$ 1Granulated Onion 2.54$ 0.0625Liquid Smoke 0.70$ 1Molasses 0.20$ 32.4375 16.26$ Gallon Cost 1.02$
- 132. 1 16 ounce bottle 1.08$ 1 gallon=128fl. Ounces 8