ECG details- for Students
•
2 likes•234 views

A to Z about ECG

Recommended
More Related Content
What's hot
What's hot (20)
Similar to ECG details- for Students
Similar to ECG details- for Students (20)
More from Chitwan Medical College, School of Nursing
More from Chitwan Medical College, School of Nursing (9)
Recently uploaded
Recently uploaded (20)
ECG details- for Students
- 1. ECG Asst. Prof. Bhaumika Sharma Chitwan Medical College
- 2. Introduction • The standard 12-lead electrocardiogram (ECG) is one of the most commonly used medical studies in the assessment of cardiovascular disease. • It is the most important test for interpretation of the cardiac rhythm, detection of myocardial ischemia and infarction, conduction system abnormalities, preexcitation, long QT syndromes, atrial abnormalities, ventricular hypertrophy, pericarditis, and other conditions.
- 3. Positioning • The standard 12-lead ECG is generally performed with the patient lying quietly in the supine position. • Care should be taken to ensure that the skin is clean and trimmed of excess hair in the areas in which the leads are to be placed. • In some instances, a mild abrasive pad can be used to prepare the skin in these areas to aid in apposition of the leads.
- 4. Technique After preparation of the patient, apply the electrocardiographic (ECG) leads in the manner outlined below. • It is recommended that the standard limb leads are placed one on each limb distal to the shoulders and hips, but they do not necessarily need to be as far distal as the wrists and ankles. • Next, apply the precordial leads, taking care to be as precise as possible in their positioning.
- 5. Contd. • Lead V1: place at the 4th ICS at right sternal border (RSB). • Lead V2: place at the LSB, directly across from lead V1, also in the 4th ICS. • Lead V4: place in the 5th ICS at the mid clavicular line, • And then lead V3: place midway between leads V2 and V4.
- 6. Contd. • Lead V6: place in the horizontal plane of V4 at the mid-axillary line, • And then lead V5: placed in the same horizontal plane as that of lead V4 in the anterior axillary line or midway between leads V4 and V6 when the anterior axillary line is not readily discernible.
- 7. Electrode label Electrode placement RA (Red) On the right arm, avoiding thick muscle. LA(Yellow) In the same location that RA was placed, but on the left arm this time. LL (Green) On the left leg, lateral calf muscle. RL (Black) On the right leg, lateral calf muscle V1 In the fourth intercostal space (between ribs 4 & 5) just to the right of the sternum V2 In the fourth intercostal space (between ribs 4 & 5) just to the left of the sternum. V3 Between leads V2 and V4. V4 In the fifth intercostal space (between ribs 5 & 6) in the mid-clavicular line . V5 Horizontally even with V4, but in the anterior axillary line V6 Horizontally even with V4 and V5 in the midaxillary line.
- 9. Contd. • Note that precordial electrode placement in women with large breasts can be problematic due to obfuscation (confusion) of bony landmarks. • Therefore, it is recommended that the electrodes be placed beneath, rather than overlying, the breast.
- 10. Placement of electrodes ➢Ten electrodes are used for a 12-lead ECG. The electrodes usually consist of a conducting gel, embedded in the middle of a self-adhesive pad onto which cables clip. Sometimes the gel also forms the adhesive. ➢Proper placement of the limb electrodes, color coded as recommended. ➢Note that the limb electrodes can be far down on the limbs or close to the hips/shoulders, but they must be even (left vs. right).
- 11. Post-procedure • Once the ECG is completed, it should be reviewed by the operator. • If significant issues with the quality of the tracing exist, the cause of the issue should be addressed and the tracing repeated. • After having obtained an acceptable tracing, remove the ECG leads and help the patient off the examination table. • In the event that the adhesive from the electrodes is not easily removed from the skin, the patient may be given an alcohol pad or moist paper towel to aid in its removal.
- 12. Basics • It is possible to change the output of most galvanometer (ECG devices) but it is standard to represent each mV on the y axis as 10 mm and each second as 25mm on the x-axis (that is a paper speed of 25mm/s). • At a paper speed of 25 mm/s, one small block of ECG paper translates into 40 ms. Five small blocks make up one large block, which translates into 200 ms. Hence, there are 5 large blocks /s • A standard signal of 1 mV must move the stylus vertically 10 mm, that is two large squares on ECG paper.
- 15. Contd. • For a routine analysis of the heart’s electrical activity an ECG recorded from 12 separate leads is used. • A 12-lead ECG consists of three bipolar limb leads (I, II, and III), the unipolar limb leads (AVR, AVL, and AVF), and six unipolar chest leads, also called precordial or V leads, (v1, v2, v3, v4, v5 and v6).
- 16. • With these V leads, the second site is -0- so there is no need to measure from two pointes, only one point is needed. • To obtain the measurements from these V leads, you simply turn the dial on the EKG machine to aVR, aVL, and aVF, respectively.
- 17. Normal Impulse Conduction Sinoatrial node AV node Bundle of His Bundle Branches Purkinje fibers
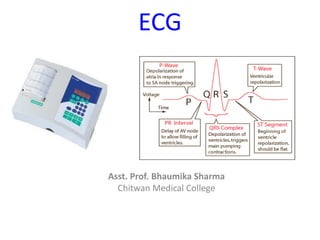
- 19. Facts • A typical ECG tracing of the cardiac cycle (heartbeat) consists of a P wave, a QRS complex, a T wave, and a U wave which is normally visible in 50 to 75% of ECGs. • The baseline voltage of the electrocardiogram is known as the isoelectric line. Typically the isoelectric line is measured as the portion of the tracing following the T wave and preceding the next P wave.
- 20. Analyzing ECG • Standardized: 25 mm/s & 1mV= 10mm • Rate, rhythm, axis • 4 waves- P, Q, T & U • 4 intervals- P-R, Q-T, QRS & R-R • 2 segments- P-R & S-T,
- 24. Waves & Interval • P wave represents the sequential activation of the right and left atria, and it is common to see notched or biphasic P waves of right and left atrial activation – P duration < 0.12 sec/ – P amplitude < 2.5 mm QRS Complex The QRS represents the simultaneous activation of the right and left ventricles, although most of the QRS waveform is derived from the larger left ventricular musculature.
- 25. Waves • The T wave represents the repolarization (or recovery) of the ventricles. • The normal T wave is usually in the same direction as the QRS except in the right precordial leads. In the normal ECG the T wave is always upright in leads I, II, V3-6, and always inverted in lead aVR. • The U wave is not always seen. It is typically low amplitude, and, by definition, follows the T wave.
- 26. Waves & Interval Normal PR interval Measured from the beginning of the P wave to the beginning of the QRS complex. The PR interval reflects the time the electrical impulse takes to travel from the sinus node through the AV node and entering the ventricles. The PR interval is therefore a good estimate of AV node function 0.12 to 0.20 s (3 - 5 small squares) Normal QRS complex < 0.12 s duration (3 small squares)
- 27. Waves & Interval • Normal QT interval –Measured from the beginning of the QRS complex to the end of the T wave. –A prolonged QT interval is a risk factor for ventricular tachyarrhythmias and sudden death. It varies with heart rate and for clinical relevance requires a correction for this, giving the QTc. –Normal = 0.42 s. (2 big square)
- 28. ECG Grid
- 31. Normal Sinus Rhythm (NSR) • Etiology: the electrical impulse is formed in the SA node and conducted normally. • This is the normal rhythm of the heart; other rhythms that do not conduct via the typical pathway are called arrhythmias.
- 32. Normal sinus Parameters • Rate 60 - 100 bpm • Regularity regular • P waves normal • PR interval 0.12 - 0.20 s • QRS duration 0.04 - 0.12 s Any deviation from above is sinus tachycardia, sinus bradycardia or an arrhythmia
- 33. P wave • The P wave represents the electrical impulse starting in the sinus node and spreading through the atria. • P wave represents atrial muscle depolarization. • It is normally <2.5 mm in height • Duration: <0.12 second
- 34. QRS complex • The QRS complex represents ventricular muscle depolarization • The first negative deflection after the P wave is the Q wave, which is normally less than 0.04 second in duration and less than 25% of the R wave amplitude; • The first positive deflection after the P wave is the R wave • The S wave is the first negative deflection after the R wave. • The QRS complex is normally less than 0.12 seconds
- 35. T wave • The T wave represents ventricular muscle repolarization (when the cells regain a negative charge; also called the resting state). • It follows the QRS complex and is usually the same direction as the QRS complex.
- 36. U WAVE • The U wave is thought to represent repolarization of the Purkinje fibers, but it sometimes is seen in patients with hypokalemia (low potassium levels)
- 37. Waves & Interval Normal PR interval Measured from the beginning of the P wave to the beginning of the QRS complex. The PR interval reflects the time the electrical impulse takes to travel from the sinus node through the AV node and entering the ventricles. 0.12 to 0.20 s (3 - 5 small squares) normal QRS complex < 0.12 s duration (3 small squares)
- 38. RR interval • The RR interval is measured from one QRS complex to the next QRS complex. • The RR interval is used to determine ventricular rate and rhythm
- 39. Waves & Interval • Normal QT interval – measured from the beginning of the QRS complex to the end of the T wave. – A prolonged QT interval is a risk factor for ventricular tachyarrhythmias and sudden death. It varies with heart rate and for clinical relevance requires a correction for this, giving the QTc. – Normal = 0.42 s. (2 big square)
- 40. CALCULATION OF HEART RATE 0.2 sec for 1 heart beat 1sec=1/0.2 b 60sec=1/0.2*60=300 • count small or large square between two RR interval – small = 1500 /small square, large = 300/large square • Eg 1500/15=100, 300/3=100 • 1500/25 =60 300/5=60 if irregular count QRS complex in 30 large square = 6 sec. multiply by 10 sinus rhthm :- normal 60 -100 bpm
- 41. Normal Sinus Rhythm Implies normal sequence of conduction, originating in the sinus node and proceeding to the ventricles via the AV node and His- Purkinje system. EKG Characteristics: Regular narrow-complex rhythm Rate 60-100 bpm Each QRS complex is proceeded by a P wave www.uptodate.com
- 42. End PART-1
- 45. Sinus Bradycardia 30 bpm• Rate? • Regularity? regular normal 0.10 s • P waves? • PR interval? 0.12 s • QRS duration? Interpretation- Sinus Bradycardia
- 46. Sinus Tachycardia • Etiology: SA node is depolarizing faster than normal, impulse is conducted normally. • Sinus tachycardia begins with regular rhythm between 100-180 b/min • The P wave and QRS complex are normal duration . • Causes fever, heart failure, fluid loss hyperthyroidism, hypercalcemia, medicine e.g. atropine.
- 47. Rhythm #3 70 bpm• Rate? • Regularity? occasionally irreg. 2,7 different contour 0.08 s • P waves? • PR interval? 0.14 s (except 2,7) • QRS duration? Interpretation? NSR with Premature Atrial Contractions
- 48. Premature Atrial Contractions Deviation from NSR (normal sinus rhythm) These ectopic beats originate in the atria (but not in the SA node), therefore the contour of the P wave, the PR interval, and the timing are different than a normally generated pulse from the SA node
- 49. Rhythm #4 60 bpm• Rate? • Regularity? occasionally irreg. none for 7th QRS 0.08 s (7th wide) • P waves? • PR interval? 0.14 s • QRS duration? Interpretation? Normal Sinus Rhythm with 1 Premature Ventricular Complex
- 50. Premature Ventricular Contractions • Deviation from Normal Sinus Rhythm – Ectopic beats originate in the ventricles resulting in wide and bizarre QRS complexes. – When there are more than 1 premature beats and look alike, they are called “uniform”. When they look different, they are called “multiform”.
- 51. Atrial fibrillation Ventricular and atrial rate: Atrial rate is 300 to 600. Ventricular rate is usually 120 to 200 in untreated atrial fibrillation Ventricular and atrial rhythm: Highly irregular QRS shape and duration: Usually normal, but may be abnormal P wave: No discernible P waves; irregular undulating waves are seen and are referred to as fibrillatory or f waves PR interval: Cannot be measured P: QRS ratio: many1
- 52. Atrial fibrillation • Atrial fibrillation may occur for a very short time (paroxysmal), or it may be chronic. • Atrialfibrillation is usually associated with advanced age, valvular heart disease, coronary artery disease, hypertension, cardiomyopathy,
- 53. Atrial Flutter Ventricular and atrial rate: Atrial rate ranges between 250 and 400; ventricular rate usually ranges between 75 and 150. Ventricular and atrial rhythm: The atrial rhythm is regular; the ventricular rhythm is usually regular but may be irregular because of a change in the AV conduction. QRS shape and duration: Usually normal, but may be abnormal or may be absent P wave: Saw-toothed shape. These waves are referred to as F waves. PR interval: Multiple F waves may make it difficult to determine the PR interval. Causes are similar to that of atrial fibrillation.
- 54. Supra-ventricular Tachycardia Narrow complex tachycardia. Rate :150-250
- 55. Ventricular Tachycardia (VT) VT is usually associated with coronary artery disease and may precede ventricular fibrillation. Ventricular and atrial rate: Ventricular rate is 100 to 200 beats per minute; atrial rate depends on the underlying rhythm(eg, sinus rhythm) Ventricular and atrial rhythm: Usually regular; atrial rhythm may also be regular. QRS shape and duration: Duration is 0.12 seconds or more abnormal shape (Wide complex tachycardia)
- 57. Ventricular Fibrillation Causes of ventricular fibrillation are the same as for VT; it may also result from untreated or unsuccessfully treated VT. Ventricular rate: Greater than 300 per minute Ventricular rhythm: Extremely irregular, without specific pattern QRS shape and duration: Irregular, without recognizable QRS complexes
- 58. Right bundle branch block
- 59. RBBB
- 60. Left bundle branch block
- 61. LBBB
- 62. Views of the Heart Some leads get a good view of the: Anterior portion of the heart- (V1-4) Lateral portion of the heart- (I, aVL, V5-6) Inferior portion of the heart-(II, III, aVF)
- 64. Blood Supply of Heart Rt coronary artery: Inferior wall: II, III, AVF Lt coronary artery: LAD: anterior wall: V1, V2, V3, V4 Cx: Lateral wall: V5,V6, I, AVL
- 67. ST Elevation Infarction ST depression, peaked T-waves, then T- wave inversion The ECG changes seen with a ST elevation infarction are: Before injury Normal ECG ST elevation & appearance of Q- waves ST segments and T-waves return to normal, but Q-waves persist Ischemia Infarction Fibrosis
- 68. Non ST elevation
- 69. ST elevation MI
- 70. ST elevation MI
- 71. Non-ST Elevation Infarction Here’s an ECG of an evolving non-ST elevation MI: Note the ST depression and T-wave inversion in leads V2-V6. Question: What area of the heart is infarcting? Anterolateral
- 72. ST Elevation (cont) Elevation of the ST segment (greater than 1 small box) in 2 leads is consistent with a myocardial infarction.
- 73. Anterolateral MI This person’s MI involves both the anterior wall (V2- V4) and the lateral wall (V5-V6, I, and aVL)!
- 74. DIGOXIN TOXICITY Reverse ticks sign
- 76. DIGOXIN TOXICITY
- 77. HYPERKALEMIA
- 79. Thank You
- 80. Axis
- 81. 12 lead ECG
- 82. 12 lead ECG
- 83. Q wave
- 84. T wave