Downloaded 151 times
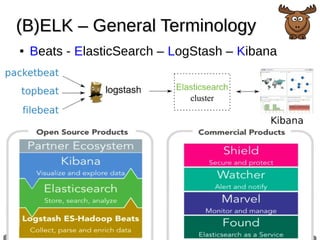
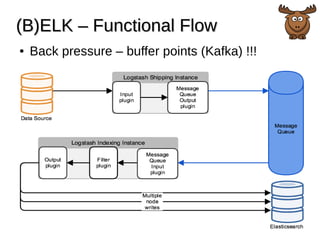
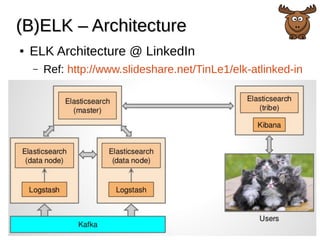
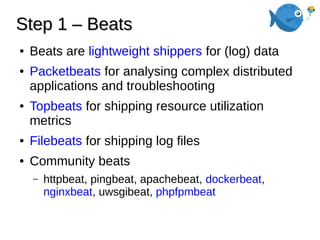

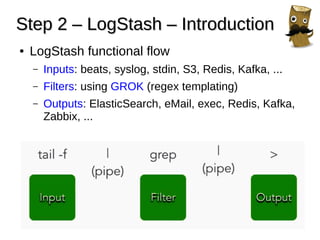
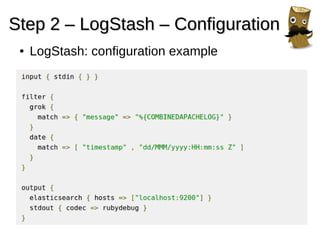
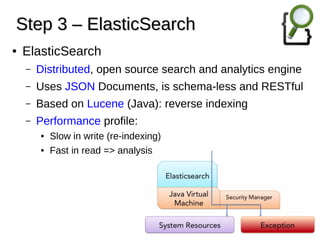

This document introduces the (B)ELK stack, which consists of Beats, Elasticsearch, Logstash, and Kibana. It describes each component and how they work together. Beats are lightweight data shippers that collect data from logs and systems. Logstash processes and transforms data from inputs like Beats. Elasticsearch stores and indexes the data. Kibana provides visualization and analytics capabilities. The document provides examples of using each tool and tips for working with the ELK stack.