
Recommended
More Related Content
What's hot
What's hot (20)
Viewers also liked
Viewers also liked (19)
Similar to Key reasons behind crude oil latest price
Similar to Key reasons behind crude oil latest price (20)
Recently uploaded
Recently uploaded (20)
Key reasons behind crude oil latest price
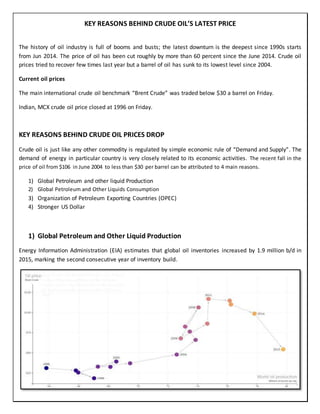
- 1. KEY REASONS BEHIND CRUDE OIL’S LATEST PRICE The history of oil industry is full of booms and busts; the latest downturn is the deepest since 1990s starts from Jun 2014. The price of oil has been cut roughly by more than 60 percent since the June 2014. Crude oil prices tried to recover few times last year but a barrel of oil has sunk to its lowest level since 2004. Current oil prices The main international crude oil benchmark “Brent Crude” was traded below $30 a barrel on Friday. Indian, MCX crude oil price closed at 1996 on Friday. KEY REASONS BEHIND CRUDE OIL PRICES DROP Crude oil is just like any other commodity is regulated by simple economic rule of “Demand and Supply”. The demand of energy in particular country is very closely related to its economic activities. The recent fall in the price of oil from $106 in June 2004 to less than $30 per barrel can be attributed to 4 main reasons. 1) Global Petroleum and other liquid Production 2) Global Petroleum and Other Liquids Consumption 3) Organization of Petroleum Exporting Countries (OPEC) 4) Stronger US Dollar 1) Global Petroleum and Other Liquid Production Energy Information Administration (EIA) estimates that global oil inventories increased by 1.9 million b/d in 2015, marking the second consecutive year of inventory build.
- 2. This oversupply has contributed to oil prices reaching the lowest monthly average level since mid-2004. Inventories are forecast to rise by an additional 0.7 million b/d in 2016, before the global oil market becomes relatively balanced in 2017. The first draw on global oil inventories in 15 consecutive quarters is expected in the third quarter of 2017. Below mentioned chart describes “world liquid fuels production and consumption balance” over the years. United States a largest crude oil consumer increased its domestic production from Shale formations by using Hydraulic Fracturing technique. US crude oil production has nearly doubled since 2010. Though it does not export crude oil, it now imports much less, creating a lot of spare supply. Saudi Arab, Nigeria and Algeria, who were selling crude oil in the United States, suddenly competing for Asian markets, and the producers are forced to drop prices. 2) Global Petroleum and Other Liquids Consumption While global supply of crude oil is increasing, demand for crude oil is decreasing due to weakening economies of Europe and developing countries such as China. Energy Information Administration (EIA) estimates global consumption of petroleum and other liquid fuels grew by 1.4 million b/d in 2015, averaging 93.8 million b/d for the year. EIA expects global consumption of petroleum and other liquid fuels to grow by 1.4 million b/d in both 2016 and 2017. Forecast real gross domestic product (GDP) for the world weighted by oil consumption, which increased by an estimated 2.4% in 2015, rises by 2.7% in 2016 and by 3.2% in 2017.
- 3. Global Petroleum and Other Liquids Production & Consumption Production/Consumption 2014 2015 2016 2017 Non-OPEC Production 56.09 57.41 56.77 56.68 OPEC Production 37.24 38.3 39.16 40.01 OPEC Crude Oil Portion 30.77 31.65 32.16 32.72 Total World Production 93.33 95.71 95.93 96.69 OECD Commercial Inventory (end-of-year) 2721 3061 3132 3131 Total OPEC surplus crude oil production capacity 2.07 1.59 1.97 1.91 OECD Consumption 45.73 46.28 46.63 46.99 Non-OECD Consumption 46.69 47.49 48.56 49.63 Total World Consumption 92.42 93.77 95.19 96.61 In million barrels per day 3) Organization of Petroleum Exporting Countries (OPEC) Organization of the Petroleum Exporting Countries (OPEC), a cartel of oil producers, is a leading factor in the sharp price drop of crude oil as they are unwilling to stabilize the oil markets. Prices of OPEC’s benchmark crude oil have fallen 50% since the organization decided not to reduce crude oil production in a meeting held in 2014 in Vienna. Saudi Arabia clearly told that, it does not want to reduce its market share despite falling crude oil prices. If OPEC does not cut production, the result is a further oversupply of oil, placing downward pressure on crude oil prices for the long term. According to Energy Information Administration (EIA), OPEC crude oil production averaged 31.6 million b/d in 2015, an increase of 0.9 million b/d from 2014. Iraq led the OPEC production increases. Its production rose by 0.7 million b/d in 2015. Saudi Arabia also boosted production to defend its share of the global oil market, with its production increasing by 0.3 million b/d in 2015.
- 4. 4) The Strong US Dollar The strong U.S. dollar has been the main driver for the price decline of crude oil over the last few years. The dollar is at a 12-year high against the euro, leading to appreciations in the U.S. dollar index and a reduction in oil prices. This puts the market under a lot of pressure, because when the value of the dollar is strong, the value of commodities falls. Global commodity prices are usually in dollars and fall when the U.S. dollar is strong. For example, the surge in the dollar in the second half of 2014 caused a sharp fall in the leading commodity indexes.