Download to read offline


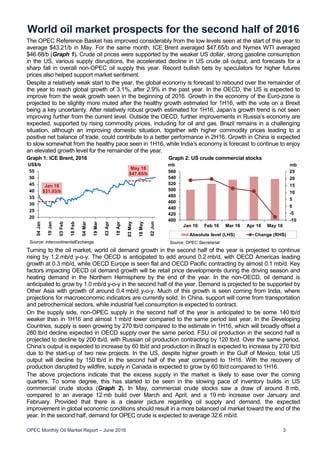

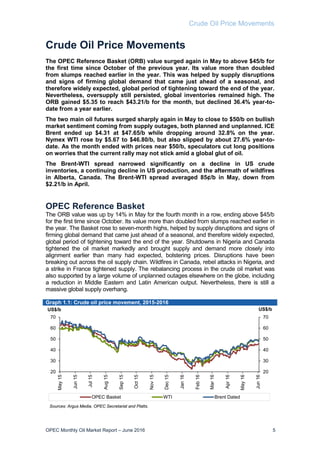
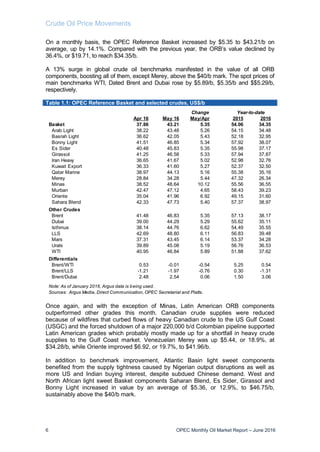
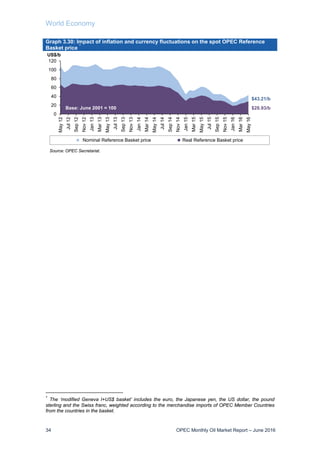

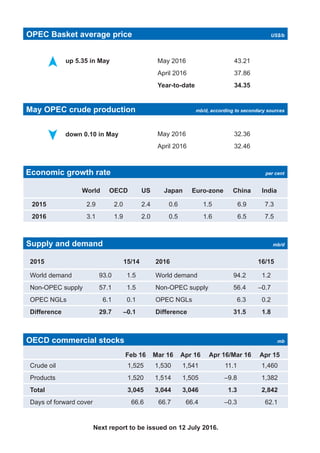

The OPEC Reference Basket averaged $43.21/b in May, up $5.35 from the previous month. Supply disruptions in Canada, Nigeria, and France tightened the market and supported prices. ICE Brent ended at $47.65/b and WTI at $46.80/b, both gaining over $4. The Brent-WTI spread narrowed significantly. Global demand is expected to seasonally tighten in the second half of the year, though oversupply persists with inventories remaining high.


