DRI Basic
•Download as PPT, PDF•
0 likes•863 views

DETECTION,RECOGNITION & IDENTIFICATION Range of a Thermal Camera.

Recommended
More Related Content
What's hot
What's hot (20)
Similar to DRI Basic
Similar to DRI Basic (20)
Recently uploaded
Recently uploaded (20)
DRI Basic
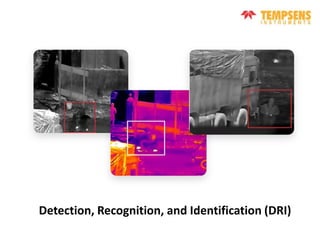
- 1. Detection, Recognition, and Identification (DRI)
- 2. What is DRI? DRI is a universally accepted set of standards providing a means of measuring the distance whereby a thermal sensor can produce an image of a specific target. This takes into consideration many different criterion such as noise, array size, optical blur, lens depletion, aperture, atmospheric depletion, detector pitch and many more.
- 3. Detection Detection means that you will be able to see the target, however it will be little more than a spec. Specifically it means that the target is visible on at least two pixels, and that there is a good chance that the target is actually something of suspicion. Detection: Ability to distinguish an object from the background. Recognition Recognition does not mean that you can recognize an individual. Recognition simply means that you are able to recognize an object’s class (is it a human or a car, is it a truck or a tank, etc). Identification Identification of an object means that you are able to differentiate between objects. For example, being able to identify the type of vehicle not just its class. Identification: ability to describe the object in details (a man with a hat, a deer, a Jeep.
- 4. The following pictures illustrate these definitions: Left image: Detection – At several kms, 2 targets are detected out of the background Center image: Recognition - a human is walking along the fence Right image: Identification – 2 males with trousers and jackets are identified – one is smoking.
- 5. • Thermal sensors have a resolution of 640×480 which is over 300,000 pixels. Human “detection” only requires 3.6 of those pixels and “identification” only requires 230 pixels, which is an extraordinarily small amount on the screen that can easily go unnoticed by the human eye.
- 6. The Johnson criteria Johnson defined thresholds, known as the Johnson criteria, as the minimum number of line pairs to detect, recognize or identify targets captured by scene imagers. The Johnson criteria was based on experiments using observers. It estimates the number of line pairs required across a target, and indicates that there is at least a 50% chance that an observer can accurately achieve the criteria. The Johnson criteria state the following thresholds that are achieved 50% of the time: • Detection: We need 1.0 +/− 0.25 line pairs to detect an object 50% of the time. • Recognition: The type object can be discerned, a person versus a car (4 +/− 0.8 line pairs) • Identification: A specific object can be discerned, a woman versus a man, the specific car (6.4 +/− 1.5 line pairs)
- 7. • He found that the minimum resolution required for a particular "decision response“ was nearly constant for a group of nine military targets. The results of these experiments are tabulated in Table 1. The data show that the minimum resolution required for a particular decision activity is a constant for nine military targets within a maximum error excursion of +25%.
- 8. • The methodology developed by Johnson was simple and straight forward. A target was moved to a range where it was just barely detectable. A bar pattern was placed in the field of view and its spatial frequency was increased until it could barely be resolved at the same range, i.e. the number of lines on the bar pattern was increased until they could no longer be distinguished. The spatial frequency of the pattern was specified in terms of the number of lines in the pattern subtended by the object's minimum dimension as illustrated in Figure 1. The same methodology was used for orientation, recognition and identification.
- 9. FACTORS INFLUENCING TARGET DETECTION AND RECOGNITION The scene 1. The size of the picture or displayed image. 2. Numbers, sizes, shapes, and scene distribution of areas contextually likely to contain the target object. 3. Scene objects: numbers, shapes and patterns, achromatic and color contrasts, colors, (hue, saturation, lightness), acutance, amount of resolved details, all both absolutely and relative to the target object. 4. Scene distribution of objects. 5. Granularity, noise. 6. Total available information content and amount of each type of information. 7. Average image brightness or lightness. 8. Contextual cues to target object location.
- 10. The target 1. Location in the image format. 2. Location in the scene 3. Shape and pattern. 4. Size, color, resolution(s), acutance, lightness or brightness. 5. Type and degree of isolation from background and objects. The observer 1. Training 2. Experience 3. Native ability 4. Instructions and task briefing 5. Search habits 6. Motivation 7. Compromise on speed versus accuracy 8. Assumptions.
- 11. Putting it all together If we ignore the effects of the atmosphere, normal recognition would be 25% of the detection and identification would be 12.5% of the detection range. Weather is almost never ideal so in reality these percentages are almost always reduced. “Ideal Conditions” Another thing that is often not mentioned is that these ratings are based on what is termed “ideal conditions” which rarely happen in the real world. The average environmental application will get 25% less than the distance that the thermal camera is rated for and in extreme conditions can be less than 10% of the rated distance.
- 12. Thermal camera characteristics influencing detection range • With Johnson criteria in mind, it is easy to understand that the spatial resolution of a camera is an important parameter determining the quality of the security system. The spatial resolution: is the camera’s ability to capture very small details at great distances. It is closely related to the number of camera pixels. Clearly, the more pixels there are, the better the spatial resolution will be and the greater the detection range will be. • However, the thermal sensitivity has also a high impact on detection performance. The thermal sensitivity is the ability to distinguish very small differences in temperature. The “cooled” IR cameras offer better thermal sensitivity than “uncooled” IR cameras. For the same number of pixels, the image of a “cooled” thermal camera is of better quality (i.e. less “noisy”) than an “uncooled” camera’s image.
- 13. Thermal camera characteristics influencing detection range • Left: image from a thermal imager with poor thermal sensitivity • Right: image from a cooled thermal camera with high thermal sensitivity
- 14. Another important characteristic of an infrared camera is the field of view (FOV). A large panoramic FOV is necessary in order to enhance the probability to detect a single event into a complete 360-degree scene. See in the picture below the image captured by a thermal sensor with a wide panoramic horizontal FOV, and, in green in the center, the area screened by a PTZ camera zoomed to a 2° FOV. It is clear that this PTZ camera has no chance at all to detect any event in this scenery. Thermal camera characteristics influencing detection range
- 15. Converting Line Pair to Pixels • How many line pairs do we need to detect something 100% of the time? First, let’s convert line pairs to pixels because the resolution of today’s cameras is specified in pixels rather than lines. • Line pair resolution is defined as at least one black and one white detection. Theoretically, you could have one pixel per line, but in reality, it requires more than 2 pixels. We need at least one pixel that detects black, a second that detects white, and a third that detects another black. At a minimum, we need at least 3 pixels to detect a small white object. However, there’s more to this. We need to take into account a certain amount of statistical uncertainty of a sensor picking up the signal.
- 16. The Kell Factor In the real world of detection, the white spot could appear somewhere in between the pixels of the sensor. This means we need more pixels to actually detect the small object. The concept of the uncertainty of where an object appears on a sensor was introduced in 1934 by Raymond Kell. It was first applied to sampling an image to avoid beat frequencies affecting the image. The Kell factor is a fudge factor that attempts to adjust for the uncertainty of analog sensors. The number has changed depending on how it is used. Kell said the number should be 0.64, but today people usually use 0.7. The Kell factor increases the number of pixels required. We adjust the pixels using the formula: pixels/ kell factor , 3 / 0.7 = 4.29 vertical pixels.
- 17. The Mesnik Factors Besides the Kell factor, there are other real-world factors that can affect what we see. For example, long-range lenses sometimes do not have the clarity they require to accommodate the higher resolution sensors. Other factors include low-light operation and atmospheric conditions that affect visibility. The atmospheric conditions can be very obvious like rain or fog or can be subtle like heat waves or higher humidity. The view can be reduced dramatically by fog, haze (smoke), rain, or snow. Unfortunately, the amount of reduced vision can vary depending on the intensity of fog or rain. Long range cameras must also be mounted to very stable platforms. Placing a camera on top of a tower can cause vibration that affects the clarity of the video. Some long-range cameras include image stabilization. There are electronic and mechanical mechanisms for stabilizing the cameras. We can adjust for some of these real-world visual problems. We have come up with the following factors that result in the need for increased pixel count for meeting the visual criteria.
- 18. • Lens factor: From 1 to 0.6 depending on the actual lens clarity selected • Low light noise factor: Thermal cameras are affected by the difference in temperature between the object and the background. • Atmospheric Factors: Heat waves and other clear day factors such as humidity increase with distance. • Atmospheric Distance Factor. These are all estimates of atmospheric effects on visibility. Actual visibility is affected by the difference in contrast between the object and the background. For distance less than 1000 m (0.62 miles) = 1.0 for distance between 1001m – 2000 m (1.24 miles) = 0.9, for distance 2001m to 3000 m (1.86 miles) = 0.85, for distance over 3001 m to 5000 m = 0.8 for distance 5,001 m to 10,000 m = 0.75 for distance 10,001 m (6.2 miles) to 15000 m (9.3 miles) = 0.7 for distance 15001m to 20000 m (12.4 miles) = 0.65
- 19. An example of using the factors: • The following example is a camera system used at night, that will observe objects about 2-miles away. We excluded severe atmospheric conditions such as fog that could reduce visibility dramatically. We calculated the pixel counts for a thermal camera with similar lens magnification. Reasonably good lens (costs a lot) = 0.9 Used at night: = 1.0 for thermal camera Distance = 3219 m (2 miles) = 0.8 – Total for Thermal = 0.9 x 1.0 x 0.8 = 0.72 – Total Pixels for Thermal Camera = 4.29 / 0.72 = 5.96 pixels Here’s the summary of the new DRI standard. Detection: 8 vertical pixels across the target Recognition: we require eight times the 4 line pairs or 32 vertical pixels across the target Identification: we need eight times the 8 line pairs = 64 vertical pixels across the target
- 21. • Spatial frequency is typically measured per cycles (or line pairs) per a unit angle or a unit length
- 22. Evaluation of ranges of effective surveillance • It is possible to measure directly detection, recognition, and identification ranges of a target of interest and to evaluate the tested thermal camera on the basis of the test results. However, it is a risky solution. The ranges vary with observation conditions (atmosphere, background) and it is relatively easy to manipulate with the detection, recognition and identification ranges at real conditions if the observation conditions are not very precisely specified. Next, it is difficult to compare test results of different thermal cameras tested at different time periods and at different observation conditions. • The safest way to evaluate surveillance thermal cameras is to measure MRTD of this thermal imager and calculate the detection, recognition, and identification ranges of a standard NATO target using methodology proposed by this standard: STANAG 4347. • The detection, recognition, and identification ranges of the standard NATO target are potentially a good criterion to be used in requirements on surveillance thermal imagers. It is apparently a good idea to present requirements on a surveillance thermal imager by presenting requirements on the performance ranges (Table)
- 23. In order to calculate the performance ranges of a thermal imager we must know its MRTD function. Therefore a more common way to specify requirements on surveillance thermal cameras is to present requirements on MRTD characteristic in a form shown in Table.
- 24. • Now, let us discuss the way to calculate the detection and recognition ranges on the basis of the measured and known MRTD function of the tested thermal camera using the recommendation from STANAG 4347. The summary of the recommendations is shown in Table.
- 25. • In details, the detection, recognition and identification ranges of the standard NATO targets can be calculated using the below presented algorithm. 1. Convert MRTD characteristic into a new one by changing variable from spatial frequency n [mrad-1] to the range R [km] using the following formulas 2. Calculate decrease in the initial temperature difference DT (it was assumed that initial = = 2 K) between the target and the background due to limited atmospheric transmission.
- 26. • Determine the respective nominal static ranges as the intersections of and the converted MRTD functions. calculation of the detection ranges of the standard NATO target using a thermal camera of MRTD function shown in Fig. The calculation results are shown in Fig. and we can conclude that the detection ranges are the following: 7.2 km at good atmospheric transmission. 2.8 km at limited atmospheric transmission. Calculation of the recognition and identification ranges can be done in the same manner.
- 28. A comparison between the ACQUIRE Model and the Johnson Criteria assuming standard N50 values for each discrimination level. The distance difference is measured at the 50% probability of detect and compares the difference between the Johnson Criteria and the AQUIRE Metric. These values were calculated for a system viewing a target of 0.75 meter height, with an imaging system having a 10 micron pixel and a 10 millimeter focal length.
- 29. Determine range for camouflaged targets • In 2004, the ACQUIRE-LC metric was introduced to determine range for camouflaged targets. Camouflage developers showed that camouflage did indeed have an impact on the range at which a target could be detected. New equations were set to govern the type of camouflage and amount of clutter in the scene. These can be seen in Equations.
- 30. THANK YOU…