
Recommended
More Related Content
What's hot
What's hot (20)
Similar to Ap l5b water cycle and hydrograph
Similar to Ap l5b water cycle and hydrograph (20)
More from andypinks
More from andypinks (20)
Recently uploaded
Recently uploaded (20)
Ap l5b water cycle and hydrograph
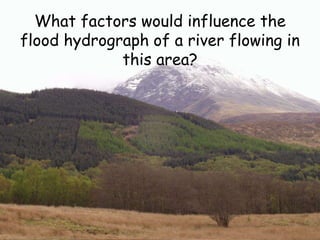
- 1. What factors would influence the flood hydrograph of a river flowing in this area?
- 2. DRAW your own hydrograph! TIME 1200 1230 1300 1330 1400 1430 1500 1530 1600 1630 1700 1730 1800 1830 1900 1930 1800 Rainfall 0 4 3 10 4 6 13 15 9 3 0 0 0 0 0 0 0 River discharge (cumecs) 1 1 2 2 6 10 20 50 52 55 90 98 100 90 55 22 10 Use the data above and on your sheet to draw an actual Hydrograph … you may need to finish it for Homework!
- 4. Two different Hydrographs A & B – can you describe them?
- 5. Hydrographs – on Showbie Compare these two hydrographs. Which one has the largest lag time? Explain your answer.
- 6. Have a go on your own 1. Read and complete 2. Write an explanation the star diagrams as to how the different factors affect discharge How can climate change affect discharge?
- 7. Amount and type of precipitation
- 8. Temperature
- 9. Temperature
- 10. Temperature
- 12. Relief
- 13. Relief
- 14. Rock Type
- 15. Land use
- 16. Land Use
- 17. Human Management
- 18. Human Management
- 19. Human Management
- 20. Hydrographs What could cause 2 peaks in a hydrograph?