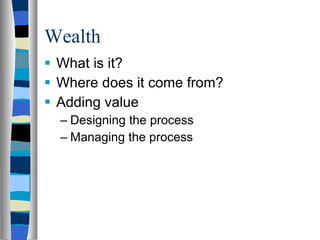
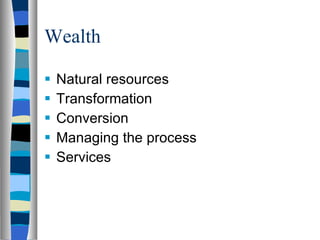
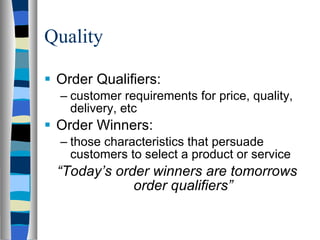
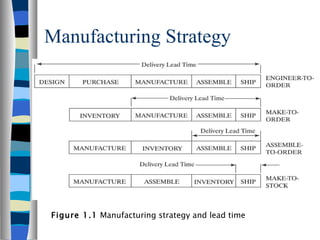
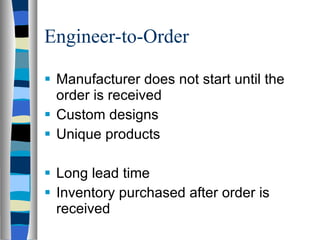
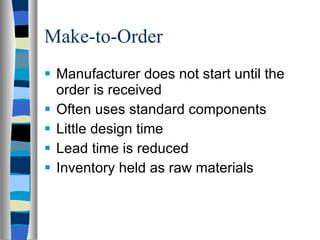
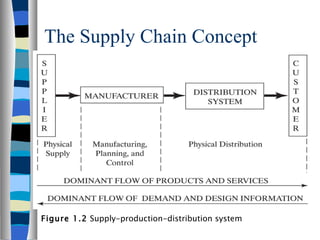
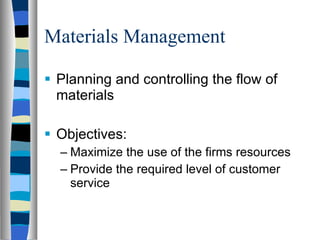
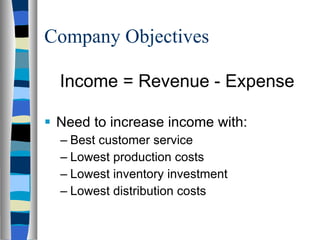
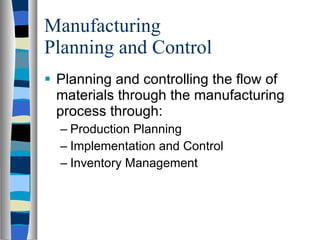
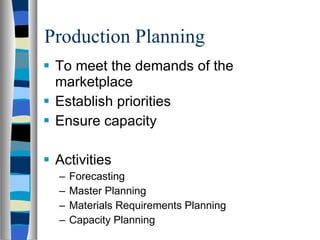
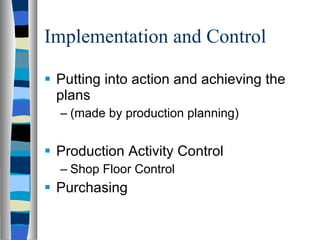
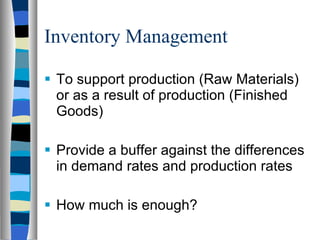
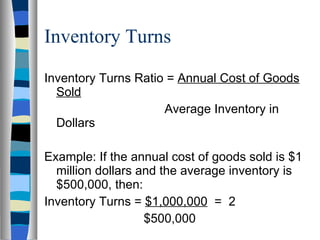
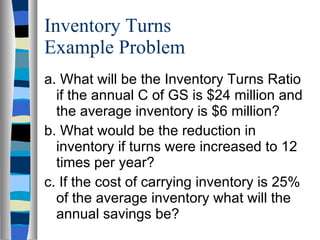
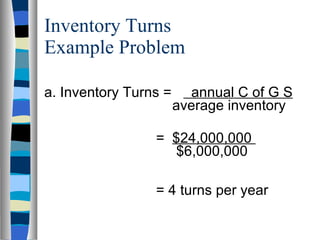
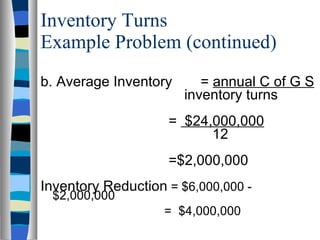
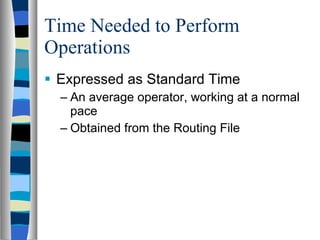
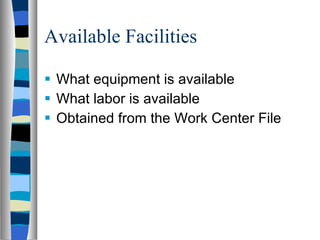
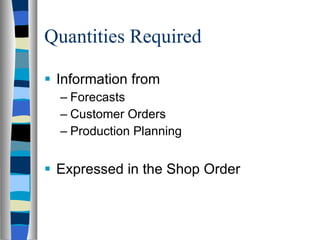
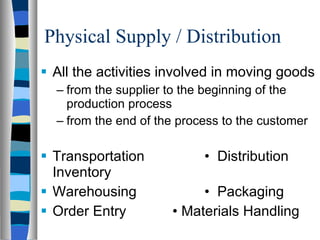
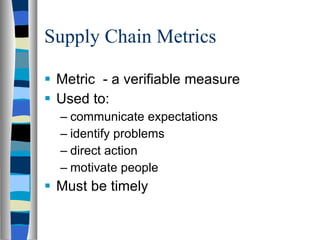
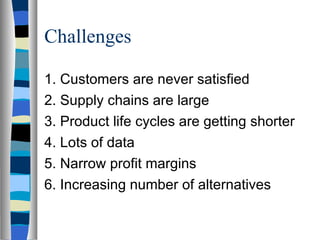
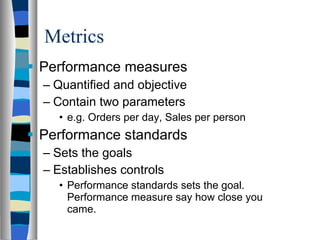
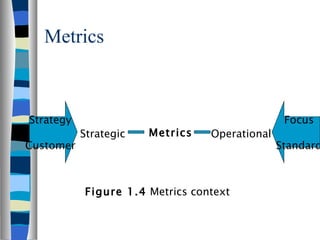
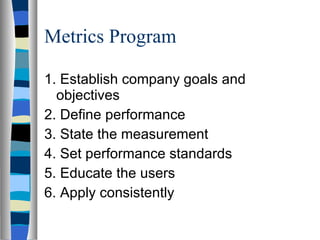
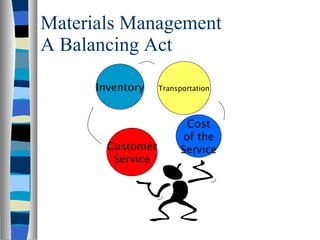
Present By Rakesh Raut Ph.D. Scholar (SCM) National Institute of Industrial Engineering(NITIE),  Vihar Lake, Mumbai-400 087
Introduction to Materials Management Chapter 1
Wealth What is it? Where does it come from? Adding value Designing the process Managing the process
Wealth Natural resources Transformation Conversion Managing the process Services
Operating Environment Government regulations safety Economy effects demand shortages and surpluses Competition is now global reduced costs of transportation communications, reduced costs and increased speed
Operating Environment continued Customers demand Lower prices Improved quality Reduced lead time Improved pre-sale and after-sale service Product and volume flexibility
Quality Order Qualifiers: customer requirements for price, quality, delivery, etc Order Winners: those characteristics that persuade customers to select a product or service “ Today’s order winners are tomorrows order qualifiers”
Manufacturing Strategy Figure 1.1  Manufacturing strategy and lead time
Engineer-to-Order Manufacturer does not start until the order is received Custom designs Unique products Long lead time Inventory purchased after order is received
Make-to-Order Manufacturer does not start until the order is received Often uses standard components Little design time Lead time is reduced Inventory held as raw materials
Assemble-to-Order Manufacturer inventories standard components No design time required Assembly only required Shorter lead time Inventory held as standard components
Make-to-Stock Manufacturer produces the goods in anticipation of customer demand Little customer involvement with design Shortest lead time Inventory held as finished goods
The Supply Chain Concept Figure 1.2  Supply-production-distribution system
The Supply Chain Concept Includes all activities and processes to supply a product or service to the customer Links many companies Has a number of supplier/customer relationships May contain intermediaries such as: wholesalers, warehouses and retailers
Historical Perspective In the past there were well defined and rigid boundaries between organizations JIT viewed suppliers as partners mutual analysis for cost reduction mutual product design greatly reduced inventory improved communications (internet, EDI)
Growth of Supply Chain Concept Integrated systems (ERP) and the sharing of information Global competition and supply Flexible designs - reduced product life cycles JIT approach to interorganizational relations Subcontracting or outsourcing work
Current Supply Chain Concept Manage the flow of materials Share information through the internet Transfer funds electronically Recover, recycle or reuse materials
Conflicts in Traditional Systems Company main objectives 1. Best customer service 2. Lowest production costs 3. Lowest inventory investment 4. Lowest distribution costs
Conflicts in Traditional Systems Figure 1.3  Conflicting Objectives
Conflicts in Traditional Systems Marketing Production Finance Objective High Revenue Low Cost Cash Flow Implications Customer Service High Low Low Production Disruptions Many Few Few Inventories High High Low
Materials Management Planning and controlling the flow of materials Objectives: Maximize the use of the firms resources Provide the required level of customer service
Company Objectives Income = Revenue - Expense Need to increase income with: Best customer service Lowest production costs Lowest inventory investment Lowest distribution costs
Materials Management and Profits Direct labor Direct material Varies with volume sold Overhead Does not vary with volume sold
Materials Management and Profits (continued) Dollars   % of Sales  Sales Revenue $1,000,000   10 Cost of Goods Sold Direct Material $500,000 50 Direct Labour $200,000 20 Overhead $200,000 20 Total Cost of Goods Sold   $900,000   90  Gross Profit   $100,000   10
Materials Management and Profits (continued) Reduce Materials by 10% and Labor by 5% Dollars   % of Sales  Sales Revenue $1,000,000   10 Cost of Goods Sold Direct Material $450,000 45 Direct Labour $190,000 19 Overhead $200,000 20 Total Cost of Goods Sold   $840,000   84  Gross Profit   $160,000   16 Profit has increased 60%
Materials Management and Profits (continued) To get the same result (+ 60% profit) through Sales Dollars   % of Sales  Sales Revenue $1,200,000   10 Cost of Goods Sold Direct Material $600,000 50 Direct Labour $240,000 20 Overhead $200,000 20 Total Cost of Goods Sold $1,040,000   87  Gross Profit   $160,000   13 Sales must increase by 20%
Manufacturing  Planning and Control Planning and controlling the flow of materials through the manufacturing process through: Production Planning Implementation and Control Inventory Management
Production Planning To meet the demands of the marketplace Establish priorities Ensure capacity Activities Forecasting Master Planning Materials Requirements Planning Capacity Planning
Implementation and Control Putting into action and achieving the plans (made by production planning) Production Activity Control Shop Floor Control Purchasing
Inventory Management To support production (Raw Materials) or as a result of production (Finished Goods) Provide a buffer against the differences in demand rates and production rates How much is enough?
Inventory Turns Inventory Turns Ratio =  Annual Cost of Goods Sold   Average Inventory in Dollars Example: If the annual cost of goods sold is $1 million dollars and the average inventory is $500,000, then: Inventory Turns =  $1,000,000   =  2   $500,000
Inventory Turns  Example Problem a. What will be the Inventory Turns Ratio if the annual C of GS is $24 million and the average inventory is $6 million? b. What would be the reduction in inventory if turns were increased to 12 times per year? c. If the cost of carrying inventory is 25% of the average inventory what will the annual savings be?
Inventory Turns  Example Problem a. Inventory Turns =  annual C of G S average inventory   =  $24,000,000    $6,000,000   = 4 turns per year
Inventory Turns  Example Problem (continued) b. Average Inventory =  annual C of G S    inventory turns =  $24,000,000   12 =$2,000,000 Inventory Reduction  = $6,000,000 - $2,000,000   =  $4,000,000
Inventory Turns  Example Problem (continued) c. Reduction in Inventory = $4,000,000 Annual Savings = $4,000,000 x .25 = $1,000,000
Inputs to the Manufacturing Planning and Control System 1. Product description 2. Process specifications 3. Time needed 4. Available facilities 5. Quantity required
Product Description Engineering Drawings Specifications Bill of Material Components used to make the product Sub-assemblies at stages of production
Process Specifications Recorded on a Route Sheet Describe how the product is made Operations required to make the product Sequence of operations Equipment and accessories required Standard time to perform each operation
Time Needed to Perform Operations Expressed as Standard Time An average operator, working at a normal pace Obtained from the Routing File
Available Facilities What equipment is available What labor is available Obtained from the Work Center File
Quantities Required Information from Forecasts Customer Orders Production Planning Expressed in the Shop Order
Physical Supply / Distribution All the activities involved in moving goods  from the supplier to the beginning of the production process from the end of the process to the customer Transportation  •  Distribution Inventory Warehousing  •  Packaging Order Entry  • Materials Handling
Supply Chain Metrics Metric  - a verifiable measure  Used to: communicate expectations identify problems direct action motivate people Must be timely
Challenges 1. Customers are never satisfied 2. Supply chains are large 3. Product life cycles are getting shorter 4. Lots of data 5. Narrow profit margins 6. Increasing number of alternatives
Metrics Performance measures Quantified and objective Contain two parameters e.g. Orders per day, Sales per person Performance standards Sets the goals Establishes controls Performance standards sets the goal. Performance measure say how close you came.
Metrics Figure 1.4  Metrics context Strategy Customer Strategic Metrics Operational Focus Standard
Metrics Program 1. Establish company goals and objectives 2. Define performance 3. State the measurement 4. Set performance standards 5. Educate the users 6. Apply consistently
Materials Management A Balancing Act Customer Service Cost of the Service Inventory Transportation
Chapter 1 Summary Manufacturing creates wealth Must make the best use of labor, materials and capital Need to plan the flow of materials into, through and out of production Three elements in a material flow system: supply, manufacturing and distribution
Chapter 1 Summary  (continued) Need to balance Customer service with the cost of supplying the service There are three basic ways to organize manufacturing processes: flow, intermittent and project determined by the: item, production rate and range of products
Chapter 1 Summary  (continued) Each manufacturing system requires the planning of materials Need the right material at the right place at the right time Metrics will help with control and to meet the goals of the company
Q & A   Questions  &  Answers  THANK YOU All September 11, 2011

Material management 1

  • 1.
    Present By Rakesh Raut Ph.D. Scholar (SCM) National Institute of Industrial Engineering(NITIE), Vihar Lake, Mumbai-400 087
  • 2.
    Introduction to MaterialsManagement Chapter 1
  • 3.
    Wealth What isit? Where does it come from? Adding value Designing the process Managing the process
  • 4.
    Wealth Natural resourcesTransformation Conversion Managing the process Services
  • 5.
    Operating Environment Governmentregulations safety Economy effects demand shortages and surpluses Competition is now global reduced costs of transportation communications, reduced costs and increased speed
  • 6.
    Operating Environment continuedCustomers demand Lower prices Improved quality Reduced lead time Improved pre-sale and after-sale service Product and volume flexibility
  • 7.
    Quality Order Qualifiers:customer requirements for price, quality, delivery, etc Order Winners: those characteristics that persuade customers to select a product or service “ Today’s order winners are tomorrows order qualifiers”
  • 8.
    Manufacturing Strategy Figure1.1 Manufacturing strategy and lead time
  • 9.
    Engineer-to-Order Manufacturer doesnot start until the order is received Custom designs Unique products Long lead time Inventory purchased after order is received
  • 10.
    Make-to-Order Manufacturer doesnot start until the order is received Often uses standard components Little design time Lead time is reduced Inventory held as raw materials
  • 11.
    Assemble-to-Order Manufacturer inventoriesstandard components No design time required Assembly only required Shorter lead time Inventory held as standard components
  • 12.
    Make-to-Stock Manufacturer producesthe goods in anticipation of customer demand Little customer involvement with design Shortest lead time Inventory held as finished goods
  • 13.
    The Supply ChainConcept Figure 1.2 Supply-production-distribution system
  • 14.
    The Supply ChainConcept Includes all activities and processes to supply a product or service to the customer Links many companies Has a number of supplier/customer relationships May contain intermediaries such as: wholesalers, warehouses and retailers
  • 15.
    Historical Perspective Inthe past there were well defined and rigid boundaries between organizations JIT viewed suppliers as partners mutual analysis for cost reduction mutual product design greatly reduced inventory improved communications (internet, EDI)
  • 16.
    Growth of SupplyChain Concept Integrated systems (ERP) and the sharing of information Global competition and supply Flexible designs - reduced product life cycles JIT approach to interorganizational relations Subcontracting or outsourcing work
  • 17.
    Current Supply ChainConcept Manage the flow of materials Share information through the internet Transfer funds electronically Recover, recycle or reuse materials
  • 18.
    Conflicts in TraditionalSystems Company main objectives 1. Best customer service 2. Lowest production costs 3. Lowest inventory investment 4. Lowest distribution costs
  • 19.
    Conflicts in TraditionalSystems Figure 1.3 Conflicting Objectives
  • 20.
    Conflicts in TraditionalSystems Marketing Production Finance Objective High Revenue Low Cost Cash Flow Implications Customer Service High Low Low Production Disruptions Many Few Few Inventories High High Low
  • 21.
    Materials Management Planningand controlling the flow of materials Objectives: Maximize the use of the firms resources Provide the required level of customer service
  • 22.
    Company Objectives Income= Revenue - Expense Need to increase income with: Best customer service Lowest production costs Lowest inventory investment Lowest distribution costs
  • 23.
    Materials Management andProfits Direct labor Direct material Varies with volume sold Overhead Does not vary with volume sold
  • 24.
    Materials Management andProfits (continued) Dollars % of Sales Sales Revenue $1,000,000 10 Cost of Goods Sold Direct Material $500,000 50 Direct Labour $200,000 20 Overhead $200,000 20 Total Cost of Goods Sold $900,000 90 Gross Profit $100,000 10
  • 25.
    Materials Management andProfits (continued) Reduce Materials by 10% and Labor by 5% Dollars % of Sales Sales Revenue $1,000,000 10 Cost of Goods Sold Direct Material $450,000 45 Direct Labour $190,000 19 Overhead $200,000 20 Total Cost of Goods Sold $840,000 84 Gross Profit $160,000 16 Profit has increased 60%
  • 26.
    Materials Management andProfits (continued) To get the same result (+ 60% profit) through Sales Dollars % of Sales Sales Revenue $1,200,000 10 Cost of Goods Sold Direct Material $600,000 50 Direct Labour $240,000 20 Overhead $200,000 20 Total Cost of Goods Sold $1,040,000 87 Gross Profit $160,000 13 Sales must increase by 20%
  • 27.
    Manufacturing Planningand Control Planning and controlling the flow of materials through the manufacturing process through: Production Planning Implementation and Control Inventory Management
  • 28.
    Production Planning Tomeet the demands of the marketplace Establish priorities Ensure capacity Activities Forecasting Master Planning Materials Requirements Planning Capacity Planning
  • 29.
    Implementation and ControlPutting into action and achieving the plans (made by production planning) Production Activity Control Shop Floor Control Purchasing
  • 30.
    Inventory Management Tosupport production (Raw Materials) or as a result of production (Finished Goods) Provide a buffer against the differences in demand rates and production rates How much is enough?
  • 31.
    Inventory Turns InventoryTurns Ratio = Annual Cost of Goods Sold Average Inventory in Dollars Example: If the annual cost of goods sold is $1 million dollars and the average inventory is $500,000, then: Inventory Turns = $1,000,000 = 2 $500,000
  • 32.
    Inventory Turns Example Problem a. What will be the Inventory Turns Ratio if the annual C of GS is $24 million and the average inventory is $6 million? b. What would be the reduction in inventory if turns were increased to 12 times per year? c. If the cost of carrying inventory is 25% of the average inventory what will the annual savings be?
  • 33.
    Inventory Turns Example Problem a. Inventory Turns = annual C of G S average inventory = $24,000,000 $6,000,000 = 4 turns per year
  • 34.
    Inventory Turns Example Problem (continued) b. Average Inventory = annual C of G S inventory turns = $24,000,000 12 =$2,000,000 Inventory Reduction = $6,000,000 - $2,000,000 = $4,000,000
  • 35.
    Inventory Turns Example Problem (continued) c. Reduction in Inventory = $4,000,000 Annual Savings = $4,000,000 x .25 = $1,000,000
  • 36.
    Inputs to theManufacturing Planning and Control System 1. Product description 2. Process specifications 3. Time needed 4. Available facilities 5. Quantity required
  • 37.
    Product Description EngineeringDrawings Specifications Bill of Material Components used to make the product Sub-assemblies at stages of production
  • 38.
    Process Specifications Recordedon a Route Sheet Describe how the product is made Operations required to make the product Sequence of operations Equipment and accessories required Standard time to perform each operation
  • 39.
    Time Needed toPerform Operations Expressed as Standard Time An average operator, working at a normal pace Obtained from the Routing File
  • 40.
    Available Facilities Whatequipment is available What labor is available Obtained from the Work Center File
  • 41.
    Quantities Required Informationfrom Forecasts Customer Orders Production Planning Expressed in the Shop Order
  • 42.
    Physical Supply /Distribution All the activities involved in moving goods from the supplier to the beginning of the production process from the end of the process to the customer Transportation • Distribution Inventory Warehousing • Packaging Order Entry • Materials Handling
  • 43.
    Supply Chain MetricsMetric - a verifiable measure Used to: communicate expectations identify problems direct action motivate people Must be timely
  • 44.
    Challenges 1. Customersare never satisfied 2. Supply chains are large 3. Product life cycles are getting shorter 4. Lots of data 5. Narrow profit margins 6. Increasing number of alternatives
  • 45.
    Metrics Performance measuresQuantified and objective Contain two parameters e.g. Orders per day, Sales per person Performance standards Sets the goals Establishes controls Performance standards sets the goal. Performance measure say how close you came.
  • 46.
    Metrics Figure 1.4 Metrics context Strategy Customer Strategic Metrics Operational Focus Standard
  • 47.
    Metrics Program 1.Establish company goals and objectives 2. Define performance 3. State the measurement 4. Set performance standards 5. Educate the users 6. Apply consistently
  • 48.
    Materials Management ABalancing Act Customer Service Cost of the Service Inventory Transportation
  • 49.
    Chapter 1 SummaryManufacturing creates wealth Must make the best use of labor, materials and capital Need to plan the flow of materials into, through and out of production Three elements in a material flow system: supply, manufacturing and distribution
  • 50.
    Chapter 1 Summary (continued) Need to balance Customer service with the cost of supplying the service There are three basic ways to organize manufacturing processes: flow, intermittent and project determined by the: item, production rate and range of products
  • 51.
    Chapter 1 Summary (continued) Each manufacturing system requires the planning of materials Need the right material at the right place at the right time Metrics will help with control and to meet the goals of the company
  • 52.
    Q & A Questions & Answers THANK YOU All September 11, 2011