1. Y1475719 Word Count: 3000
A biological and physiochemical assessment to evaluate
the efficiency of the retention basin in place on the
Heslington East Campus.
ABSTRACT
Freshwater systems one of the most endangered ecosystems worldwide due to anthropogenic
development. The aim of this study is to evaluate the efficiency of the Heslington East’s
retention basin and assess the need for future management, using biological and
physiochemical monitoring. This retention basin receives runoff from Badger Hill community
and filters the water before it enters the main campus lake. In summary across the retention
basin mean OPAL health score was 2.66(±5.6) with sporadic outcomes, nitrate concentration
0.61mg/L(±1.14) strong negative correlation to distance, pH was 7.6(±0.5) and overall
increasing and dissolved oxygen (DO) was 8.77mg L(±4.35), fairly consistent indicating
relatively high water quality from the physiochemical variables. In summary the retention basin
was an efficient SUD in reducing input pollution from the physochemical results, and despite
DO having a weak relationship with distance (R²=0.0937), and no correlation between health
score and distance (R²=0.0040), the water quality levels still improved. Furthermore, the null
hypothesis was rejected.
INTRODUCTION
The Ecological Society of America conference 1993 and the OCED’s New Rural Paradigm
(2006) acknowledged that global environments are facing major challenges from rapid human
land-use change (Ojima, Galvin and Turner, 2013). Relatively small areas of urban land cover
(ie. 10-12%; Allan, 2004) can lead to large increases of chemical pollution into freshwater
systems (Hope, 2012 in Martinuzzi et al, 2014). Anthropogenic development in the last century
has been the prevailing factor to change global environments; making freshwater systems one
of the most endangered ecosystems worldwide (Ojima, Galvin and Turner, 2013 and Yoshioka
et al, 2014). Developmental pressures are the greatest future threat to them, largely responsible
for recent unprecedented biodiversity losses (Sala et al, 2000, Allan, 2004 and Dudgeon et al,
2006). This is evident in Kosi River, Uttar Pradesh, India where pollution is discharged from
urban activities. Physio-chemical parameters pH (7.2-8.5), nitrate content (4.7-48ppm), BOD
(12.7-53.6ppm) and COD (69-193ppm) indicate severely polluted water (Yadav and Kumar,
2011).
Protecting global freshwater resources requires monitoring water quality to diagnose present
and potential water quality threats over a range of scales, from global to local (Vorosmarty et
al, 2010 and Allan et al, 2006) to assess freshwater ecosystems conditions. In the last decade,
local on-site treatment of freshwater sources has progressed. Sustainable Urban Drainage
Systems (SuDS) are solutions to urban flood risk and mitigating deteriorating water quality
from urban runoff by providing pollution source control (Jones and Macdonald, 2007 and
Jackson and Boutle, 2008). They are comprised of systems which perform detention, retention
and/or infiltration of runoff at source (Adeyeye, 2013). They combine different types of
engineered surface water management solutions; soak-aways, grassed areas and swales, pond
or wetlands and permeable pavements (CIRIA, 2007 and Jones and Macdonald, 2007).
2. Y1475719 Word Count: 3000
Retention basins through sedimentation and biological mechanisms stimulate soluble pollution
and nutrient alleviation (Adeyeye, 2013 and SusDrain, 2012).
The effectiveness of urban stormwater retention ponds is poorly documented, despite urban
runoff increasing with urbanisation and the increasing integration of SUDs (Weisse and
Stadler, 2006). The completed research of retention basin success has produced variable results
(Adeyeye, 2013) questioning whether improved design and preservation will enhance
performance. The aim of this study is to evaluate the efficiency of the Heslington East’s
retention basin and to assess the need for future management. The Heslington East campus (SE
63669 50634) located south east of York in a green-belt. Construction began in 2008/9 after
the Environmental Management Plan was accepted 2008 and an Ecological Management Plan
2013/18 proposed and implemented. The most recent development was complete in summer
2014. The total site is 116ha with 65ha available for development. A 1200m lake was built,
primarily for aesthetic value, providing a wildlife habitat and balancing surface water tables; it
has 8 main inlets and 1 outlet and acts as a recirculating system to prevent stagnation and
cleanse the water (Management Plan, 2008). Various SuDs are in place over the entire site to
alleviate surface runoff and minimise flood risk (Environmental Site Management Plan, 2008).
These include reed beds, swales, wetland and a retention basin, sedimentation of solids occurs
in the open water and wetland bench.
Physiochemical and biological monitoring will be carried out in the retention basin and briefly
in the main lake for comparison. OPAL is national programme of biological monitoring of
water and aquatic invertebrates (Davies et al 2011); determining water quality from the
presence of indicator species. The physio-chemical monitoring is derived from field and
laboratory procedures analysing water qualities. The objectives were to determine the water
quality through the Heslington East’s retention basin using biological and physiochemical
monitoring, evaluate the efficiency of the Heslington East’s retention basin and assess the need
for future management strategies. The null hypotheses are:
H¹: There is no change in water quality through the retention basin from the input site.
METHODOLOGY
2.1 – Study Site
The retention basin is the focus for this study; it is located North-West on the campus and
receives surface runoff from Badger Hill community from the North (see Figure 1). The input
from Badger Hill and output piping to the main lake are respectively north and south (see Figure
1).
3. Y1475719 Word Count: 3000
A mixture of plants were introduced into the basin at specific locations to enhance pollution
removal and biological mechanisms to remove excess nutrients. Waterlogging tolerant trees
such as Willows and loosestrife (Ecological Management Plan, 2008). Natural colonisation of
the basin is also promoted (Ecological Management Plan, 2008). Maintenance of the retention
basin is minimal, mainly involving removal of over-dominant vegetation.
2.2 – Sampling Strategy
The retention basin was
systematically sampled along one
edge from the input of the Badger Hill
runoff, to the output to the main lake
(Figure 2). Sampling was carried out
6th November 2014, between 11am
and 1pm in this temperature region.
Overall 27 samples were taken from
the retention basin.
2.3– Sampling Analysis
2.3.1– Ancillary variables
2.3.1.1– Dissolved oxygen
A YSI Pro 20 DO meter was used in the field. It was placed 1 meter from the retention basin
edge and 20cm into surface water and slowly rotated. Values were recorded in percentage. The
same individual completed this procedure per site to reduce methodological error identical and
Figure 1: Map highlighting the situation of the retention basin on the Heslington East
campus. The arrow indicates the direction of runoff from Badger Hill and the input and
output locations are highlighted, respectively northwards and southwards.
Source: Modified Digimap
Figure 2: Highlight of the sampled side of the lake.
Source: Modified Digimap
4. Y1475719 Word Count: 3000
consistency in technique. Between each site internal electrolyte channels were rinsed with
deionised water for calibration and prevent contamination.
2.3.1.2 – pH
In the laboratory an aliquot from each collected water sample was decanted. Using a calibrated
Cyberscan pH 310 Series, the probe was emerged into each aliquot and the pH value recorded.
Between each sample, the probe was put into deionised water for calibration and to prevent
cross contamination between samples.
2.3.2- Main variables
2.3.2.1 – OPAL sampling
This biological monitoring procedure involved following the provided OPAL hand-out and
calculating a resultant health score dependent on the presence of invertebrate indicator species;
this was triplicated at each site. The same individual completed this procedure per site to reduce
methodological error identical and consistency in technique. Field sampling was complete
within two hours, so temperature change would have unlikely affected results obtained.
2.3.2.2 – Nitrate sampling
A water sample was collected in a sterile bottle and immediately enclosed in a light-tight bag.
In the laboratory, the filtration procedure used glass fibre filters and a 47mm GF/F (Whatman)
filter was used and the vacuum set to <5 in Hg. The filtrate of a 20mL aliquot from each sample
was used to rinse the bottle. A 30-40mL aliquot from the same sample was then filtered across
the same filter and the filtrate transferred into a centrifuge tube. The filtration kit was rinsed
with deionised water and GF/F filter replaced between each sample. Filtrates were transferred
to a freezer (-20ᶜC) and kept frozen until analysis. Five calibration standards were prepared in
the 0 to 2mg/L range. Once the filtered samples were thawed, aliquots of 4ml were measured
from each standard and filtered samples and ran through AutoAnalyzer 3 (AA3). The reagents
sulphanilamide and N-1-napthlethylenediaminedihydrochloride were used to determine NO₃⁻
concentration calorimetrically at 540nm. A ‘drift’ solution standard was run every 10 samples
to calibrate the instrument response in respect to analyte concentration, reduce measurement
errors and assures accurate measurements.
2.3 – Data Analysis
The AA3 results from the standard runs were used to create a calibration curve by minusing
the baseline (-0.045). The derived R² was 0.9909, assuring the high quality data. Mean, ranges
and interquartile ranges and scatter graphs were calculated in Excel for the retention basin to
summarise all variables change over distance from the input. KS tests were carried out to test
for normality on main variables. Regression analysis was carried out in SPSS to statistically
test the relationship between each variable and distance from the input, which resulted in p and
r² values. No repeats were carried out in the field for the physio-chemical monitoring; a greater
number of samples were taken from the retention basin to get a more representative sample of
5. Y1475719 Word Count: 3000
the actual population. Repeats of biological monitoring were carried out, and quality control
was applied here. The outliers were kept in the dataset for analysis; the sample size was already
small and removing any sites will remove information and reduce accuracy of outcomes.
RESULTS
3.1 Ancillary variables
3.1.1 – The Retention Basin
Table 1: A summary of the ancillary variables pH and dissolved oxygen properties for the
entire retention basin.
The mean pH in the retention basin was 7.60 and range 0.5, showing relative consistency with
pH across the retention basin. Dissolved oxygen mean was 8.77m/L and the range 6.07-
10.42m/L, displaying large variation in the dissolved oxygen levels across the basin.
From the retention basin input location to the output acidity reduced. The pH at the input was
7.86 and the output was 7.81; the input observation being significantly anomalous. The R² is
0.5462, therefore a reasonable relationship existed between pH and distance from the input,
and 54.62% of the change in pH over is due to distance.
Variable Mean (X) Range
pH 7.60 0.5
DO(m/L) 8.77 4.35
y = 0.002x + 7.3987
R² = 0.5462
7.3
7.4
7.5
7.6
7.7
7.8
7.9
0 50 100 150 200 250
PH
DISTANCEFROMRETENTION BASIN INPUT (M)
Figure 3: The change in pH over distance from the retention basin input to the output.
6. Y1475719 Word Count: 3000
The dissolved oxygen overall increased very slightly; shown by the very weak gradient, 0.005.
At the input site it was 10.42m/L and 9.98m/L at the output location. The dissolved oxygen 0-
8m from the input show anomalous results at 10.42m/L and 10.25m/L. The R² value of 0.0937,
therefore there was an extremely weak relationship between dissolved oxygen concentrations
and distance from the input.
3.2 Main variables
3.2.1 – The retention basin
Table 2: A summary of the main variables across the retention basin; nitrate concentration
and OPAL.
Variable Mean (X) Range
OPAL 2.66 5.60
Nitrate conc (mg/L) 0.65 1.14
The mean health score was 2.66 and range 5.6 showing great variation in scores. Nitrate
concentration mean was 0.65mg/L and the range 1.14, showing relatively consistent variation
in the nitrate concentration.
y = 0.005x + 8.2456
R² = 0.0937
0
2
4
6
8
10
12
0 50 100 150 200 250
DISSOLVEDOXYGEN(M/L)
DISTANCEFROMTHE RETENTION BASIN INPUT(M)
Figure 4: The change in the ancillary variable dissolved oxygen (m/L) concentration over
distance from the retention basin input to the output.
7. Y1475719 Word Count: 3000
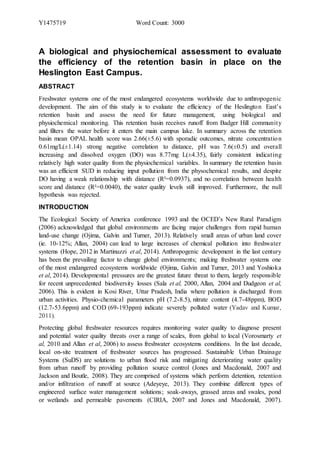
Figure 5: The triplicate OPAL health score results per site over distance from the retention
basin input to highlight the relationship between distance and score.
There was no significant relationship between the variation of OPAL pond health score and
distance from through the basin, shown by significant variation per site and between sites. The
very general trend considering average scores is an insignificant decrease. At both the input
and output sites the mean health scores were 0. Health scores had the weakest relationship out
of all variables with distance, R² value of 0.0040; only 0.4% of the scores were due to distance.
There is no significance between the health scores and ancillary variables change over distance.
Therefore no significant relationship between biological water quality monitoring and distance
from the input exists.
8. Y1475719 Word Count: 3000
Nitrate concentration decreased at a steady rate, shown by the gradient value of -0.0032; the
input and output were respectively 1.307mg/L and 0.369mg/L. These oppose ancillary
variables, as they decreased with distance. There was an anomaly at 64m from the input
location of 0.250mg/L, when DO was 8.27m/L and pH neutral. Nitrates concentration had the
strongest relationship with distance out of all variables, R² was 0.6131, in a negative
correlation.
Table 3: Regression test results of the main variables OPAL and nitrate concentrations
through the retention basin.
N r² p value*
Distance (m)
OPAL health scores
27 0.045 .452
Distance (m)
Nitrate conc (mg/L)
27 0.613 <0.05
(*Confidence Level 0.05)
Normality testing showed OPAL health scores and nitrate concentrations as normally
distribution (p<0.05 each). Distance accounted for 4.5% of the variability in health scores
across the retention basin. P>0.05 relays that there is no significant correlation between health
scores and the distance. Distance accounted for 61% of the variability in nitrate concentration.
P<0.05 relays that there is significant correlation between the nitrate concentration and the
distance from the retention basin.
y = -0.0032x + 0.989
R² = 0.6131
0
0.2
0.4
0.6
0.8
1
1.2
1.4
1.6
0 50 100 150 200 250
NITRATECONCENTRATION(MG/L)
DISTANCEFROMRETENTION BASIN INPUT (M)
Figure 6: The change in nitrate concentration (mg/L) over distance from the
retention basin input to the output.
9. Y1475719 Word Count: 3000
DISCUSSION
1. Results
The aim of this study was to evaluate the efficiency of the Heslington East’s retention basin
through physio-chemical and biological water quality monitoring and to assess the need for
future management.
The overall pH in the retention basin was 7.6(±0.5), it increased respectively 7.86pH to 7.81pH
from input to output including the anomolous pH at the input. There was a partially strong
correlation to distance (R²=0.5462, see figure 1). The pH range 7.6(±0.5) was within the
freshwater criteria benchmark 6-8.5pH for freshwater (Weisse and Stadler, 2006). The
detrimental impact of anthropogenic variables on freshwater pH is documented in Voil et al
(2009), retention ponds within 50m of highway were sampled and 18 ponds 150m away from
any road; highway ponds was 8.16pH±0.22, respective to surrounding ponds, 7.24pH±0.24;
and in the Nkoro river, Nigeria, increase to 8.5±2.7pH observed Abowei, 2009). The change
in the pH across the basin show a fairly strong relationship with distance, showing that the
retention basin is effective in alleviating the acidity which urban runoff from Badger Hill would
cause and therefore that it is effective in improving water quality. Therefore, no specific
management is proposed for pH, unless the pollution input was to change or a non-native plant
was to be introduced into the retention basin to become an influencing factor on pH levels.
The mean DO was 8.77mg L(±4.35), there was a slight increase in DO distance, with very
weak correlation to distance from the input (R²=0.0937) and relatively consistent results despite
the large range (figure 4). The DO results 8.77mg/L(±4.35), despite the majority of results
having desirable DO concentrations, 4 sites had DO concentrations lower than 8m/L (figure 4).
This falls outside of the safe thresholds of the typical freswater range 8.0 m/ L to 14.6 m/L
(Brown and Brazier in Illinois Environmental Protective Agency, 2004), and had undesirable
oxygen-saturation conditions for these sites. This relates to DO conditions in Nkoro River,
Nigeria ranged from 3.2±0.1mg/L to 8.3±0.16mg/L due to anthropogenic activities on the
estuary (Abowei, 2009), yet some sites met the benchmark criteria. The change in the DO
concentrations across the basin shows a weak positive relationship with distance, technically
still demonstrating that the retention basin is effective in increasing concentrations. However,
methodological errors in the field may have caused error in the sampling collection, which
must be considered. For future management, further DO concentration analysis is proposed,
considering temperatures and seasonal variations, to determine more explicitly the relationship
between it and the retention basin.
Across the entire Heslington East retention basin average OPAL health score was 2.66(±5.6).
OPAL showed no significant correlation to distance across the retention basin; there was a very
week correlation with distance (R²=0.045). Overall, the health scores varied the greatest (range
5.6). Biological indicators of aquatic health is a subject of current research; specific indicator
species criteria can be a useful rough benchmark to determine water quality the biota is
frequently used in the classification of freshwater ecosystems (Cranston, et al, 1996). The
sporadic distribution of the OPAL health scores displayed no significant relationship
(R²=0.004) between health score and distance; although due to the limited sample size, the true
population may have been misinterpreted. It is said with low confidence that the retention does
not improve the biological health of the water; although the time of day and year, and human
10. Y1475719 Word Count: 3000
disturbance may have affected the results. This and the overall categorised low health of the
retention basin by OPAL criteria, are proposed areas for future study and management on the
Heslington East Campus and internationally. The confidence in biological monitoring is
questioned due to it being subjective and vulnerable to methodological error; however, studies
suggest that indicator species provide quick and vital information about ecosystem changes
(Benitez-Mora et al, 2013 and Azizullah et al, 2014) which draws conclusions quickly.
In summary, nitrate concentration 0.61mg/L(1.14); concentrations decreased respectively
1.307mg/L to 0.369mg/L across the basin with a fairly strong correlation with distance
(R²=0.6131) (see table 1). Therefore, the retention basin is effective in reducing nitrate
concentrations to below water quality guidelines, 2.0mg/L to 100mg/L (Rouse et al, 1999). The
higher concentrations at the input site do demonstrate that development does have an affect on
the environment; supported in (Scher and Thiery, 2005); relating to nitrate concentrations
ranging from 19 to 42 mg/L found in Cootes Paradise wetland in Dundas, Ontario in 1997,
predominantly as a consequence of anthropogenic loading from a ‘sewage treatment plan’ and
concentrations of nitrate >2mg/L in the Great Lakes due to vehicle and industrial exhausts
(Rouse et al, 1999). Methodological error may have skewed the results however with
immediately putting collected samples into dark conditions or preparing standards, which
would reduce the studies validity and accuracy. This sustainable urban water treatment was highly
effective in reducing nitrate levels from the input concentrations; future management in reference
to reducing the impact of development and, associating with Defra’s ‘new build regulations’
regarding SUDs (DEFRA, 2014) could reduce the deteriorating of water quality in urban water
systems nationally.
The change in the specific variables to the Heslington East retention basin highlight there was
a change in water quality conditions and the OPAL health scores did have a range of 5.6, only
0.4 from being healthy. Retention ponds are designed under the assumption that retention
improves water quality, and the results show the efficiency of the Heslington East one is
relatively effective according to the physiochemical parameters. Despite DO only have
R²=0.0937, concentrations still increased over the distance of the retention basin. Nitrate
concentration and pH both had higher R², respectively 0.6131 and 0.5462 and therefore the
null hypothesis is rejected. The health scores have no correlation to distance from the input,
(R²=0.004 and p>0.05), whereas the physiochemical parameters show more significant
associations with distance and increasing the desirable characteristics. Nevertheless, this
conclusion is determined from a limited sample population; future study suggestions would be
to sample the retention basin in different seasons to determine the true extent of its efficiency.
Therefore future management propositions are significantly based on identifying the
relationship between biological water quality and the retention efficiency.
Overall retention basins do efficiently tackle increased urban runoff pollution and stormwater
to alleviate deteriorating water quality from the research on the small scale Heslington East
retention basin, as long as they are implemented correctly. The unprecedented land use change
which is occurring presently is posing disastrous affects to the environment, but specifically
freshwater systems. Protecting the world’s freshwater systems requires predicting where land
use change will happen, and reducing biodiversity loss requires adapting to its implications.
Without substantial changes to the current unsustainable development on ecosystems,
biodiversity is threatened.
11. Y1475719 Word Count: 3000
REFERENCES
Abowei, F., (2009), ‘Salinity, Dissolved Oxygen, pH and Surface Water Temperature
Conditions in Nkoro River, Niger Detla, Nigeria’ Advance Journal of Food Science and
Technology, 2:1(26-40).
Adeyeye, K., (2013) ‘Water Efficiency in Buildings: Theory and Practice’ John Wiley &
Sons, (Google eBook), 1st edition.
Allan, J., (2004) ‘Landscapes and riverscapes: the influence of land use on stream eco-
Systems’, Annual Review of Ecology, Evolution, and Systematics, 35: 257–284.
Andrew S. Goudie. (2013) ‘The Human Impact of the Natural Environment: Past,
Present and Future’, Seventh edition, West Sussex: .John Wiley & Sons.
Armstrong, F., Stearns, C., and Strickland, J., (1967) ‘The measurement of upwelling
and subsequent biological processes by means of the Technicon Autoanalyzer and
associatedequipment’ Deep Sea Research and Oceanographic Abstracts, 14:3(381-389).
Ashley, R., Woods-Ballard, B., (2012) SusDrain website, accessedonline
[http://www.susdrain.org/delivering-suds/using-suds/suds-
components/retention_and_detention/retention_ponds.html], date accessed[20th Nov
2014].
Yadav, S., Kumar, R., (2011) ‘Monitoring Water quality of Kosi River in Rampur
District, Uttar Pradesh, India’ Advances in Applied Science Research, 2:197-201.
Azizullah, A., Jamil, M., Richter, P., Hader, D., (2014) ‘Fast bioassessment of wastewater
and surface water quality usiny freshwater flagellate Euglena gracilis – a casestudy from
Pakistan’, Journal of Applied Phycology, 26:1(421-431).
Canadian Environmental Quality Guidance (2012) Canadian Council of Ministers of the
Environment. Accessed online:
file:///C:/Users/Amie/Downloads/Nitrate%20Ion%20(en).pdf , date accessed [25th Nov
2014].
CIRIA (2007) ‘The SUDs Manual (C697)’, Accessed online
[http://www.hackney.gov.uk/Assets/Documents/The-SuDS-Manual-C697.pdf], date accessed
[20th Nov 2014].
Cranston, P., Fairweather, P., and Clark, G., (1996) ‘Biological Indicators of Water Quality’,
pp 143-154 in J. Walker and D.J. Reuter (eds) Indicators of Catchment Health: a technical
perspective. CSIRO, Melbourne.
Digimap.edina, http://digimap.edina.ac.uk/roam/o [Accessed online October 31st]
Dudgeon, D., Arthington, A. H., Gessner, M. O., Kawabata, Z.-I., Knowler, D. J., Lévêque,
C., Naiman, R. J., Prieur-Richard, A.-H., Soto, D., Stiassny, M. L. J. and Sullivan, C. A.
12. Y1475719 Word Count: 3000
(2006) Freshwater biodiversity: importance, threats, status and conservation challenges.
Biological Reviews, 81: 163–182.
Foley, J., Defries, R., Asner, G., Barford, C., Bonan, G., Carpenter, S., Chapin, F., Coe,
M., Daily, G., Gibbs, H., Helkowski, J., Holloway, T., Howard, E., Kucharik, C.,
Monfreda, C., Patz, J., Prentice, I., Ramankutty, N., Snyder, P., (2005) ‘Global
consequences of land use’, Science, 309:570-574.
‘Heslington’, A History of the County of York East Riding; Volume 3: Ouse and
Derwent wapentake, and part of Harthill wapentake (1976), pp 66-74. URL:
http://www.british-history.ac.uk/report.aspx?compid=23008 [Date accessed: 02
November 2014].
Heslington East Development: Environnental Site Management Plan version 3, (2008)
University of York.
Hope, B., (2012) ‘Using legacy data to relate biological condition to cumulative aquatic
toxicity in the Willamette River Basin (Oregon, USA)’, Archives of Environmental
Contamination and Toxicology, 62:424–437.
Jackson, J., Boutle, R., (2008) ‘Ecological functions within a Sustainable Urban Drainage
System’, 11th International Conference on Urban Drainage, Edinburgh.
Jones, P., and Macdonald, N., (2007) ‘Making spccae for unruly water: Sustainable drainage
systems and the disciplining of surface runoff’ Geoforum, 38:3(534-544).
Martinuzzi, S., Januchowski-Hartley, S. R., Pracheil, B. M., McIntyre, P. B., Plantinga, A. J.,
Lewis, D. J. and Radeloff, V. C., (2014) ‘Threats and opportunities for freshwater
conservation under future land use change scenarios in the United States’. Global Change
Biology, 20: 113–124.
OECD (2006), The New Rural Paradigm: Policies and Governance, OECD Publishing.
DOI: 10.1787/9789264023918-en.
Ohte, N., I. Tayasu, A. Kohzu, C. Yoshimizu, K. Osaka, A. Makabe, K. Koba, N.
Yoshida, and T. Nagata (2010) ‘Spatial distribution of nitrate sources of rivers in the
Lake Biwa watershed, Japan: Controlling factors revealed by nitrogen and oxygen
isotope values’, Water Resources Research, 46:7.
Ojima, D., Galvin, K., Turner, B., (1994) ‘The Global Impact of Land-Use Change’,
Bioscience, 44: 300-304.
Rouse, J., Bishop, C., and Struger, J., (1999) ‘Nitrogen pollution: an assessment of its threat to
amphibian survival’, Environ Health Perspect, 107:10(799-803).
Sala, O., Chapin, F., Armesto, J., Berlow, E., Bloomfield, J., Dirzo, R., Huber-Sanwald, E.,
Huenneke, L., Jackson, R., Kinzig, A., Leemans, R., Lodge, D., Mooney, H., Oesterheld, M.,
Poff, N., Sykes, M., Walker, B., Walker, M., Wall, D., (2000) ‘Global biodiversity scenarios
for the year 2100’, Science, 287: 1770–1774.
13. Y1475719 Word Count: 3000
Schler and Thiery, (2005) ‘Odonata, Amphibia and Environmental Characteristics in
Motorway Stormwater Retention Ponds (Southern France)’, Hydrobiologia, 551:1(237-
251).
The University of York, Heslington East Environmental Site Management Plan (2008).
Accessed online:
https://www.york.ac.uk/media/campusdevelopment/documents/heseast/Environmental%20Sit
e%20Management%20Plan%20approved%20Aug08.pdf , date accessed [25th Nov 2014].
Tucker, C., and D’Abramo, L., (2008) ‘Managing High pH in Freshwater Ponds’
Southern Regional Aquaculture Center, vol 57.
Weisse, T., and Stadler, P., (2006) ‘Effect of H on growth, cell volume, and production of
freshwater ciliates, and implications for their distribution’, the American Society of Limnology
and Oceanography, Inc, 51:4(1708-1715).
Yoshioka, A., Miyazaki, Y., Sekizaki, Y., Suda, S., Kadoya, T., Washitani, I., (2014) ‘A “lost
biodiversity” approach to revealing major anthropogenic threats to regional freshwater
ecosystems’, Ecological Indicators, 36: 348-355.