Normal Distribution and Standardization Concepts
•Download as PPTX, PDF•
1 like•761 views

- The document discusses normal distributions and how to standardize scores using z-scores. It provides examples of standardizing test scores based on the mean and standard deviation. - It also shows how to calculate probabilities using the normal distribution, such as finding the probability of a certain number of values being above or below a threshold. - Guidelines are provided for when it is appropriate to approximate a binomial distribution with a normal distribution, such as when np and nq are both greater than 5.

Recommended
Recommended
More Related Content
What's hot
What's hot (11)
Similar to Normal Distribution and Standardization Concepts
Similar to Normal Distribution and Standardization Concepts (20)
More from Aina Zambry
More from Aina Zambry (15)
Recently uploaded
Recently uploaded (20)
Normal Distribution and Standardization Concepts
- 2. • Blue and Red – Same mean, Different Std. Deviations • Blue and Green – Different mean, Different Std. Deviations • Blue and Black – Different means, Same Std. Deviations
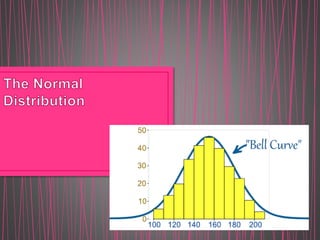
- 3. • A ND curve is bell-shaped • The mean, median and mode are equal and are located at the centre of distribution. • The curve is symmetric about the mean. • The curve is continuous • The curve never touches the x-axis • The total area under a ND curve is 1.00 (100%)
- 4. • z is the "z-score" (Standard Score) • x is the value to be standardized • μ is the mean • σ is the standard deviation • Z ~ N (0,1) is used to standardize the values of the normal distribution X ~ N (μ, 𝜎2)
- 5. Example: Professor Willoughby is marking a test. Here are the students results (out of 60 points): 20, 15, 26, 32, 18, 28, 35, 14, 26, 22, 17 Most students didn't even get 30 out of 60, and most will fail. The test must have been really hard, so the Prof decides to Standardize all the scores and only fail people 1 standard deviation below the mean. The Mean is 23, and the Standard Deviation is 6.6, and these are the Standard Scores: -0.45, -1.21, 0.45, 1.36, -0.76, 0.76, 1.82, -1.36, 0.45, -0.15, -0.91 Only 2 students will fail (the ones who scored 15 and 14 on the test)
- 6. • The random variable X normally distributed and is such that the mean μ is three times the standard deviation σ. It is given that P (X < 25) = 0.648 I. Find the values of μ and σ II. Find the probability that, from 6random values of X, exactly 4 are greater than 25. z = 0.38 ± 25 − μ μ/3 = 0.38 μ = 22.2, σ = 7.40 P (4) = 6C4 (0.352)4 (0.648)2 = 0.0967
- 7. • The mean of a certain normally distributed variable is four times the standard deviation. The probability that a randomly chosen value is greater than at least 5 is 0.15. I. Find the mean and standard deviation II. 200 values of the variable are chosen at random. Find the probability that at least 160 of these values are less than 5. z = 1.036 or 1.037 1.036 = 5−4𝑠 𝑠 s = 0.993 μ= 3.97 p = 0.85 μ = 200x0.85=170, var = 200x0.85x0.15=25.5 P (at least 160) = P ( z > 159.5−170) √25.5 = P(z > -2.079) = 0.981
- 8. • Conditions • If X~B(n,p) and np>5, nq>5. then X’~N(np,npq) • Continuity correction (CC) • Binomial (discrete) Normal (continuous) Eg: X is the no. of heads in 12 tosses . X~B(12,0.5) np = 6(>5) X’~N(6,3) nq = 6(>5) np>5 and nq>5
- 9. • In Scotland, in November on average 80% of days are cloudy. Assume that the weather on any one day is independent of the weather on other days. IRP May/June 2011 (Paper 62) i) Use a normal approximation to find the probability of there being fewer than 25 cloudy days in Scotland in November (30 days) np = 24, nqp = 4.8 z = ± 24.5−24 4.8 = 0.228 prob: 0.590 ii) Give a reason why the use of a normal approximation is justified. np and nq both >5
Editor's Notes
- Amy
- Amy
- Wawa
- Wawa
- Aina