
Recommended
Recommended
More Related Content
Similar to A490111.pdf
Similar to A490111.pdf (20)
More from aijbm
Recently uploaded
Recently uploaded (20)
A490111.pdf
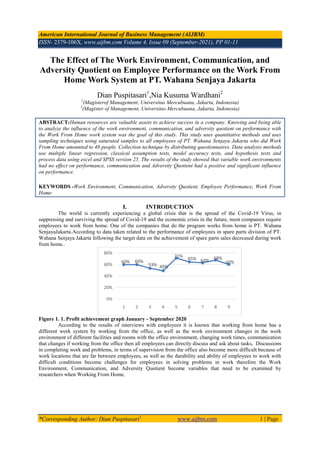
- 1. American International Journal of Business Management (AIJBM) ISSN- 2379-106X, www.aijbm.com Volume 4, Issue 09 (September-2021), PP 01-11 *Corresponding Author: Dian Puspitasari1 www.aijbm.com 1 | Page The Effect of The Work Environment, Communication, and Adversity Quotient on Employee Performance on the Work From Home Work System at PT. Wahana Senjaya Jakarta Dian Puspitasari1 ,Nia Kusuma Wardhani2 1 (Magisterof Management, Universitas Mercubuana, Jakarta, Indonesia) 2 (Magister of Management, Universitas Mercubuana, Jakarta, Indonesia) ABSTRACT:Human resources are valuable assets to achieve success in a company. Knowing and being able to analyze the influence of the work environment, communication, and adversity quotient on performance with the Work From Home work system was the goal of this study. This study uses quantitative methods and uses sampling techniques using saturated samples to all employees of PT. Wahana Senjaya Jakarta who did Work From Home amounted to 48 people. Collection technique by distributing questionnaires. Data analysis methods use multiple linear regression, classical assumption tests, model accuracy tests, and hypothesis tests and process data using excel and SPSS version 25. The results of the study showed that variable work environments had no effect on performance, communication and Adversity Quotient had a positive and significant influence on performance. KEYWORDS -Work Environment, Communication, Adversity Quotient, Employee Performance, Work From Home I. INTRODUCTION The world is currently experiencing a global crisis that is the spread of the Covid-19 Virus, in suppressing and surviving the spread of Covid-19 and the economic crisis in the future, most companies require employees to work from home. One of the companies that do the program works from home is PT. Wahana SenjayaJakarta.According to data taken related to the performance of employees in spare parts division of PT. Wahana Senjaya Jakarta following the target data on the achievement of spare parts sales decreased during work from home.. Figure 1. 1. Profit achievement graph January - September 2020 According to the results of interviews with employees it is known that working from home has a different work system by working from the office, as well as the work environment changes in the work environment of different facilities and rooms with the office environment, changing work times, communication that changes if working from the office then all employees can directly discuss and ask about tasks, Discussions in completing work and problems, in terms of supervision from the office also become more difficult because of work locations that are far between employees, as well as the durability and ability of employees to work with difficult conditions become challenges for employees in solving problems in work therefore the Work Environment, Communication, and Adversity Quotient become variables that need to be examined by researchers when Working From Home. 60% 60% 53% 49% 71% 65% 63% 68% 60% 0% 20% 40% 60% 80% 1 2 3 4 5 6 7 8 9
- 2. The Effect of Work Environment, Communication, and Adversity Quotient on... *Corresponding Author: Dian Puspitasari1 www.aijbm.com 2 | Page Figure 1.2. Pra-Survey Results Based on a pra-survey of 15 respondents at PT. Wahana Senjaya Jakarta is known that the variables that most affect employee performance are the work environment by 87%, communication by 73%, and Adversity Quotient by 67%. Employee performance decreased at work from home by 87% because employees felt less than optimal at work and tasks could not be completed properly when working from home. The purpose of this study was that researchers were able to explore and analyze the value of the influence of variables of the work environment, communication, and Adversity Quotient on employee performance during work from home at PT. Wahana Senjaya Jakarta. Researchers will provide input from the results of inni research to improve the work environment, communication, and Adversity Quotient related to employee performance for management as a consideration for the management of PT. Wahana Senjaya Jakarta and can make this research as a reference material to conduct scientific development in the field of HR management for the entire academic community. II. LITERATURE STUDIES AND HYPOTHESIS DEVELOPMENT Performance is a behavior that is depicted by a person in the form of achievements in work that employees create based on their role in the organization. Performance is important to achieve the goals of the company. Cashmere (2016) argues that performance is a result of work and a worker's work behavior at a certain period of time, generally one year. The results of work that can be done by an individual or group of people in a company quantitatively and qualitatively, in accordance with its authority and responsibilities, with the aim of obtaining from the objectives of the company concerned, legally or ethically or morally. Indicators to measure Cashmere Performance (2016) consist of Quality, Quantity, Time, Cost Savings, Supervision and Relationships between colleagues. Sedarmayanti (2017) argues that a set of tools and materials encountered, the environment in which a person works, how to work, and all ways of working individually, individually, or group is an understanding of the Work Environment. Good working conditions support employee productivity, which will affect employee efficiency levels. In the development of work environment variables there are several indicators according to (Sedarmayanti, 2017) namely lighting, air circulation, noise, facilities, and colors. In accordance with previous research if there is an influence of the work environment on performance (Judge Fachrezi, Hazmanan Khair; 2020). Then a hypothesis was made: H1: There is a positive influence on the work environment on performance during work from home at PT. Wahana senjaya Jakarta. Hamali (2016) argues that work communication is a process of conveying ideas and providing information in the form of orders and providing work instructions from the leadership to employees or subordinates in order to carry out work tasks as well as possible. Indicators of communication variables according to Afianti et al. (2016) are openness, empathy, support, positive feelings, and similarities. In accordance with previous research communication has a positive effect on employee performance (Purwanto S. Katidjan, SuharnoPawirosumarto, and Albertus Isnaryadi; 2017). Then a hypothesis was made: H2: There is a positive influence of communication on employee performance during work from home at PT. Wahana senjaya Jakarta. Stoltz (2010) in Rosita (2015) argues that adversity quotient as an intelligence in a person in the face of obstacles or difficulties. Adversity quotient can see how far a person can go when facing difficulties and a person's ability to 'overcome those difficulties'. Indicators from Adversity Quotentmeilputi Control, Origin and ownership, Reach, and endurance. In accordance with previous research that there is an influence of Adversity Quotient on performance (Nicco Nurman, 2017). Then a hypothesis was made: H3: There is a positive influence of Adversity Quotient on employee performance during work from home at PT. Wahana Senjaya Jakarta 53 33 87 73 40 67 87 47 67 13 27 60 33 13 0 20 40 60 80 100 Pra Survey Agree Disagree
- 3. The Effect of Work Environment, Communication, and Adversity Quotient on... *Corresponding Author: Dian Puspitasari1 www.aijbm.com 3 | Page III. RESEARCH METHODS The research design that the authors apply is a causal study is a research plan designed to investigate the existence of a causal relationship between variables. This survey approach is a quantitative approach based on data collection using surveys or questionnaires and knowing the relationship / impact of work environment indicators, communication and adversity quotient at PT. Wahana Senjaya Jakarta. Bound variables are performance and free variables are the result of work environment, communication and adversity quotient. The population of this study is all employees of PT. Wahana Senjaya Jakarta works from home. Since the population is less than 100 respondents, the authors used a saturated sample that took 100% of the population in PT. Wahana Senjaya Jakarta is 48 employees. Data analysis method using IBM SPSS version 25 for research data processing. Data processed from questionnaires is calculated by likert scale calculations and then descriptive analysis includes respondents' descripts and variable descriptions. Instrument testing tests the effectiveness of the instruments used and uses factor analysis to test the effectiveness of the contents. Therefore, reliability tests should only be conducted on statements that pass the validity test. Multiple linear regression analysis tests were used in this study. Ghozali (2016:8) argues that multiple linear regression analysis is used to test the influence of many free variables on bound variables. Data is processed with microsoft excel and solutions for products and services statistics (SPSS) version 25. Linear regression models are: Y = a+b1X1+b2X2+b3X3+e Information: Y=Employee Performance X1=Work Environment X2=Communication X3= Adversity Quotient a=Constant b=Regression Coefficient E = Standard Eror Classic assumption tests include normality tests that investigate whether the sample used can be distributed normally or not, multicollinearity testing aims to investigate whether regression models have correlations between independent variables, and heteroskedasticity tests function to investigate and see inequalities in variants or residuals or other observations. Model accuracy test with determination analysis in multiple linear regression is used to see the magnitude of the value of several variables X (X1, X2, X3) that occur in the rise and fall (variation of changes) variable Y and test F. Further hypothesis test that is test t in this study can see the many influences of variable x on variable y. It can be drawn a conclusion i.e. Ho rejected / H1 received from the hypothesis and create a correlation matrix between dimensions, R2 is a score for strong see and not in linear relationships between variables. IV. RESULT AND DISCUSSION 4.1. Deskriptive Statistics 4.1.1. RespondenDeskription Figure3.1. RespondenDeskription
- 4. The Effect of Work Environment, Communication, and Adversity Quotient on... *Corresponding Author: Dian Puspitasari1 www.aijbm.com 4 | Page Source: Primary Data processed SPSSvers 25, 2021 The results of the questionnaire on gender, the percentage of male by 87.5% with a frequency of 42 people and the percentage of female by 12.5% with a frequency of 6 people. Respondents who work at PT. Wahana Senjaya Jakarta is dominated by employees with the age of 26-35 years by 50% as many as 24 employees, the age of < 25 years as many as 12 people by 25%, the age of 36-45 years as many as 12 people by 25%. The last education of respondents with the last educated high school as many as 17 people amounted to 35.4%, D3 which is 12 people by 25% and the rest is 19 people by 39.6% educated S1. In the working period of respondents with a time of 1-5 years, namely 12 people by 25%, 6-10 years as many as 20 people by 41.7%, 11- 15 years as many as 14 people by 29.2% and the remaining 2 people by 4.2% with a time of 16-20 years. Respondents' status as contract employees as many as 12 people by 25%, and the status of respondents as permanent employees as many as 36 people by 75%. 4.1.2. Variabel Description Table 4.1. Variabel Description N Mean Skor Work Environment 48 2,37 low Communication 48 3,69 high AdversityQuotient 48 3,47 high Performance 48 3,05 medium Valid N (listwise) 48 Source: SPSS 2021 data processor Table above the average value on each dimension, it is concluded that employees feel the work environment when work from home is still low, employees feel communication when work from home is high, Adversity Quotient when work from home is high and employees feel performance when work from home is still low at moderate assessment. 4.2. Instrumen Test 4.2.1. Validity Test The results of the validity test found that 40 questionnaire instrument questions were tested with the Pearson Correlation test technique. The basis for the assessment taken in this validity test is: If the rhitung score> 0.284, then the question is called valid If the rhitung score< 0.284, invalid 4.2.1. 1. Work Environment Validity Test Table4.2. Results of Testing the Validity of Working Environment Instruments Dimension No r hit r table Result Lighting 1 0,642 0,284 Valid 2 0,613 0,284 Valid Air Circulation 3 0,672 0,284 Valid 4 0,580 0,284 Valid Noise 5 0,508 0,284 Valid 6 0,693 0,284 Valid Facilities 7 0,449 0,284 Valid 8 0,604 0,284 Valid Color 9 0,595 0,284 Valid 10 0,615 0,284 Valid Source: SPSS data processor 2021 After performing calculations through the way of correlate the value of each statement with the number of values, then the result is valid to measure the variable Work environment because rhitung> of rtabel 0.284. 4.2.1. 2. Communication Validity Test Tabel 4.3.Results of Testing the Validity of Communication Instruments Dimension No r hit r table Result Openness 11 0,612 0,284 Valid 12 0,643 0,284 Valid Empathy 13 0,763 0,284 Valid 14 0,655 0,284 Valid Support 15 0,709 0,284 Valid 16 0,616 0,284 Valid Positiveness 17 0,515 0,284 Valid
- 5. The Effect of Work Environment, Communication, and Adversity Quotient on... *Corresponding Author: Dian Puspitasari1 www.aijbm.com 5 | Page 18 0,566 0,284 Valid Equality 19 0,645 0,284 Valid 20 0,597 0,284 Valid Source: SPSS data processor 2021 In the Table, the correlation score of each questionnaire instrument statement > from rtabel which is 0.284 so that it is known that the statement on the questionnaire is considered valid to be able to measure on communication variables. 4.2.1. 3. Adversity QuotientValidity Test Tabel 4.4.Results of Testing the Validity of Adversity Quotient Instruments Dimension No r hit r table Result Control 21 0,747 0,284 Valid 22 0,629 0,284 Valid Origin & Ownership 23 0,653 0,284 Valid 24 0,781 0,284 Valid Reach 25 0,550 0,284 Valid 26 0,825 0,284 Valid Endurance 27 0,771 0,284 Valid 28 0,578 0,284 Valid Source: SPSS data processor 2021 For the correlation value of each statement instrument questionnaire > from rtabel which is 0.284 so that it is known that the statement on the questionnaire is considered valid to be able to measure on the Variable Adversity Quotient. 4.2.1. 4. Performance Validity Test Tabel 4.5. Results of Testing the Validity of Performance Instruments Dimension No r hit r table Result Qualitas 29 0,676 0,284 Valid 30 0,619 0,284 Valid Quantity 31 0,803 0,284 Valid 32 0,758 0,284 Valid Time 33 0,754 0,284 Valid 34 0,803 0,284 Valid Cost 35 0,774 0,284 Valid 36 0,647 0,284 Valid Supervision 37 0,775 0,284 Valid 38 0,627 0,284 Valid Relationships between coworker 39 0,740 0,284 Valid 40 0,679 0,284 Valid Source: SPSS data processor 2021 Employee Performance Variables have six dimensions of Quality, quantity, Time, Cost, Supervision and relationships between coworkers. This variable has six dimensions that have been developed into 12 question indicators based on indicators in accordance with the relevant theory. From the table above, the correlation value of each statement instrument questionnaire >rtabel = 0.284 to measure the employee performance variable of the statement is valid. 4.2.3.Instrument Reliability Test Reliability is used to describe the number of relatively stable assessments when they are repeated more than once. The results for this reliability test are: a. If cronbach Alpha > 0.70, then the problem value is valid b. When cronbach coefficient < 0.70 is invalid.. .Table4.6.Reliability Test Results Variabel Koefisien Cronbach`s Alpha Reliabel limit Resullt X1 = Work Environment 0,975 0,70 valid X2 = Communication 0,947 0,70 valid
- 6. The Effect of Work Environment, Communication, and Adversity Quotient on... *Corresponding Author: Dian Puspitasari1 www.aijbm.com 6 | Page X3= Adversity Quotient 0,937 0,70 valid Y = Employee Performance 0,956 0,70 valid Source: SPSS data processor 2021 This research variable can be declared reliable, and can be used in further analysis. 4.3. Multiple Linear Regression Test Table4.7.Multiple Linear Regression Test Coefficientsa Model Unstandardized Coefficients Standardized Coefficients t Sig. B Std. Error Beta 1 (Constant) -5.803 4.281 -1.355 .182 Work Environment .081 .073 .096 1.118 .269 Communication .483 .143 .372 3.372 .002 AdversityQuotient .817 .184 .510 4.448 .000 a. Dependent Variable: Performance Source: SPSS data processor 2021 multiple linear regression equations: Y = 0,081X1 + 0,483X2 + 0,817X3 + (-5,803) Information: Y = Var. Performance X1 = Var. Work Environment X2 = Var. Communication X3 = Var. Adversity Quotient The results of the regression equation above can be interpreted: •Constant values are worth -5,803, i.e. the intersection of regression lines with the Y axis that displays Performance when the variables are free: Work Environment (X1), Communication (X2) and Adversity Quotient (X3) equal to zero (0). • The value of X1 (Work environment) is worth 0.081, with significance (0.269 > 0.05), has an insignificant meaning. • The value of X2 (Communication) is worth 0.483, with significance (0.002 < 0.05). This means that an increase in the Communication variable will increase Employee Performance by 0.483. • The value X3 (Adversity Quotient) is worth 0.817 with significance (0.000 < 0.05). Each increase in the Adversity Quotient variable can increase employee performance by 0.817. significant regression equation is: Employee Performance = 0.483 Communication + 0.817 Adversity Quotient.. 4.3.1. Classic Assumption Test 4.3.2. Normalitaty Test The normality test is used to find out if the data collected is normal or comes from a normal population. If the Kolmogorov-Smirnov sig test has a significance of > 0.05 then the data is normal distribution.. Table.4.8. Normality Test Result One-Sample Kolmogorov-Smirnov Test Unstandardized Residual N 48 Normal Parametersa,b Mean .0000000 Std. Deviation 5.92558238 Most Extreme Differences Absolute .099 Positive .065 Negative -.099 Test Statistic .099 Asymp. Sig. (2-tailed) .200c,d a. Test distribution is Normal. b. Calculated from data. c. Lilliefors Significance Correction. d. This is a lower bound of the true significance.
- 7. The Effect of Work Environment, Communication, and Adversity Quotient on... *Corresponding Author: Dian Puspitasari1 www.aijbm.com 7 | Page Source: SPSS data processor 2021 Normality testing results showed a normal residual spread. Known significant value > 0.05 then residual is said to be spread normally with a significant value of 0.200 > 0.05. This means that residual values are distributed normally. Figure 4.1.Histogram Graph of Normality Test Source: SPSS data processor 2021 From the histogram chart it looks to provide a pattern of data that is normal distribution. Figure 4.2.P-Plot Graph of Normality Test Source: SPSS data processor 2021 In the chart above, it can be seen that a straight line is formed from the bottom left position to the upper right position along the diagonal. Which means the distribution of data extends around a straight line (not far from the line). line), meets normal requirements. 4.3.3. Multicollinearity Test Tabel 4.9.Multicollinearity Test Result Coefficientsa Model Unstandardized Coefficients Standardized Coefficients t Sig. Collinearity Statistics B Std. Error Beta Toleran ce VIF 1 (Constant) -5.803 4.281 -1.355 .182
- 8. The Effect of Work Environment, Communication, and Adversity Quotient on... *Corresponding Author: Dian Puspitasari1 www.aijbm.com 8 | Page Work Environment .081 .073 .096 1.118 .269 .897 1.114 Communication .483 .143 .372 3.372 .002 .546 1.831 Adversity Quotient .817 .184 .510 4.448 .000 .507 1.971 a. Dependent Variable: Performances Source: SPSS data processor 2021 The results on the multicollinearity test showed all tolerance scores > 0.10 and VIF values < 10, meaning that there was no multicollinearity in each independent variable.. 4.3.4. Heteroskedasticity Test The heteroskedasticity test is seen in the plot graph between variable predictive values bound to their residual values. Figure 4.3.Scatterplot Graph of Heteroskedasticity Test Source: SPSS data processor 2021 Heteroskedastity testing results there are points that appear to spread or are in a position around the number 0.The spread of the point does not make a special pattern, so it can be said if the data is homogeneous or does not experience symptoms of heteroskedastity. 4.4. Model Accuracy Test 4.4.1. F - Test F-test test to find out the joint influence between independent variables to dependent variables. The results of the F test are seen in the table below, if the probability score < 0.05 then H1 is accepted and rejects H0, whereas if the probability score >0.05 H0 is accepted. Table4.10.F Test Result ANOVAa Model Sum of Squares df Mean Square F Sig. 1 Regression 3979.628 3 1326.543 35.368 .000b Residual 1650.289 44 37.507 Total 5629.917 47 a. Dependent Variable: Kinerja b. Predictors: (Constant), AdversityQuotient, LingkunganKerja, Komunikasi Source: SPSS data processor 2021 F-count 35,368 > F-table 2,816, concluded Ho was rejected and H1 accepted, it was found that the variables of the Work Environment (X1), Communication (X2), and Adversity Quotient (X3) together had a significant and positive influence on Employee Performance (Y). 4.4.2. Coefficient of Determination Table.4.11.Coefficient of Determination Result Model Summary Model R R Square Adjusted R Square Std. Error of the Estimate 1 .841a .707 .687 6.124 a. Predictors: (Constant), AdversityQuotient, Work Environment, Communication Source: SPSS data processor 2021
- 9. The Effect of Work Environment, Communication, and Adversity Quotient on... *Corresponding Author: Dian Puspitasari1 www.aijbm.com 9 | Page Table above coefficient of determination (R2), it can be said that the Adj R Square score is worth 0.687, that means 68.7% of performance variables can be explained by variables Work environment, communication, and Adversity Quotient; and the rest with a value of 31.3% can be explained with other variables. 4.5. Test hypothesis test t The t test on multiple linear regressions can measure the partial effect of each free variable with the t test calculation. Tabel4.12.t Test Result Coefficientsa Model t Sig. B Std. Error Beta 1 (Constant) -5.803 4.281 -1.355 .182 Work Environment .081 .073 .096 1.118 .269 Communication .483 .143 .372 3.372 .002 AdversityQuotient .817 .184 .510 4.448 .000 a. Dependent Variable: Performance Source: Primary Data processed spssvers 25, 2021 1. Test the impact of the work environment on Employee Performance That from the variable working environment thitung value of 1,118 <ttabel 2.017 and significant value (sig) 0.269 > 0.05. the results Ho received and H1 rejected, Partially the work environment has no significant effect on employee performance of PT. Wahana Senjaya Jakarta. 2. Test the influence of Communication on Employee Performance From Table 4.20. It can be seen that from the communication variable the value of thitung 3.371 >ttabel 2.017 and the significant value (sig) of 0.002 < 0.05. The result is that Ho was rejected and H1 was accepted, so it can be stated that partially Communication has a significant effect on employee performance of PT.WahanaSenjaya Jakarta. 3. Test t influence of Adversity Quotient on Employee Performance. From Table 4.20. It can be seen that from the variable Adversity Quotient value thitung 4,448 >ttabel 2,017 and significant value (sig) 0,000 < 0.05. the result Ho was rejected and H1 received, i.e. partially affected the Performance of Employees pt. Wahana SenjayaJakarta.. 4.6. Inter-Dimensional Correlation Matrix Tabel 4.13.Inter-Dimensional Correlation Matrix Result Variabel Dimention Performance (Y) Pearson Correlations Qualitas (Y1.1) Quantity (Y1.2) Time (Y1.3) Cost (Y1.4) Supervision (Y1.5) Relationships between coworker (Y1.6) Work Environment (X1) Lighting (X1.1) .277** . 285 ** .302** .249** .233** .136** Air Circulation (X1.2) .266 ** . 298** .362** .239** .194** .107** Noise (X1.3) .303** .310 ** .362** .272** .212** . 101** Facilities (X1.4) . 343** .348** . 509** .332** . 121** .062** Color (X1.5) .289** .274 ** .431 ** .297** .164 ** .098 ** Communications (X2) Openness (X2.1) .304** . 662** .630** .547** . 662** .655 ** Empathy .443** . 711** . 593** . 560** .638** .658 **
- 10. The Effect of Work Environment, Communication, and Adversity Quotient on... *Corresponding Author: Dian Puspitasari1 www.aijbm.com 10 | Page (X2.2) Support (X2.3) .442** . 628** . 593** .560** .638** .658** Positiveness (X2.4) .252** . 571** . 271** .399** .567 ** .475** Equality (X2.5) .355** .543** .434** .459** .649** . 628** Adversity Quotient (X3) Control (X3.1) .466** .698** .653** .623** .689** .667** Origin & Ownership (X3.2) .680** . 580** .523** .608** .726** .721 ** Reach (X3.3) .576** .542** .449** .475** .623** .614** Endurance (X3.4) .630** .516 ** .428** .428** .741** .794** Source: SPSS data processor 2021 4.7. Discussion 4.7.1. The work environment (X1) has no effect on Employee Performance (Y) on the Work From Home work system. The hypothesis test result of the calculation obtained by thitung for the Work Environment is worth 1.118 with a significance of 0.269 > 0.05 where the value level of significance > then H1 is rejected. Based on the results of data calculations obtained that the Variable Work Environment (X1) has no influence and is not significant on Employee Performance (Y) on the Work From Home work system. The work environment on the dimension of facilities that employees do not get office facilities and equipment when working from home so employees are not maximal in doing work. 4.7.2. Communication (X2) affects Employee Performance (Y) on the Work From Home work system. The hypothesis test results of the calculation results obtained thitung for Communication amounted to 3.372 with a significance of 0.002 < 0.05 where the level of significance is smaller then H1 is accepted. Based on the results of data calculations, it was found that the Communication variable (X2) in this study had a positive and significant effect on employee performance variables (Y) in the Work From Home work system. This is supported by the research kowang Owe & Maiza (2019), Judge Fachrezi, Hazmanan (2020) in his research stated that communication has a significant influence on employee performance. If the better communication between employees in a company then employee performance will increase. The results of the correlation test between dimensions showed that dimensions with a strong level of relationships are indicated by the dimension of support, namely employees find it easy to get and provide information in completing work and tasks when working from home so that employees can work and complete their tasks on time.. 4.7.3. Adversity Quotient (X3) affects Employee Performance (Y) on the Work From Home work system. The hypothesis test results of the calculation results were calculated by thitung for Adversity Quotient of 3.366 with sig 0.001 < 0.05 where the level of significance is smaller then H1 is accepted. Based on the results of data calculations obtained that variable Adversity Quotient (X3) in this study has a positive and significant effect on employee performance variables (Y) in the Work From Home work system. Firza Umar (2019), Anggia sari & Wulandari (2018) in his research concluded that Adversity Quotient has a significant effect on Employee Performance. If the better adversity quotient owned by an employee then employee performance will increase.. V. CONCLUSIONS AND SUGGESTIONS 5.1. Conclusion Some conclusions on the results of the study and discuss the impact of the work environment, communication and indicators of difficulties on employee performance. That is, (1) the work environment has no effect and is not significant to the employee's work performance. (2) Communication has a significant positive effect on employee performance. The better communication, the more employees do a better job. Communication with the most influential employee performance based on correlation between variable dimensions is the empathy dimension. (3) Adversity quotient has a significant positive effect on employee performance. Based on the correlation between the measure of the difficulty variable and the employee's performance, the most influential factor is the measure of resistance.
- 11. The Effect of Work Environment, Communication, and Adversity Quotient on... *Corresponding Author: Dian Puspitasari1 www.aijbm.com 11 | Page 5.2. Suggestion Referring to the results of research on variables of the Work Environment, Communication, Adversity Quotient on Employee Performance at PT. Wahana Senjaya Jakarta, researchers give suggestion: 5.2.1.For Company Advice from researchers for PT. Wahana Senjaya Jakarta (1) Communication plays an important role when working from home because the distance and location are far between employees make communication between employees an important thing. The company must be able to make effective communication between leaders and employees, so that communication continues to run well when working from home. Companies need to maintain good communication so that employees easily get and provide work-related information so that work productivity is still achieved properly. Companies need to increase tolerance between employees so that employees can respect each other in giving opinions and providing input, so that discussions between colleagues can run smoothly. (2) The Company should be able to improve employee performance at work as much as possible and pay attention to any problems / difficulties that can hinder employees in work. Between coworkers and superiors can discuss each other to create the best solution of each problem so that all work can run and finish in a timely manner. 5.2.2.For Academics To academics who have plans to conduct research related to matters that have an influence on performance, it is recommended to be able to use work environment variables because the Work Environment variable has no significant effect and can conduct research in the same field by using this thesis as a reference. REFERENCE [1] Kasmir, ManajemenSumber Daya Manusia (Teori dan Praktek). Oleh: Raja GrafindoPersada, 2016. [2] Nuraeni, Almira Retno. Dampaklingkungankerja immaterial, job value quotient, dan kesulitanterhadapproduktivitaskaryawan (HMCPT Marketing Employee Survey, NusantaraSaktiKebumen). 2017 [3] Fachrezi, Hakim Fachrezi dan Khair, Hazmanan. (Pada 2020). Pengaruhkomunikasi, motivasi dan lingkungankerjaterhadapprestasikerjapegawai PT. Ankasapura II (Persero) PengepunganKualanamu. TinjauanIlmiah Magister AdministrasiBisnis, 3 (1), 107119. [4] Pawirosumarto, Suharno; Purwanto Katijan Sarjana dan Rachmad Gunawan. (2016). Dampaklingkungankerja, gayakepemimpinan, budayaorganisasi dan kinerjakaryawanterhadapkepuasankerja di hotel dan resort di Parador, Indonesia. JurnalInternasional Hukum dan Manajemen, 59 (6), TinjauanManajemen dan Pemasaran, 7 (3), 3 [5] Nurman, Nicco. (2018). Dampak adversity quotient, budayaorganisasi, dan pelatihanterhadapkinerja 50 pegawaikabupatenkota dan pegawai Badan Pengembangan Data (BKPSDM). [6] Gozari, Imam. "AplikasiAnalisisMultivariat Program IBM SPSS19", Edisi 5, Edisi V, Diponegoro University Press, Semarang. (2011) [7] Tan, KowangOwee and Husin, Maizaitulaidawati Md. (2019). Selidikidampakkomunikasi pada kinerjakaryawan. JurnalInternasionalRekayasa dan Teknologi (IJRTE) terbaru. 8 (3). DOI: 10.3590 /ijrte.C1213.1083S219 [8] Wulandari, Anggia Sari Lubis Sari. (2018). Pengaruh adversity quotient terhadapkinerjakaryawankarenamotivasikerjasebagaivariabelintervensi (“Studi pada pengemuditaksitradisional di Kota Medan”). *Corresponding Author: Dian Puspitasari1 1 (Magister Management, Universitas Mercubuana, Jakarta, Indonesia)