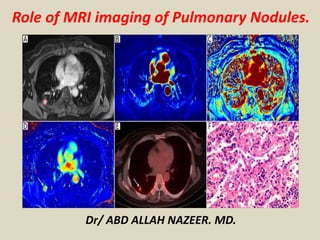
Role of MRI in Evaluating Pulmonary Nodules
•Download as PPTX, PDF•
2 likes•858 views

MRI can provide supplemental information to CT for evaluating pulmonary nodules. While MRI detection of nodules is not as sensitive as CT, it offers morphological data without ionizing radiation. Advanced MRI techniques like diffusion weighted imaging can help differentiate benign and malignant lung tumors based on tissue cellularity. DWI may also help predict patient survival and response to chemotherapy. Overall, MRI is a useful adjunct to CT for pulmonary nodule assessment and longitudinal evaluation of lung tumors.

Recommended
Recommended
More Related Content
What's hot
What's hot (20)
Similar to Role of MRI in Evaluating Pulmonary Nodules
Similar to Role of MRI in Evaluating Pulmonary Nodules (20)
More from Abdellah Nazeer
More from Abdellah Nazeer (20)
Recently uploaded
Recently uploaded (20)
Role of MRI in Evaluating Pulmonary Nodules
- 1. Dr/ ABD ALLAH NAZEER. MD. Role of MRI imaging of Pulmonary Nodules.
- 2. CT is the imaging method of choice for assessing pulmonary nodules in daily practice. In contrast, the use of pulmonary MRI has been limited by several shortcomings, including low signal-to-noise ratios due to low proton density in inflated lungs, artifacts related to the prominent magnetic susceptibility differences between air and soft tissue , and motion artifacts and loss of signal related to cardiac pulsation and respiratory motion. However, recent advances in MRI technology have addressed these issues. In addition to technologic improvements in MRI systems, dynamic administration of gadolinium contrast medium further improves image quality and yields functional information regarding pulmonary nodules. Diffusion-weighted MRI (DWI) may now be applied to chest imaging to help differentiate malignant and benign tumors. We review current MRI techniques for the evaluation of pulmonary nodules.
- 3. MRI Technique: Field Strength: The optimal field strength for evaluation of pulmonary nodules remains uncertain. MRI systems operating at 3 T afford increased signal-to-noise ratios and improved spatial resolution. Unfortunately, image quality may deteriorate because of susceptibility artifacts. With increasingly higher field strengths, sequence adjustments are required to reduce patient exposure to greater radiofrequency-associated specific absorption rates. This limits applications, such as breath-hold fast spin-echo sequences. Despite these disadvantages, studies have shown that 3-T systems afford higher lesion contrast, higher spatial resolution, and less image blurring with shorter echo trains at high acceleration factors than do 1.5-T systems. Thus, the image quality of 3-T systems may be equal to or slightly superior to that of 1.5-T systems for evaluation of pulmonary conditions. Compared with 1.5- to 3-T systems, lower-field-strength (0.2–0.5 T) systems may reduce susceptibility artifacts, potentially with increased lung signal intensity. Unfortunately, the gradient systems of most low-field-strength systems are inadequate for taking advantage of reduced susceptibility artifacts. Thus, state-of-the-art high-field- strength (1.0–3 T) systems are reasonable and practical choices for evaluation of pulmonary nodules with satisfactory image quality.
- 4. Sequences and Detectability: Reports of pulmonary nodule detection with MRI include both experimental and clinical data. Although varied sequences have been tested, 3D or 2D gradient- recalled echo (GRE) and T2-weighted fast spin-echo or T2-weighted HASTE sequences are most practical for detection of pulmonary nodules. The detection rates and sensitivities of MRI performed with 1.5-T and 3-T systems range between 45.5% and 96.0%. Spin-echo sequences are superior to GRE sequences. Puderbach et al suggested detailed standard protocols for lung MRI, including a transverse T1-weighted breath-hold 3D-GRE sequence that had high sensitivity for small lesions and a breath-hold coronal T2-weighted HASTE sequence that had high sensitivity for infiltrates. It is reasonable to assume a threshold size of 3–4 mm for detection of lung nodules with MRI under the optimal conditions of successful breath-holds for 20 seconds with reliable gating or triggering. Biederer et al. suggested that 90% of all 3-mm nodules are correctly diagnosed and that nodules 5 mm and larger are detected with 100% sensitivity. DWI is commonly included in routine protocols for chest MRI. DWI is highly sensitive to neoplastic tissue and has good contrast-to-noise ratios. DWI detection of pulmonary nodules is inferior to that of 3D GRE, fast spin echo, and HASTE. Chest DWI can depict relatively large metastatic lesions (> 1.0 cm), but utility is limited for the evaluation of small lung nodules. The sensitivity for small nodules measuring 6–9 mm is 86.4%, but for nodules smaller than 5 mm it is only 43.8%.
- 5. DWI can be used to differentiate malignant from benign lesions on the basis of tissue cellularity according to two criteria. First, apparent diffusion coefficient (ADC) cutoff values less than 1.1–1.4 × 10⁻³ mm2/s) had sensitivity and specificity of 70–83% and 74–97% for pulmonary malignancy. Second, the lesion–to–spinal cord ratio signal intensity cutoff value of 1.135 had sensitivity of 83%, specificity of 90%, and accuracy of 86% for determination of lung malignancy . Another study showed that when the cutoff value was 1.0 and the signal intensity of the lesion was equal to or greater than that of the thoracic spinal cord, the lesion–to–spinal cord ratio had sensitivity of 89%, specificity of 61%, and accuracy of 80% DWI findings have been reported to have prognostic value in the detection of lung cancer. Early ADC changes observed after the initial chemotherapy course reportedly correlated with the final tumor size reduction. Ohno et al. found that overall patient survival significantly changed with a cutoff ADC of 2.1 ×10⁻³ mm2/s, suggesting that ADC has potential as a biomarker for predicting the response of non–small cell lung cancer to chemotherapy.
- 6. CT image shows low attenuation spot (arrow) within nodule, suggesting lipoid tissue. Axial T1-weighted (B) and T2-weighted (C) MR images show hyperintense spots (arrows) within nodule. T2- weighted image (C) also shows hyperintense matrix consistent with cartilaginous tissue.
- 7. T1-weighted (A) and T2-weighted (B) MR images show mixed pattern of hyperintense and hypointense spots in nodule (arrow). Findings are typical of sclerosing hemangioma.
- 8. A 71-year-old man with 11.3 mm pulmonary nodule in the right lower lobe (arrow).The nodule is well visualized on CT (A) as well as on all MR images: T1 VIBE (B), T1 out-of-phase (C), T2 TSE (D), T2 HASTE (E), T2 SPIR (F), T2 STIR (G).
- 9. A 62-year-old man with 5.6 mm pulmonary nodule in the right lower lobe (arrow). The lesion is seen on CT (A) as well as on T1 VIBE (B), T1 out-of-phase (C) and T2 SPIR (F) images, whereas T2 TSE (D), T2 HASTE (E) and T2 STIR (G) images were negative.
- 10. Diffusion-weighted MR image shows stronger signal intensity of nodule (arrow) than of spinal cord, strongly suggesting malignancy rather than rounded atelectasis. CT image shows irregular nodule (arrow) at periphery of right lower lobe in patient with multiple pleural plaques. Differentiation between rounded atelectasis and malignancy is always dilemma in such cases.
- 11. Diffusion weighted magnetic resonance imaging. a–b) Axial, c) sagittal and d) coronal diffusion weighted magnetic resonance imaging showed a very intense nodular structure in the right upper lobe, suspected to be a tumoral lesion. The lesion was removed surgically and adenocarcinoma was confirmed on histopathology.
- 12. Axial T1 weighted image shows a nodule in the posterior left upper lobe (a), axial T2 weighted image shows a hypointense nodule in the posterior left upper lobe (b), axial diffusion weighted image obtained with a b factor of 1000 s/mm2 shows a nodule with low signal intensity compared with the spinal cord (c); it scored 2 on the 5-point rank scale. The spinal cord scored 3 on the 5-point rank scale on DW images obtained with a b factor of 1000 s/mm2. Axial apparent diffusion coefficient value of the lesion (2.190×10⁻³) (d), when the b factor was taken as b=1000 mm2/s; this was higher than our cut-off value (1.5×10⁻³).
- 13. Axial (a) and coronal (b) T2-weighted echo-planar image obtained with a b factor of 0 s/mm2 shows a mass with a slightly lower signal intensity compared with the CSF and a high signal intensity compared with the dorsal muscle; it scored 4 on the 5-point rank scale. CSF scored 5 on the 5-point rank scale on the T2-weighted image obtained with a b factor of 0 s/mm2. The dorsal muscle scored 2 on the 5-point rank scale on T2-weighted images obtained with a b factor of 0 s/mm2. Axial T1-weighted image shows a mass in the right upper lobe (c), axial diffusion weighted echo- planar image obtained with a b factor of 1000 s/mm2 shows a mass with very high signal intensity compared with the spinal cord (d); it scored 5 on the 5-point rank scale. The spinal cord scored 3 on the 5-point rank scale on DW images obtained with a b factor of 1000 s/mm2, axial apparent diffusion coefficient value of the lesion (1.05×10⁻³) (e), when the b factor was taken as b=1000 mm2/s; this was lower than our cut-off value (1.5×10⁻³).
- 14. Differences in DWI using STIR and SPIR acquisition on a 3-T magnet. Two DWI images were acquired in the same patient affected by an epidermoid carcinoma (arrows) using the same b value (1000 s/mm2). (A) DWI with STIR (DWIBS) and (B) DWI with spectral fat suppression. Spectral fat suppression DWI has a higher signal-to-noise ratio compared with the DWIBS sequence.
- 15. Pulmonary metastasis of renal carcinoma at 3-T magnet. (A) Respiratory- triggered SS EPI DWI sequence with spectral fat suppression and a b value of 900 s/mm2 nicely depicts a metastasis in the upper lobe of left lung. (B) Black-blood STIR TSE shows the lesion similarly to DWI.
- 16. Pulmonary metastases of papillary thyroid carcinoma. (A) Axial black-blood STIR image shows several bilateral millimetric pulmonary metastases and enlarged prevascular and bilateral hilar lymphadenopathies, probably representing lymph node metastases. Respiratory-triggered SS EPI DWI sequence with SPIR on a 1.5-T magnet with b values of 150 s/mm2 (B) and 500 s/mm2 (C) demonstrate a lesser number of pulmonary metastases than STIR. The enlarged lymph nodes are also less evident.
- 17. Metastatic adenopathies of poorly differentiated lung adenocarcinoma. (A, B) Free breathe SS EPI DWI sequence with SPIR on a 1-T magnet with a b value of 800 s/mm2 at two different levels demonstrates a mass with restricted diffusion in the superior segment of the right inferior lobe corresponding to a pulmonary adenocarcinoma (red arrow) (A) and metastatic right hilar (white arrow on A) and right paratracheal adenopathies (white arrow on B).
- 18. Transverse diffusion-weighted (DW) echo-planar image (3,084/70) obtained with b factor of 1,000 s/mm2 shows mass (arrow) with very high signal intensity compared with spinal cord; it scored 5 on 5-point rank scale. Transverse T1-weighted image (TR/TE, 150/4.6) shows mass (arrow) in right upper lobe.
- 19. Transverse diffusion-weighted (DW) image (9,050/50) obtained with b factor of 1,000 s/mm2 shows nodule (arrow) with very high signal intensity compared with spinal cord; it scored 5 on 5-point rank scale. Spinal cord scored 3 on 5-point rank scale on DW images obtained with b factor of 1,000 s/mm2. Sagittal T1-weighted image (TR/TE, 1,000/12) shows nodule (arrow) in left upper lobe.
- 20. CT image (A), positron emission tomography image (B), and diffusion-weighted image (C) of lung cancer patient.
- 21. A 58-year-old woman with right inferior lobe moderately differentiated adenocarcinoma. a Plain CT image shows a homogeneous nodule (arrow) in the right inferior lobe near diaphragm. b, c T2-weighted fast recovery fast spin echo image and DW image with b=500 s/mm2 shows a hyperintense nodule (arrow) in relation to skeletal muscle. d ADC mapping with the same slice reveals that the ADC value of the nodule is 1.320×10⁻³ mm2/s
- 22. A 76-year-old woman with left inferior lobe adenosquamous carcinoma. a Plain CT image before surgery shows a homogeneous nodule (arrow) in the left inferior lobe. b T2-weighted fast recovery fast spin echo image shows a hyperintense nodule (arrow) in relation to skeletal muscle. c On a DW image with b=500 s/mm2 of the same slice, the nodule (arrow) shows hyperintensity compared with skeletal muscle. d ADC mapping with the same slice reveals that the ADC value of the nodule (arrow) is 1.050×10⁻³ mm2/s
- 23. A 61-year-old man with left lower lobe squamous cell lung cancer. Axial computed tomography (A), diffusion weighted (B), and ADC map (C) images show right lower lobe lesion with irregular contour. Lesion ADC min was 1.49 3 10 23 mm 2 /s and LSR was 1.56.
- 24. Conclusion: Although MRI detection of pulmonary nodules is inferior to CT detection, MRI yields supplementary morphologic information that is valuable for differential diagnosis. Furthermore, the lack of ionizing radiation makes MRI a safe tool for repeated dynamic evaluations of tumor perfusion. Finally, DWI can be used to differentiate benign and malignant tumors according to tissue cellularity signatures and for prognostic assessment of tumor responses to therapy.
- 25. Thank You.