2. Base has 6 sectors on each side:
AS: anterior fibromuscular stroma
TZ: anterior and posterior
transition zone
PZ: anterior and posterior zone
CZ: central zone around the
ejaculatory ducts
Midportion also has 6 sectors on
each side:
AS: anterior fibromuscular stroma
TZ: anterior and posterior
transition zone
PZ: anterior, posteromedial and
posterolateral peripheral zone
Apex also has 6 sectors on each
side:
AS: anterior fibromuscular stroma
TZ: anterior and posterior
transition zone
PZ: anterior, posteromedial and
posterolateral peripheral zone
Seminal vesicles are divided into
left and right
Urethral sphincter is marked in
the prostate apex and along the
membranous segment of the
urethra.
3.
4.
5.
6.
7.
8.
9.
10.
11.
12.
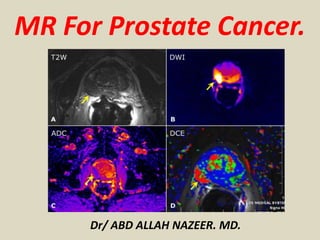
13. MRI of the prostate has become increasingly popular with the use
of multiparametric MRI and the PI-RADS classification.
Multiparametric MRI is a combination of T2-weighted, Diffusion
and dynamic contrast-enhanced imaging and is an accurate tool
in the detection of clinically significant prostate cancer.
The introduction of the Prostate Imaging Reporting and Data System
(PI-RADS) classification for prostate MRI in 2012 lead to a more
standardized acquisition, interpretation and reporting of prostate MRI.
1- T2: Peripheral zone exhibit high signal intensity.
- Peripheral zone cancers have low T2 signal intensity-the lower
the intensity the higher grade the disease.
- Cancer more difficult to discern in the transition zone due to signal
heterogeneity in this region.
2- Diffusion weighted MR images (DWI) at the peripheral zone can help
identify high-risk disease.
3-Dynamic contrast enhanced MR allows evaluation of contrast kinetics
cancer enhances quickly, more intensely and with a faster washout.
33. PIRAD 2:
well defined T2W
hypointensity in
the left peripheral
zone with
corresponding
mild ADC drop
however, with no
DW restriction
and no early
arterial
enhancement.
34. PIRAD 3:
ill-defined T2W
hypointensities in
both peripheral
zones with mild to
moderate ADC
drop and diffuse
enhancement on
DCE however, no
DW restriction.
This is an
indeterminate
lesion requiring
further evaluation
with a TRUS
biopsy.
35. PIRAD 4:
T2W hypointense
lesion in the left
transitional zone
(less than 1.5cm)
with corresponding
DW restriction,
marked ADC drop
and early arterial
enhancement on
DCE. This is a
definitive
neoplastic lesion
36. PIRAD 5:
a large T2W
hypointense lesion
involving both
peripheral and
transitional zones
(more than 1.5cm)
with corresponding
DW restriction,
marked ADC drop
and early arterial
enhancement on
DCE. There is breach
of the prostatic
capsule with
involvement of the
seminal vesicles and
loss of fat plane with
the rectum. This is an
obvious neoplastic
lesion with local
spread.
37.
38.
39.
40.
41.
42.
43.
44.
45. PI-RADS scoring
system - DWI and
ADC map. T2-wi:
hypointense
tumoral nodule
located in the
central gland at the
level of the base of
the prostate
(arrow); DWI/ADC
map: high signal in
the lesion on DWI
corresponding to
low signal on ADC
map indicating
restricted diffusion
(arrowheads).
46. T4 stage. Prostate tumor invading both seminal vesicles (blue arrows) and distal rectum (white arrowheads); obliteration
of the fat plane between tumor and the bladder wall (blue arrowhead); left iliac adenopathy (white arrow).
47.
48.
49.
50.
51.
52.
53.
54.
55.
56.
57.
58.
59. Multiparametric MR imaging of the prostate (65-year-old man, PSA level of 8.3 ng/mL, clinical stage T2c, Gleason score of 7 [3+4])
in screenshot generated by a computer-program, which can be used for image interpretation in multiparametric MR imaging. In
addition to related views of multiplanar multiparametric images (A–E), quantitative information (F) is also displayed. A–E show
tumor with bulging, suspicious for minimal stage T3A disease, in right peripheral zone at level of midprostate to apex (arrow). A,
Axial Ktrans map from dynamic contrast-enhanced MR imaging projected over T2-weighted image (see Fig 2 for parameters). B,
Sagittal T2-weighted image (4290/98; flip angle, 120°) with color overlay showing washout (from dynamic contrast-enhanced MR
imaging). C, Axial ADC map (2900/81; flip angle, 90°). D, Axial DW trace image (b = 800 sec/mm2; 2900/81; flip angle, 90°). E, Axial
T2-weighted image. F, Relative gadolinium concentration–time curve (left) and MR spectrum (right) from chosen point of interest in
tumor (+). In MR spectrum, choline (chol) and citrate (cit) peaks can be evaluated. The low-signal-intensity lesion on E shows
increased Ktrans (on A), restriction on C, high signal intensity on D, gadolinium concentration–time curve type 3 and high choline
peak on F. On a five-point scale, this can be scored 5/5 on T2-w, dynamic contrast-enhanced, DW, and MR spectroscopic images, for
total score of 20/20, indicating intermediate to highly aggressive tumor.