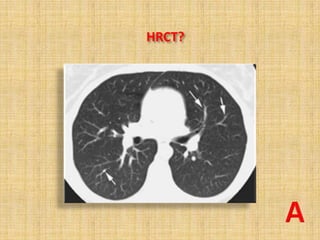
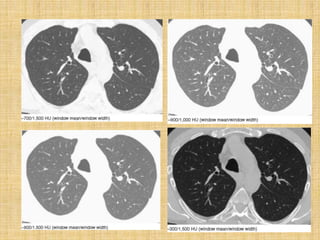
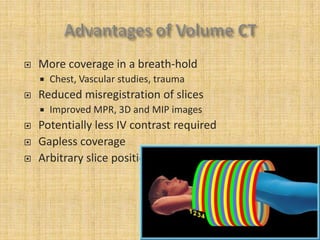
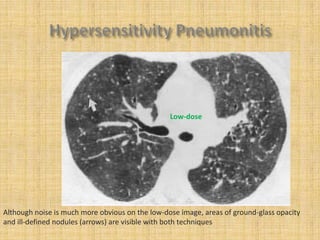
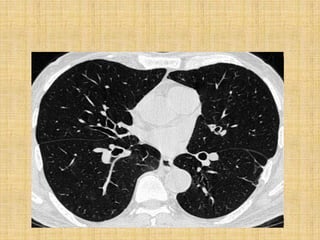
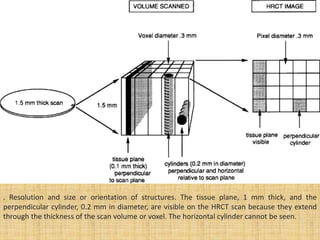
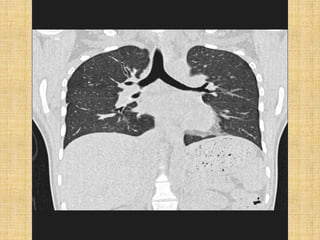
SlideShare a Scribd company logo
1 of 177
PRESENTED BY : DR SHAMIM

GUIDED BY    : DR A PATIL (MD)

GMC BHOPAL
HRCT?
HRCT?
HRCT?
HRCT?
High Resolution Computed Tomography

   Resolution :
       A formal statement of a decision or expression of opinion
        put before or adopted by an assembly such as the U.S.
        Congress.????
High Resolution Computed Tomography

   Resolution :
       Ability to resolve small object that are close together , as
        separate form.
   A scan performed using thin collimation and
    high- spatial frequency algorithm to
    accentuate the contrast between tissue of
    widely differing densities, e.g..,
     - air & vessels (lung)
     - air & bone (temporal & paranasal sinus)
The basic premise is simple,


  maximize spatial resolution by
  using the thinnest collimation and
  a high spatial frequency
  algorithm
   Narrow x-ray beam collimation:
              0.5-1 mm vs. Conventional 3-10mm
   Cross sections are further apart:
              10 mm intervals (random sampling)
   High- spatial frequency algorithm
   No i.v. Contrast needed
       Inherent contrast
       Mediastinum is not best studied
maximize spatial resolution by
using the thinnest collimation and
a high spatial frequency
algorithm
   Thin sections 0.5 – 1.5 mm is essential for optimal
    spatial resolution

   Thicker slices are prone for volume averaging and
    reduces ability to resolve smaller structure
   With thick collimation, for example, vessels that lie
    in the plane of scan look like vessels (i.e., they
    appear cylindrical or branching) and can be clearly
    identified as such.

   With thin collimation, vessels can appear
    nodular, because only short segments may lie in the
    plane of scan;
maximize spatial resolution by
using the thinnest collimation and
a high spatial frequency
algorithm
   Denotes the frequency at which the acquired scan
    data are recorded when creating the image.

   Using a high-resolution algorithm is critical element
    in performing HRCT.
   With conventional body CT, scan data are usually
    reconstructed with “standard” or “soft-tissue”
    algorithms, that smoothes the image, reduces
    visible image noise,.


   High spatial frequency or sharp algorithm (bone
    algorithm) is used which reduces image smoothing
    and better depicts normal and abnormal
    parenchymal interface
   Matrix size : Largest available matrix be used 512 x
    512

   Field of view : Smallest FOV that will encompass the
    patient is used as it will reduce the pixel size.
    (commonly 35 to 40)

   Retrospectively targeting image reconstruction to a
    single lung instead of the entire thorax significantly
    reduces the FOV and image pixel size, and thus
    increases spatial resolution.
   Sharp reconstruction algorithm,
       increase image detail,
       increase the visibility of noise in the CT image .
Noise = 1/√ mAs X Kvp X scan time


it is inversely proportional to the square root of the product of the mA and scan time).
   Sharp reconstruction algorithm,
       increase image detail,
       increase the visibility of noise in the CT image .
   Much of this noise is quantum-related and thus
    decreases with
        increased number of photons ,
       increasing the mA or kV(p) used during scanning, or
        increasing scan time,
Noise = 1/√ mAs X Kvp X scan time


it is inversely proportional to the square root of the product of the mA and scan time).
   In HRCT image, noise is more apparent than
    standard CT.

   Noise = 1/√ mAs X Kvp X scan time

   Scan Time is kept low as possible to minimize
    motion artifact, increasing scan time is not feasible,

   mAs and Kvp are INCREASED to reduce noise
   For routine technique –
          Kvp -- 120-140
          mAs -- 200- 300

   Scan Time : As low as possible (1-2 sec) to minimize
    motion artifact.
   For routine technique –
          Kvp -- 120-140
          mAs -- 200- 300

   Scan Time : As low as possible (1-2 sec) to minimize
    motion artifact.

   Increased patient and chest wall thickness are
    associated with increase image noise, may be
    reduced by increasing mAs and Kvp
   Effect of kV(p) and mA on image noise. HRCT scans
    obtained with kV(p)/mA settings of 120/100 (A)
    and 140/170 (B). Noise is most evident posteriorly
    and in the paravertebral regions. Although noise is
    greater in A, the difference is probably not
    significant clinically. Nonetheless, increasing the
    kV(p)/mA is optimal. Also note pulsation (“star”)
    artifacts in the left lung on both images and a
    “double” left major fissure.
    Collimation: thinnest available collimation (1.0-1.5 mm).
    Reconstruction algorithm: high-spatial frequency or
    “sharp” algorithm (i.e., GE “bone”).
    Scan time: as short as possible (1 sec or less).
    kV(p), 120-140; mA, 240.
    Matrix size: largest available (512 × 512).

    Optional
    kV(p)/mA: Increased kV(p)/mA (i.e., 140/340).
       Recommended in large patients. Otherwise optional.
    Targeted reconstruction: (15- to 25-cm field of view).
    Reduced mA (low-dose HRCT): 40-80 mA.
    At least one consistent lung window setting is
    necessary. Window mean/width values of -600 HU to -
    700 HU/1,000 HU to 1,500 HU are appropriate. Good
    combinations are -700/1,000 HU or -600/1,500 HU.
    Soft-tissue windows of approximately 50/350 HU
    should also be used for the mediastinum, hila, and
    pleura.
    Windows: Windows may need to be customized; a low-
    window mean (-800 to -900 HU) is optimal for
    diagnosing emphysema. For viewing the mediastinum,
    50/350 HU is recommended. For viewing pleuro-
    parenchymal disease, -600/2,000 HU is recommended.
   Slice thickness: 3-10 mm

   Scans a large volume, very quickly

   Volumetric scan - Covers the full lung

   +/- contrast
   Standard before helical CT
   Differs from helical CT technique in that slices are
       not contiguous
   Move the patient, stop, and scan

   All other parameters same

   Adv: lower radiation dose
   Transverse images of thin slices of lung (1-1.3 mm thick)
    are obtained at non-contiguous intervals, usually 1 to 2
    cm apart, throughout the whole lung.
   The computer reconstructs the images to give high
    spatial resolution.

   This process results in images that show detail, but only
    5 to 10% of the lung is sampled.

   This sampling is appropriate for evaluating diffuse lung
    disease, focal lesions may require more images.
      Obtained at 1cm intervals from lung apices to bases.
    In this manner, HRCT is intended to “sample” lung
    anatomy

     It is assumed that the findings seen at the levels
    scanned will be representative of what is present
    throughout the lungs

     Results in low radiation dose as the individual scans
    are widely placed


                                                              48
1. Viewing of contagious slice for better delineation of
   lung abnormality
 2. Complete imaging of lung and thorax

 3. Reconstruction of scan data in any plane using MIPs
 or MinIPs.

 4. Diagnosis of other lung abnormalities
Disadvantage : greater radiation dose. It delivers 3-5
   times greater radiation.

                                                           49
   Multidetector CT is equipped with a multiple row
    detector array
   Multiple images are acquired due to presence of
    multiple detectors
   Advantages : - shorter acquisition times and
    retrospective creation of both thinner and thicker
    sections from the same raw data
   Acquisition time is so short that whole-lung HRCT
    can be performed in one breath-hold.

                                                         50
   More coverage in a breath-hold
       Chest, Vascular studies, trauma
   Reduced misregistration of slices
       Improved MPR, 3D and MIP images
   Potentially less IV contrast required
   Gapless coverage
   Arbitrary slice positioning
   Various study shows the image quality of axial HRCT
    with multi-detector CT is equal to that with
    conventional single-detector CT.
   HRCT performed with spaced axial images results in
    low radiation dose as compared with MD-HRCT.

   Increased table speed may increase the volume-
    averaging artifact and may result in indistinctness of
    subtle pulmonary abnormalities.

   MDCT provides for better reconstruction in Z axis

                                                             55
•   Low dose HRCT uses Kvp of 120- 140 and mA of 30-20 at
    2 sec scan time.
•   Equivalent to conventional HRCT in 97 % of cases
•   Disadvantage : Fails to identify GGO in few cases and
    have more prominent streak artifact.
•   Not recommended for initial evaluation of patients with
    lung disease.
•   Indicated in following up patients with a known lung
    abnormality or in screening large populations at risk for
    lung ds.

                                                                56
Conventional-dose
Low-dose


Although noise is much more obvious on the low-dose image, areas of ground-glass opacity
and ill-defined nodules (arrows) are visible with both techniques
“The authors concluded that HRCT images
acquired at 20 mA yield anatomic information
equivalent to that obtained with 200-mA scans
in the majority of patients without significant
loss of spatial resolution or image degradation”
In 16-slice and higher scanners, the
current protocol is to do a volume
scan   in   2-5   seconds   and   then
retrospectively reconstruct the images
as 1mm at 0.5mm intervals and to
review the stack on the workstation
   Annual background radiation ----- --- 2.5 mSv
   PA CHEST Radiograph ----- ----- ----- 0.05 mSv
   Spaced axial HRCT (10mm space) ----- 0.7 mSv ( 14 X ray)
   Spaced axial HRCT (20 mm space) ------ 0.35 mSv ( 7 X ray)
   Low Dose Spaced axial HRCT      -------- 0.02 mSV
   MD-HRCT                    ---- ------- 4 - 7 msv ( 60-80 x ray)

Combining HRCT scan at 20 mm interval with low mAs scan (40 mAs)
   would result in radiation comparable to conventional X ray.
                                                                       61
Decision should be tailored for individual cases
   Detect interstitial lung disease not seen on chest x-
    ray
   Abnormal pulmonary function tests
   Characterize lung disease seen on X-ray
   Determine disease activity
   Find a biopsy site
   Hemoptysis
   Diffusely abnormal CXR
   Normal CXR with abnormal PFT’s
   Baseline for pts with diffuse lung disease
   Solitary pulmonary nodules
   Reversible (active) vs. non-reversible (fibrotic) lung
    disease
   Lung biopsy guide
   F/U known lung disease
   Assess Rx response
Training          Validation
   • Clinical           27%               29%
   • CXR                4%                9%
   • CT                 49%               36%
   • Clinical & CXR     53%               77%
   • Clinical, CXR & CT 61%               90%
Conclusion: HRCT both superior and additive to clinical and CXR
   data
   FULL INSPIRATION
   BREATH HOLD
   EXPIRATORY SCAN WHENEVER INDICATED
   SUPINE AND PRONE IF INDICATED
   Useful to determine if there is small
   airway disease
   • Normal lung increases in density at endexpiration
   • Abnormal lung due to air trapping fails
   to increase in density on expiration
   Practically, these are the most important
    parameters to work with when performing HRCT
    scans
   If providing films is still important, then the filming
    should be done such that the pleural margins and
    ribs are seen with an optimum grey-sca
    maximum intensity projection (MIP) is a volume
    rendering method for 3D data that projects in the
    visualization plane thevoxels with maximum
    intensity that fall in the way of parallel rays traced
    from the viewpoint to the plane of projection
(a) Volume-rendered image provides clear definition of individual vessels. (b) MIP image
reconstructed from the same volume data shows all of the vessels, but their outlines merge; it
is impossible to visualize the spatial relationships between the vessels or to delineate individual
vessels on the MIP image.
   Maximum-intensity projection (MIP) image in a
    patient with small lung nodules obtained using a
    multidetector-row spiral CT scanner with 1.25-mm
    detector width and a pitch of 6. A: A single HRCT
    image shows two small nodules (arrows) that are
    difficult to distinguish from vessels. B: An MIP
    image consisting of eight contiguous HRCT images,
    including A, allows the two small nodules to be
    easily distinguished from surrounding vessels.
   first step in HRCT interpretation of diffuse lung
    diseases is a good quality scan
. Resolution and size or orientation of structures. The tissue plane, 1 mm thick, and the
perpendicular cylinder, 0.2 mm in diameter, are visible on the HRCT scan because they extend
through the thickness of the scan volume or voxel. The horizontal cylinder cannot be seen.
   Combined “routine” and HRCT studies
       5 mm sections q 5 mm (separate lung and mediastinal
        reconstruction algorithms):
       1 – 1.25 mm sections q 10 mm (lung algorithm)
   Optional image acquisitions
       Supine and prone 1 – 1.25 mm sections
       Inspiratory/expiratory 1 -1.25 mm sections
       Low dose technique (mAs 40 – 80)
   Optional Reconstruction techniques
       Sliding maximum and minimum intensity projection
        images (MIPs/ MINIPs): 5 mm’s q 5 mm
   Right lung is divided by major and minor fissure
    into 3 lobes and 10 bronchopulmonary segments
   Left lung is divided by major fissure into 2 lobes
    with a lingular lobe and 8 bronchopulmonary
    segments
   The trachea (windpipe) divides into left and the
    right mainstem bronchi, at the level of the sternal
    angle (carina).
   The right main bronchus is wider, shorter, and more
    vertical than the left main bronchus.
   The right main bronchus subdivides into three lobar
    bronchi, while the left main bronchus divides into
    two.
   The lobar bronchi divide into tertiary bronchi, also
    known as segmental bronchi, each of which
    supplies a bronchopulmonary segment.
   The segmental bronchi divide into many primary
    bronchioles which divide into terminal
    bronchioles, each of which then gives rise to
    several respiratory bronchioles, which go on to
    divide into two to 11 alveolar ducts. There are five
    or six alveolar sacs associated with each alveolar
    duct. The alveolus is the basic anatomical unit of
    gas exchange in the lung.
   Airways divide by dichotomous branching, with
    approximately 23 generations of branches from the
    trachea to the alveoli.
   The wall thickness of conducting bronchi and
    bronchioles is approximately proportional to their
    diameter.
   Bronchi with a wall thickness of less than 300 um is not
    visible on CT or HRCT.
   As a consequence, normal bronchi less than 2 mm in
    diameter or closer than 2 cm from pleural surfaces
    equivalent to seventh to ninth order airways are
    generally below the resolution even of high-resolution
    CT
There are approximately 23 generation of
dichotomous branching
From trachea to the alveolar sac


HRCT can identify upto 8th order central
bronchioles
   Lung is supported by a network of connective tissue
    called interstitium
   Interstitium not visible on normal HRCT but visible
    once thickened.
   Interstitium is constituted by
       AXIAL fibre system (peribronchovascular & centrilobular),
       PERIPHERAL fibre system (subpleural & interlobular
        septa) and
       SEPTAL fibre system (intralobular septa)
Lung
                                interstitium


             Axial fiber                                Peripheral fiber
              system                                        sysem


Peribronchovascular        Centrilobular        Subpleural            Interlobular
     interstitium           interstitium       interstitium              septa
   The peribronchovascular interstitum invests the bronchi
    and pulmonary artery in the perihilar region.

   The centrilobular interstitium are associated with small
    centrilobular bronchioles and arteries

   The subpleural interstitium is located beneath the visceral
    pleura; envelops the lung into fibrous sac and sends
    connective tissue septa into lung parenchyma.

   Interlobular septa constitute the septas arising from the
    subpleural interstitium.


                                                                108
   It is the smallest lung unit that is surrounded by
    connective tissue septa.
   It measures about 1-2 cm and is made up of 5-15
    pulmonary acini, that contain the alveoli for gas
    exchange.
   The secondary lobule is supplied by a small
    bronchiole (terminal bronchiole) in the center, that
    is parallelled by the centrilobular artery.
   Pulmonary veins and lymphatics run in the
    periphery of the lobule within the interlobular
    septa.
   Secondary lobulus
       Most important structure
       Smallest functional unit seen on CT Scans
   Interstitium
   Inter‐/intralobar septum
   Central artery
   Central bronchiolus
   Interlobular septa and contiguous subpleural
    interstitium,

   Centrilobular structures, and

   Lobular parenchyma and acini.
A group of terminal bronchioles
Accompanying pulmonary arterioles
Surrounded by lymph vessels
Pulmonary veins
Pulmonary lymphatics
 Pulmonary lymphatics
Connective Tissue Stroma
   Primary Lobule: Lung parenchyma associated with
    a single Alveolar duct.


   4-5 Primary Lobules  Acinus
The normal pulmonary vein branches are seen marginating pulmonary lobules.
The centrilobular artery branches are visible as a rounded dot
TRACHEA

RIGHT               LEFT
APICAL              APICAL
SEGMENT             SEGMENT
ESOPHAGUS
RB1               LB1
LEFT MAIN
            RIGHT MAIN            BRONCHUS
            BRONCHUS


                                              LB3
RB3                      CARINA


                                                    LB1,2

      RB2           RB1
RB5        BRONCHUS
                       INTERMEDIUS   LEFT UL
                                     BRONCHUS


RML                                             LUL


            RIGHT ML
      RLL                                 LLL
            BRONCHUS
LINGULAR
           BRONCHUS

   RB5
                      LB4
                            LB5


                            LB6


RLL           LLL
BRONCHUS      BRONCHUS
RLL BRONCHUS   LLL BRONCHUS


RB6

                                LB6
           RB7
RML
                                              LML
                     MAJOR
                     FISSURE


  RB8
                                            LB8


                                      LB9
              RB10             LB10
        RB9
RLL
                        LLL
LB2
             RB2

RB6


                               LB6
RB9
                               LB10


      RB10
                   RB7
RB1               LB1,2


             UL
RB2               UL


 ML
        LL              LL


                  LB9
RB1 joining RUL bronchus       LB1,2 joining LUL bronchus


RC2

                                                              LC2


                                 CARINA


                    RB8                      LB8
RB1                  LB3
RB3
                                 LB4


             ML Bronchus
       RB8
RB3           LB3


                    LB5


  RB4   RB5
   Internal diameter of
    bronchus and diameter of
    accompanying artery
   LEAST diameter is
    considered ,If obliquely
    cut section seen,
   Normal ratio is 0.65-0.70
   B/A ratio increases with
    age .may exceed 1 in
    normal patients > 40
    years.
   Wall thickness decreases
    as the airway divides.
   Wall thickness is
    proportionate to diameter
   T/D ratio approximates to
    20% at any generation of
    airway.
   Assessment of bronchial
    wall thickness is quite
    subjective and is
    dependent on the window
    settings
•In an isolated lung, the
smallest bronchi visible
(arrows) measures 2 to 3 mm
in diameter.
• Bronchi and bronchioles are
not visible within the
peripheral 1 cm of lung.
• Artery branches that
accompany these bronchi are
sharply seen.
The diameters of vessels and bronchi are approximately equal.
The outer walls of bronchi and vessels are smooth and sharp.
Bronchi are invisible within the peripheral 2 cm of lung
. B: On an HRCT scan at the same level, interlobular septa can be seen marginating one or
more lobules. Pulmonary artery branches (arrows) can be seen extending into the centres
of pulmonary lobules, but intralobular bronchioles are not visible. The last visible
branching point of pulmonary arteries is approximately 1 cm from the pleural surface.
Bronchi are invisible within 2 or 3 cm of the pleural surface
•Thin white line (large arrows).
•Combined thickness of visceral ,
parietal pleurae, pleural space,
endothoracic fascia, and innermost
intercostal muscle
•Separated from the more external
layers of the intercostal muscles by
layer of intercostal fat.
•Posteriorly, the intercostal stripe
(small arrows) is visible anterior to
the lower edge of a rib.
•In the paravertebral regions
innermost intercostal muscle is
absent,
•At most, a very thin line (the
paravertebral line) is present at
the lung-chest wall interface.
•Represents the combined
thickness of the normal pleural
layers and endothoracic fascia
(0.2 to0.4 mm)
•As in this case, a distinct line
may not be seen
Hrct i
Hrct i
Hrct i

More Related Content

What's hot

Post processing of computed tomography
Post processing of computed tomographyPost processing of computed tomography
Post processing of computed tomographyBeuniquewithNehaSing
 
Presentation1.pptx, radiological anatomy of the brain.
Presentation1.pptx, radiological anatomy of the brain.Presentation1.pptx, radiological anatomy of the brain.
Presentation1.pptx, radiological anatomy of the brain.Abdellah Nazeer
 
CT Physics
CT PhysicsCT Physics
CT PhysicsRMLIMS
 
CT Procedure OF Abdomen & Pelvis
CT Procedure OF Abdomen & Pelvis CT Procedure OF Abdomen & Pelvis
CT Procedure OF Abdomen & Pelvis Upakar Paudel
 
Presentation1.pptx, radiological anatomy of the abdomen and pelvis.
Presentation1.pptx, radiological anatomy of the abdomen and pelvis.Presentation1.pptx, radiological anatomy of the abdomen and pelvis.
Presentation1.pptx, radiological anatomy of the abdomen and pelvis.Abdellah Nazeer
 
HRCT TECHNIQUE AND INTERPRETATION
HRCT TECHNIQUE AND INTERPRETATIONHRCT TECHNIQUE AND INTERPRETATION
HRCT TECHNIQUE AND INTERPRETATIONSahil Chaudhry
 
HRCT Chest - By Dr. Tinku Joseph
HRCT Chest - By Dr. Tinku JosephHRCT Chest - By Dr. Tinku Joseph
HRCT Chest - By Dr. Tinku JosephDr.Tinku Joseph
 
Presentation1.pptx, radiological anatomy of the shoulder joint.
Presentation1.pptx, radiological anatomy of the shoulder joint.Presentation1.pptx, radiological anatomy of the shoulder joint.
Presentation1.pptx, radiological anatomy of the shoulder joint.Abdellah Nazeer
 
Triple phase ct PowerPoint slide PPT pk
Triple phase ct PowerPoint slide PPT pkTriple phase ct PowerPoint slide PPT pk
Triple phase ct PowerPoint slide PPT pkDr pradeep Kumar
 
Radiology day 3 mediastinal anatomy
Radiology day 3   mediastinal anatomyRadiology day 3   mediastinal anatomy
Radiology day 3 mediastinal anatomyVibhay Pareek
 
Doppler Ultrasonography And Advancements in USG
Doppler Ultrasonography And Advancements in USGDoppler Ultrasonography And Advancements in USG
Doppler Ultrasonography And Advancements in USGSudil Paudyal
 
MDCT Principles and Applications- Avinesh Shrestha
MDCT Principles and Applications- Avinesh ShresthaMDCT Principles and Applications- Avinesh Shrestha
MDCT Principles and Applications- Avinesh ShresthaAvinesh Shrestha
 
Body ct protocols
Body ct protocolsBody ct protocols
Body ct protocolsbongsung
 

What's hot (20)

Post processing of computed tomography
Post processing of computed tomographyPost processing of computed tomography
Post processing of computed tomography
 
CT artifact
CT artifact CT artifact
CT artifact
 
Presentation1.pptx, radiological anatomy of the brain.
Presentation1.pptx, radiological anatomy of the brain.Presentation1.pptx, radiological anatomy of the brain.
Presentation1.pptx, radiological anatomy of the brain.
 
CT CHEST ANATOMY
CT CHEST ANATOMYCT CHEST ANATOMY
CT CHEST ANATOMY
 
CT Physics
CT PhysicsCT Physics
CT Physics
 
Ct head protocols
Ct head protocolsCt head protocols
Ct head protocols
 
Mdct in cad
Mdct in cadMdct in cad
Mdct in cad
 
CT Procedure OF Abdomen & Pelvis
CT Procedure OF Abdomen & Pelvis CT Procedure OF Abdomen & Pelvis
CT Procedure OF Abdomen & Pelvis
 
MRI protocol of Knee
MRI protocol of KneeMRI protocol of Knee
MRI protocol of Knee
 
Presentation1.pptx, radiological anatomy of the abdomen and pelvis.
Presentation1.pptx, radiological anatomy of the abdomen and pelvis.Presentation1.pptx, radiological anatomy of the abdomen and pelvis.
Presentation1.pptx, radiological anatomy of the abdomen and pelvis.
 
HRCT TECHNIQUE AND INTERPRETATION
HRCT TECHNIQUE AND INTERPRETATIONHRCT TECHNIQUE AND INTERPRETATION
HRCT TECHNIQUE AND INTERPRETATION
 
HRCT Chest - By Dr. Tinku Joseph
HRCT Chest - By Dr. Tinku JosephHRCT Chest - By Dr. Tinku Joseph
HRCT Chest - By Dr. Tinku Joseph
 
CT Angiography Head and Neck
CT Angiography Head and NeckCT Angiography Head and Neck
CT Angiography Head and Neck
 
Presentation1.pptx, radiological anatomy of the shoulder joint.
Presentation1.pptx, radiological anatomy of the shoulder joint.Presentation1.pptx, radiological anatomy of the shoulder joint.
Presentation1.pptx, radiological anatomy of the shoulder joint.
 
Triple phase ct PowerPoint slide PPT pk
Triple phase ct PowerPoint slide PPT pkTriple phase ct PowerPoint slide PPT pk
Triple phase ct PowerPoint slide PPT pk
 
Radiology day 3 mediastinal anatomy
Radiology day 3   mediastinal anatomyRadiology day 3   mediastinal anatomy
Radiology day 3 mediastinal anatomy
 
Doppler Ultrasonography And Advancements in USG
Doppler Ultrasonography And Advancements in USGDoppler Ultrasonography And Advancements in USG
Doppler Ultrasonography And Advancements in USG
 
Dual Energy CT
Dual Energy CTDual Energy CT
Dual Energy CT
 
MDCT Principles and Applications- Avinesh Shrestha
MDCT Principles and Applications- Avinesh ShresthaMDCT Principles and Applications- Avinesh Shrestha
MDCT Principles and Applications- Avinesh Shrestha
 
Body ct protocols
Body ct protocolsBody ct protocols
Body ct protocols
 

Viewers also liked

Pulmonary Imaging
Pulmonary ImagingPulmonary Imaging
Pulmonary ImagingKhalid
 
Solitary pulmonary nodule (SPN)
Solitary pulmonary nodule (SPN)Solitary pulmonary nodule (SPN)
Solitary pulmonary nodule (SPN)Bhavin Jankharia
 
HRCT in Diffuse Lung Diseases - I (Techniques and Quality)
HRCT in Diffuse Lung Diseases - I (Techniques and Quality)HRCT in Diffuse Lung Diseases - I (Techniques and Quality)
HRCT in Diffuse Lung Diseases - I (Techniques and Quality)Bhavin Jankharia
 
Radiology: Chest Imaging
Radiology: Chest ImagingRadiology: Chest Imaging
Radiology: Chest ImagingSCGH ED CME
 
Fundamentals of chest radiology
Fundamentals of chest radiologyFundamentals of chest radiology
Fundamentals of chest radiologyDr. Sreedhar Rao
 
Presentation1.pptx. interpretation of x ray chest.
Presentation1.pptx. interpretation of x ray chest.Presentation1.pptx. interpretation of x ray chest.
Presentation1.pptx. interpretation of x ray chest.Abdellah Nazeer
 
HRCT in Diffuse Lung Diseases - II (Honeycombing, UIP pattern, IPF)
HRCT in Diffuse Lung Diseases - II (Honeycombing, UIP pattern, IPF)HRCT in Diffuse Lung Diseases - II (Honeycombing, UIP pattern, IPF)
HRCT in Diffuse Lung Diseases - II (Honeycombing, UIP pattern, IPF)Bhavin Jankharia
 
Radiological Presentation of Pulmonary Pathology
Radiological Presentation of Pulmonary PathologyRadiological Presentation of Pulmonary Pathology
Radiological Presentation of Pulmonary PathologyGamal Agmy
 
Data Visualization Meets Visual Storytelling
Data Visualization Meets Visual StorytellingData Visualization Meets Visual Storytelling
Data Visualization Meets Visual StorytellingJESS3
 

Viewers also liked (17)

Hrct iv
Hrct ivHrct iv
Hrct iv
 
Hrct iii
Hrct iiiHrct iii
Hrct iii
 
Chest X-rays Basic Interpretation
Chest X-rays Basic InterpretationChest X-rays Basic Interpretation
Chest X-rays Basic Interpretation
 
HRCT IV
HRCT IVHRCT IV
HRCT IV
 
DR Harshil Radiology HRCT
DR Harshil Radiology HRCTDR Harshil Radiology HRCT
DR Harshil Radiology HRCT
 
Pulmonary Imaging
Pulmonary ImagingPulmonary Imaging
Pulmonary Imaging
 
Solitary pulmonary nodule (SPN)
Solitary pulmonary nodule (SPN)Solitary pulmonary nodule (SPN)
Solitary pulmonary nodule (SPN)
 
Hrct ii
Hrct iiHrct ii
Hrct ii
 
HRCT in Diffuse Lung Diseases - I (Techniques and Quality)
HRCT in Diffuse Lung Diseases - I (Techniques and Quality)HRCT in Diffuse Lung Diseases - I (Techniques and Quality)
HRCT in Diffuse Lung Diseases - I (Techniques and Quality)
 
Radiology: Chest Imaging
Radiology: Chest ImagingRadiology: Chest Imaging
Radiology: Chest Imaging
 
Chest X Rays
Chest X RaysChest X Rays
Chest X Rays
 
Fundamentals of chest radiology
Fundamentals of chest radiologyFundamentals of chest radiology
Fundamentals of chest radiology
 
Presentation1.pptx. interpretation of x ray chest.
Presentation1.pptx. interpretation of x ray chest.Presentation1.pptx. interpretation of x ray chest.
Presentation1.pptx. interpretation of x ray chest.
 
Reading chest X-ray
Reading chest X-rayReading chest X-ray
Reading chest X-ray
 
HRCT in Diffuse Lung Diseases - II (Honeycombing, UIP pattern, IPF)
HRCT in Diffuse Lung Diseases - II (Honeycombing, UIP pattern, IPF)HRCT in Diffuse Lung Diseases - II (Honeycombing, UIP pattern, IPF)
HRCT in Diffuse Lung Diseases - II (Honeycombing, UIP pattern, IPF)
 
Radiological Presentation of Pulmonary Pathology
Radiological Presentation of Pulmonary PathologyRadiological Presentation of Pulmonary Pathology
Radiological Presentation of Pulmonary Pathology
 
Data Visualization Meets Visual Storytelling
Data Visualization Meets Visual StorytellingData Visualization Meets Visual Storytelling
Data Visualization Meets Visual Storytelling
 

Similar to Hrct i

Technical aspect of hrct; normal lung anatomy & hrct findings of lung disease
Technical aspect of hrct; normal lung anatomy & hrct findings of lung diseaseTechnical aspect of hrct; normal lung anatomy & hrct findings of lung disease
Technical aspect of hrct; normal lung anatomy & hrct findings of lung diseaseSarbesh Tiwari
 
Computed Tomography
Computed TomographyComputed Tomography
Computed TomographySujan Poudel
 
Image Quality And Artifacts in Computed Tomography.pptx
Image Quality And Artifacts in Computed Tomography.pptxImage Quality And Artifacts in Computed Tomography.pptx
Image Quality And Artifacts in Computed Tomography.pptxivanKeshari
 
Coronary CT- angiogram: physics
Coronary CT- angiogram:  physics Coronary CT- angiogram:  physics
Coronary CT- angiogram: physics REMIX MAHARJAN
 
CT image quality and image resolution.pptx
CT image quality and image resolution.pptxCT image quality and image resolution.pptx
CT image quality and image resolution.pptxRohit Bansal
 
Advances in neuroimaging techniques
Advances in neuroimaging techniquesAdvances in neuroimaging techniques
Advances in neuroimaging techniquesSreenivasa Raju
 
PERFORMANCE EVALUATION OF COMPUTED TOMOGRAPHY (CT) SCANNERS
PERFORMANCE EVALUATION OF COMPUTED TOMOGRAPHY (CT) SCANNERSPERFORMANCE EVALUATION OF COMPUTED TOMOGRAPHY (CT) SCANNERS
PERFORMANCE EVALUATION OF COMPUTED TOMOGRAPHY (CT) SCANNERSBhuvi palaniswamy
 
-Lecture 2.ppt
-Lecture 2.ppt-Lecture 2.ppt
-Lecture 2.pptMagde Gad
 
Normal & abnormal radiology of brain part ii
Normal & abnormal radiology of brain part iiNormal & abnormal radiology of brain part ii
Normal & abnormal radiology of brain part iiMohammed Fathy
 
Comparison of ct and cbct
Comparison of ct and cbct Comparison of ct and cbct
Comparison of ct and cbct Amritha James
 
lecture continue.pdf
lecture continue.pdflecture continue.pdf
lecture continue.pdf8qq9rzc2j4
 
Basics of CT & MRI
Basics of CT & MRIBasics of CT & MRI
Basics of CT & MRIVibhuti Kaul
 

Similar to Hrct i (20)

Technical aspect of hrct; normal lung anatomy & hrct findings of lung disease
Technical aspect of hrct; normal lung anatomy & hrct findings of lung diseaseTechnical aspect of hrct; normal lung anatomy & hrct findings of lung disease
Technical aspect of hrct; normal lung anatomy & hrct findings of lung disease
 
CT dose reduction
CT dose reductionCT dose reduction
CT dose reduction
 
Basics in ct
Basics in ctBasics in ct
Basics in ct
 
Computed Tomography
Computed TomographyComputed Tomography
Computed Tomography
 
computed Tomography
computed Tomographycomputed Tomography
computed Tomography
 
Image Quality And Artifacts in Computed Tomography.pptx
Image Quality And Artifacts in Computed Tomography.pptxImage Quality And Artifacts in Computed Tomography.pptx
Image Quality And Artifacts in Computed Tomography.pptx
 
CT RADIATION DOSE REDUCTION
CT RADIATION DOSE REDUCTION CT RADIATION DOSE REDUCTION
CT RADIATION DOSE REDUCTION
 
Coronary CT- angiogram: physics
Coronary CT- angiogram:  physics Coronary CT- angiogram:  physics
Coronary CT- angiogram: physics
 
CT image quality and image resolution.pptx
CT image quality and image resolution.pptxCT image quality and image resolution.pptx
CT image quality and image resolution.pptx
 
Advances in neuroimaging techniques
Advances in neuroimaging techniquesAdvances in neuroimaging techniques
Advances in neuroimaging techniques
 
PERFORMANCE EVALUATION OF COMPUTED TOMOGRAPHY (CT) SCANNERS
PERFORMANCE EVALUATION OF COMPUTED TOMOGRAPHY (CT) SCANNERSPERFORMANCE EVALUATION OF COMPUTED TOMOGRAPHY (CT) SCANNERS
PERFORMANCE EVALUATION OF COMPUTED TOMOGRAPHY (CT) SCANNERS
 
Echo physics and instrumentation
Echo physics and instrumentationEcho physics and instrumentation
Echo physics and instrumentation
 
-Lecture 2.ppt
-Lecture 2.ppt-Lecture 2.ppt
-Lecture 2.ppt
 
Pocket Guide to Chest X-Rays - sample chapter
Pocket Guide to Chest X-Rays - sample chapterPocket Guide to Chest X-Rays - sample chapter
Pocket Guide to Chest X-Rays - sample chapter
 
Helical Tomotherapy
Helical TomotherapyHelical Tomotherapy
Helical Tomotherapy
 
Normal & abnormal radiology of brain part ii
Normal & abnormal radiology of brain part iiNormal & abnormal radiology of brain part ii
Normal & abnormal radiology of brain part ii
 
Comparison of ct and cbct
Comparison of ct and cbct Comparison of ct and cbct
Comparison of ct and cbct
 
lecture continue.pdf
lecture continue.pdflecture continue.pdf
lecture continue.pdf
 
Basics of CT & MRI
Basics of CT & MRIBasics of CT & MRI
Basics of CT & MRI
 
CT History
CT HistoryCT History
CT History
 

Hrct i

  • 1. PRESENTED BY : DR SHAMIM GUIDED BY : DR A PATIL (MD) GMC BHOPAL
  • 6. High Resolution Computed Tomography  Resolution :  A formal statement of a decision or expression of opinion put before or adopted by an assembly such as the U.S. Congress.????
  • 7. High Resolution Computed Tomography  Resolution :  Ability to resolve small object that are close together , as separate form.
  • 8. A scan performed using thin collimation and high- spatial frequency algorithm to accentuate the contrast between tissue of widely differing densities, e.g.., - air & vessels (lung) - air & bone (temporal & paranasal sinus)
  • 9. The basic premise is simple, maximize spatial resolution by using the thinnest collimation and a high spatial frequency algorithm
  • 10. Narrow x-ray beam collimation: 0.5-1 mm vs. Conventional 3-10mm  Cross sections are further apart: 10 mm intervals (random sampling)  High- spatial frequency algorithm  No i.v. Contrast needed  Inherent contrast  Mediastinum is not best studied
  • 11.
  • 12. maximize spatial resolution by using the thinnest collimation and a high spatial frequency algorithm
  • 13. Thin sections 0.5 – 1.5 mm is essential for optimal spatial resolution  Thicker slices are prone for volume averaging and reduces ability to resolve smaller structure
  • 14.
  • 15. With thick collimation, for example, vessels that lie in the plane of scan look like vessels (i.e., they appear cylindrical or branching) and can be clearly identified as such.  With thin collimation, vessels can appear nodular, because only short segments may lie in the plane of scan;
  • 16. maximize spatial resolution by using the thinnest collimation and a high spatial frequency algorithm
  • 17. Denotes the frequency at which the acquired scan data are recorded when creating the image.  Using a high-resolution algorithm is critical element in performing HRCT.
  • 18. With conventional body CT, scan data are usually reconstructed with “standard” or “soft-tissue” algorithms, that smoothes the image, reduces visible image noise,.  High spatial frequency or sharp algorithm (bone algorithm) is used which reduces image smoothing and better depicts normal and abnormal parenchymal interface
  • 19.
  • 20.
  • 21.
  • 22.
  • 23. Matrix size : Largest available matrix be used 512 x 512  Field of view : Smallest FOV that will encompass the patient is used as it will reduce the pixel size. (commonly 35 to 40)  Retrospectively targeting image reconstruction to a single lung instead of the entire thorax significantly reduces the FOV and image pixel size, and thus increases spatial resolution.
  • 24.
  • 25.
  • 26.
  • 27.
  • 28. Sharp reconstruction algorithm,  increase image detail,  increase the visibility of noise in the CT image .
  • 29. Noise = 1/√ mAs X Kvp X scan time it is inversely proportional to the square root of the product of the mA and scan time).
  • 30. Sharp reconstruction algorithm,  increase image detail,  increase the visibility of noise in the CT image .  Much of this noise is quantum-related and thus decreases with  increased number of photons ,  increasing the mA or kV(p) used during scanning, or  increasing scan time,
  • 31. Noise = 1/√ mAs X Kvp X scan time it is inversely proportional to the square root of the product of the mA and scan time).
  • 32. In HRCT image, noise is more apparent than standard CT.  Noise = 1/√ mAs X Kvp X scan time  Scan Time is kept low as possible to minimize motion artifact, increasing scan time is not feasible,  mAs and Kvp are INCREASED to reduce noise
  • 33. For routine technique – Kvp -- 120-140 mAs -- 200- 300  Scan Time : As low as possible (1-2 sec) to minimize motion artifact.
  • 34.
  • 35. For routine technique – Kvp -- 120-140 mAs -- 200- 300  Scan Time : As low as possible (1-2 sec) to minimize motion artifact.  Increased patient and chest wall thickness are associated with increase image noise, may be reduced by increasing mAs and Kvp
  • 36.
  • 37.
  • 38. Effect of kV(p) and mA on image noise. HRCT scans obtained with kV(p)/mA settings of 120/100 (A) and 140/170 (B). Noise is most evident posteriorly and in the paravertebral regions. Although noise is greater in A, the difference is probably not significant clinically. Nonetheless, increasing the kV(p)/mA is optimal. Also note pulsation (“star”) artifacts in the left lung on both images and a “double” left major fissure.
  • 39. Collimation: thinnest available collimation (1.0-1.5 mm).  Reconstruction algorithm: high-spatial frequency or “sharp” algorithm (i.e., GE “bone”).  Scan time: as short as possible (1 sec or less).  kV(p), 120-140; mA, 240.  Matrix size: largest available (512 × 512). Optional  kV(p)/mA: Increased kV(p)/mA (i.e., 140/340). Recommended in large patients. Otherwise optional.  Targeted reconstruction: (15- to 25-cm field of view).  Reduced mA (low-dose HRCT): 40-80 mA.
  • 40. At least one consistent lung window setting is necessary. Window mean/width values of -600 HU to - 700 HU/1,000 HU to 1,500 HU are appropriate. Good combinations are -700/1,000 HU or -600/1,500 HU. Soft-tissue windows of approximately 50/350 HU should also be used for the mediastinum, hila, and pleura.  Windows: Windows may need to be customized; a low- window mean (-800 to -900 HU) is optimal for diagnosing emphysema. For viewing the mediastinum, 50/350 HU is recommended. For viewing pleuro- parenchymal disease, -600/2,000 HU is recommended.
  • 41.
  • 42.
  • 43.
  • 44.
  • 45. Slice thickness: 3-10 mm  Scans a large volume, very quickly  Volumetric scan - Covers the full lung  +/- contrast
  • 46. Standard before helical CT  Differs from helical CT technique in that slices are not contiguous  Move the patient, stop, and scan  All other parameters same  Adv: lower radiation dose
  • 47. Transverse images of thin slices of lung (1-1.3 mm thick) are obtained at non-contiguous intervals, usually 1 to 2 cm apart, throughout the whole lung.  The computer reconstructs the images to give high spatial resolution.  This process results in images that show detail, but only 5 to 10% of the lung is sampled.  This sampling is appropriate for evaluating diffuse lung disease, focal lesions may require more images.
  • 48. Obtained at 1cm intervals from lung apices to bases. In this manner, HRCT is intended to “sample” lung anatomy  It is assumed that the findings seen at the levels scanned will be representative of what is present throughout the lungs  Results in low radiation dose as the individual scans are widely placed 48
  • 49. 1. Viewing of contagious slice for better delineation of lung abnormality 2. Complete imaging of lung and thorax 3. Reconstruction of scan data in any plane using MIPs or MinIPs. 4. Diagnosis of other lung abnormalities Disadvantage : greater radiation dose. It delivers 3-5 times greater radiation. 49
  • 50. Multidetector CT is equipped with a multiple row detector array  Multiple images are acquired due to presence of multiple detectors  Advantages : - shorter acquisition times and retrospective creation of both thinner and thicker sections from the same raw data  Acquisition time is so short that whole-lung HRCT can be performed in one breath-hold. 50
  • 51.
  • 52.
  • 53.
  • 54. More coverage in a breath-hold  Chest, Vascular studies, trauma  Reduced misregistration of slices  Improved MPR, 3D and MIP images  Potentially less IV contrast required  Gapless coverage  Arbitrary slice positioning
  • 55. Various study shows the image quality of axial HRCT with multi-detector CT is equal to that with conventional single-detector CT.  HRCT performed with spaced axial images results in low radiation dose as compared with MD-HRCT.  Increased table speed may increase the volume- averaging artifact and may result in indistinctness of subtle pulmonary abnormalities.  MDCT provides for better reconstruction in Z axis 55
  • 56. Low dose HRCT uses Kvp of 120- 140 and mA of 30-20 at 2 sec scan time. • Equivalent to conventional HRCT in 97 % of cases • Disadvantage : Fails to identify GGO in few cases and have more prominent streak artifact. • Not recommended for initial evaluation of patients with lung disease. • Indicated in following up patients with a known lung abnormality or in screening large populations at risk for lung ds. 56
  • 58. Low-dose Although noise is much more obvious on the low-dose image, areas of ground-glass opacity and ill-defined nodules (arrows) are visible with both techniques
  • 59. “The authors concluded that HRCT images acquired at 20 mA yield anatomic information equivalent to that obtained with 200-mA scans in the majority of patients without significant loss of spatial resolution or image degradation”
  • 60. In 16-slice and higher scanners, the current protocol is to do a volume scan in 2-5 seconds and then retrospectively reconstruct the images as 1mm at 0.5mm intervals and to review the stack on the workstation
  • 61. Annual background radiation ----- --- 2.5 mSv  PA CHEST Radiograph ----- ----- ----- 0.05 mSv  Spaced axial HRCT (10mm space) ----- 0.7 mSv ( 14 X ray)  Spaced axial HRCT (20 mm space) ------ 0.35 mSv ( 7 X ray)  Low Dose Spaced axial HRCT -------- 0.02 mSV  MD-HRCT ---- ------- 4 - 7 msv ( 60-80 x ray) Combining HRCT scan at 20 mm interval with low mAs scan (40 mAs) would result in radiation comparable to conventional X ray. 61
  • 62. Decision should be tailored for individual cases
  • 63.
  • 64. Detect interstitial lung disease not seen on chest x- ray  Abnormal pulmonary function tests  Characterize lung disease seen on X-ray  Determine disease activity  Find a biopsy site
  • 65. Hemoptysis  Diffusely abnormal CXR  Normal CXR with abnormal PFT’s  Baseline for pts with diffuse lung disease  Solitary pulmonary nodules  Reversible (active) vs. non-reversible (fibrotic) lung disease  Lung biopsy guide  F/U known lung disease  Assess Rx response
  • 66. Training Validation  • Clinical 27% 29%  • CXR 4% 9%  • CT 49% 36%  • Clinical & CXR 53% 77%  • Clinical, CXR & CT 61% 90% Conclusion: HRCT both superior and additive to clinical and CXR data
  • 67.
  • 68.
  • 69. FULL INSPIRATION  BREATH HOLD  EXPIRATORY SCAN WHENEVER INDICATED  SUPINE AND PRONE IF INDICATED
  • 70.
  • 71.
  • 72.
  • 73.
  • 74.
  • 75.
  • 76. Useful to determine if there is small  airway disease  • Normal lung increases in density at endexpiration  • Abnormal lung due to air trapping fails  to increase in density on expiration
  • 77.
  • 78.
  • 79.
  • 80.
  • 81.
  • 82.
  • 83.
  • 84.
  • 85. Practically, these are the most important parameters to work with when performing HRCT scans
  • 86. If providing films is still important, then the filming should be done such that the pleural margins and ribs are seen with an optimum grey-sca
  • 87.
  • 88.
  • 89. maximum intensity projection (MIP) is a volume rendering method for 3D data that projects in the visualization plane thevoxels with maximum intensity that fall in the way of parallel rays traced from the viewpoint to the plane of projection
  • 90. (a) Volume-rendered image provides clear definition of individual vessels. (b) MIP image reconstructed from the same volume data shows all of the vessels, but their outlines merge; it is impossible to visualize the spatial relationships between the vessels or to delineate individual vessels on the MIP image.
  • 91.
  • 92.
  • 93. Maximum-intensity projection (MIP) image in a patient with small lung nodules obtained using a multidetector-row spiral CT scanner with 1.25-mm detector width and a pitch of 6. A: A single HRCT image shows two small nodules (arrows) that are difficult to distinguish from vessels. B: An MIP image consisting of eight contiguous HRCT images, including A, allows the two small nodules to be easily distinguished from surrounding vessels.
  • 94. first step in HRCT interpretation of diffuse lung diseases is a good quality scan
  • 95. . Resolution and size or orientation of structures. The tissue plane, 1 mm thick, and the perpendicular cylinder, 0.2 mm in diameter, are visible on the HRCT scan because they extend through the thickness of the scan volume or voxel. The horizontal cylinder cannot be seen.
  • 96. Combined “routine” and HRCT studies  5 mm sections q 5 mm (separate lung and mediastinal reconstruction algorithms):  1 – 1.25 mm sections q 10 mm (lung algorithm)  Optional image acquisitions  Supine and prone 1 – 1.25 mm sections  Inspiratory/expiratory 1 -1.25 mm sections  Low dose technique (mAs 40 – 80)  Optional Reconstruction techniques  Sliding maximum and minimum intensity projection images (MIPs/ MINIPs): 5 mm’s q 5 mm
  • 97.
  • 98. Right lung is divided by major and minor fissure into 3 lobes and 10 bronchopulmonary segments  Left lung is divided by major fissure into 2 lobes with a lingular lobe and 8 bronchopulmonary segments
  • 99. The trachea (windpipe) divides into left and the right mainstem bronchi, at the level of the sternal angle (carina).  The right main bronchus is wider, shorter, and more vertical than the left main bronchus.  The right main bronchus subdivides into three lobar bronchi, while the left main bronchus divides into two.  The lobar bronchi divide into tertiary bronchi, also known as segmental bronchi, each of which supplies a bronchopulmonary segment.
  • 100. The segmental bronchi divide into many primary bronchioles which divide into terminal bronchioles, each of which then gives rise to several respiratory bronchioles, which go on to divide into two to 11 alveolar ducts. There are five or six alveolar sacs associated with each alveolar duct. The alveolus is the basic anatomical unit of gas exchange in the lung.
  • 101. Airways divide by dichotomous branching, with approximately 23 generations of branches from the trachea to the alveoli.  The wall thickness of conducting bronchi and bronchioles is approximately proportional to their diameter.  Bronchi with a wall thickness of less than 300 um is not visible on CT or HRCT.  As a consequence, normal bronchi less than 2 mm in diameter or closer than 2 cm from pleural surfaces equivalent to seventh to ninth order airways are generally below the resolution even of high-resolution CT
  • 102. There are approximately 23 generation of dichotomous branching From trachea to the alveolar sac HRCT can identify upto 8th order central bronchioles
  • 103.
  • 104.
  • 105. Lung is supported by a network of connective tissue called interstitium  Interstitium not visible on normal HRCT but visible once thickened.  Interstitium is constituted by  AXIAL fibre system (peribronchovascular & centrilobular),  PERIPHERAL fibre system (subpleural & interlobular septa) and  SEPTAL fibre system (intralobular septa)
  • 106. Lung interstitium Axial fiber Peripheral fiber system sysem Peribronchovascular Centrilobular Subpleural Interlobular interstitium interstitium interstitium septa
  • 107.
  • 108. The peribronchovascular interstitum invests the bronchi and pulmonary artery in the perihilar region.  The centrilobular interstitium are associated with small centrilobular bronchioles and arteries  The subpleural interstitium is located beneath the visceral pleura; envelops the lung into fibrous sac and sends connective tissue septa into lung parenchyma.  Interlobular septa constitute the septas arising from the subpleural interstitium. 108
  • 109.
  • 110. It is the smallest lung unit that is surrounded by connective tissue septa.  It measures about 1-2 cm and is made up of 5-15 pulmonary acini, that contain the alveoli for gas exchange.  The secondary lobule is supplied by a small bronchiole (terminal bronchiole) in the center, that is parallelled by the centrilobular artery.  Pulmonary veins and lymphatics run in the periphery of the lobule within the interlobular septa.
  • 111. Secondary lobulus  Most important structure  Smallest functional unit seen on CT Scans  Interstitium  Inter‐/intralobar septum  Central artery  Central bronchiolus
  • 112.
  • 113.
  • 114.
  • 115.
  • 116.
  • 117.
  • 118.
  • 119. Interlobular septa and contiguous subpleural interstitium,  Centrilobular structures, and  Lobular parenchyma and acini.
  • 120.
  • 121. A group of terminal bronchioles
  • 127. Primary Lobule: Lung parenchyma associated with a single Alveolar duct.  4-5 Primary Lobules  Acinus
  • 128.
  • 129.
  • 130. The normal pulmonary vein branches are seen marginating pulmonary lobules. The centrilobular artery branches are visible as a rounded dot
  • 131.
  • 132.
  • 133. TRACHEA RIGHT LEFT APICAL APICAL SEGMENT SEGMENT
  • 134.
  • 136.
  • 137.
  • 138. LEFT MAIN RIGHT MAIN BRONCHUS BRONCHUS LB3 RB3 CARINA LB1,2 RB2 RB1
  • 139.
  • 140.
  • 141.
  • 142. RB5 BRONCHUS INTERMEDIUS LEFT UL BRONCHUS RML LUL RIGHT ML RLL LLL BRONCHUS
  • 143.
  • 144.
  • 145.
  • 146. LINGULAR BRONCHUS RB5 LB4 LB5 LB6 RLL LLL BRONCHUS BRONCHUS
  • 147.
  • 148. RLL BRONCHUS LLL BRONCHUS RB6 LB6 RB7
  • 149.
  • 150.
  • 151.
  • 152.
  • 153.
  • 154.
  • 155. RML LML MAJOR FISSURE RB8 LB8 LB9 RB10 LB10 RB9 RLL LLL
  • 156.
  • 157. LB2 RB2 RB6 LB6 RB9 LB10 RB10 RB7
  • 158.
  • 159. RB1 LB1,2 UL RB2 UL ML LL LL LB9
  • 160.
  • 161. RB1 joining RUL bronchus LB1,2 joining LUL bronchus RC2 LC2 CARINA RB8 LB8
  • 162.
  • 163. RB1 LB3 RB3 LB4 ML Bronchus RB8
  • 164.
  • 165. RB3 LB3 LB5 RB4 RB5
  • 166.
  • 167. Internal diameter of bronchus and diameter of accompanying artery  LEAST diameter is considered ,If obliquely cut section seen,  Normal ratio is 0.65-0.70  B/A ratio increases with age .may exceed 1 in normal patients > 40 years.
  • 168. Wall thickness decreases as the airway divides.  Wall thickness is proportionate to diameter  T/D ratio approximates to 20% at any generation of airway.  Assessment of bronchial wall thickness is quite subjective and is dependent on the window settings
  • 169. •In an isolated lung, the smallest bronchi visible (arrows) measures 2 to 3 mm in diameter. • Bronchi and bronchioles are not visible within the peripheral 1 cm of lung. • Artery branches that accompany these bronchi are sharply seen.
  • 170. The diameters of vessels and bronchi are approximately equal. The outer walls of bronchi and vessels are smooth and sharp. Bronchi are invisible within the peripheral 2 cm of lung
  • 171. . B: On an HRCT scan at the same level, interlobular septa can be seen marginating one or more lobules. Pulmonary artery branches (arrows) can be seen extending into the centres of pulmonary lobules, but intralobular bronchioles are not visible. The last visible branching point of pulmonary arteries is approximately 1 cm from the pleural surface. Bronchi are invisible within 2 or 3 cm of the pleural surface
  • 172.
  • 173. •Thin white line (large arrows). •Combined thickness of visceral , parietal pleurae, pleural space, endothoracic fascia, and innermost intercostal muscle •Separated from the more external layers of the intercostal muscles by layer of intercostal fat. •Posteriorly, the intercostal stripe (small arrows) is visible anterior to the lower edge of a rib.
  • 174. •In the paravertebral regions innermost intercostal muscle is absent, •At most, a very thin line (the paravertebral line) is present at the lung-chest wall interface. •Represents the combined thickness of the normal pleural layers and endothoracic fascia (0.2 to0.4 mm) •As in this case, a distinct line may not be seen

Editor's Notes

  1. The abnormalities of subpleural interstitium is recognized over the costal surface and along fissuresNormal fissure is less than 1 mm thick, smooth and very thin opacities