SlideShare a Scribd company logo
1 of 28
SITAPT
STUDY OF INTERNET TRAFFIC TO ANALYZE
AND PREDICT TRAFFIC
Amit Arora
aa1603@georgetown.edu
https://www.linkedin.com/in/amit-arora-539120a
WHAT DOES INTERNET TRAFFIC LOOK
LIKE?
Word cloud of mean percentage packets contributed by various
applications from 2008 to 2015
BACKGROUND
 Pervasive growth of the Internet.
 Internet access becomes faster
and applications move to the
cloud the profile of Internet
traffic continues to change.
 Peer to Peer traffic, video
sharing and OTT services
coupled with almost ubiquitous
access to high speed internet
poses new challenges
 Service providers: how to
better utilize bandwidth ?
 OEMs: how to increase bits
per second and packets per
second through the
equipment ?
 A key to understanding and solving
these challenges is to
 understand what constitutes Internet
traffic
 how the internet traffic will look like
in the coming years
 optimize networks and infrastructure
to better utilize available resources.
 This is what this project aims to
address i.e. understanding internet
traffic from various perspectives
(application, protocol, packet size
and others)
 This understanding can then feed
into network and infrastructure
design.
A data product named SITAPT (Study of Internet Traffic to Analyze and
Predict Traffic) is built which addresses the above requirements.
TARGET AUDIENCE
Network OEM Service Provider
SCOPE OF SITAPT
Visualization of Traffic
Data
• Hundreds of
applications (web,
secure web, file
transfer etc)
• Tens of protocols (TCP,
UDP, ESP, GRE etc).
• Various packet sizes
Time Series Analysis for
Traffic Prediction
• Multivariate timeseries
analysis to predict
traffic for various
applications and
protocols in the next 12
months.
• Identify trends in key
and upcoming
applications/protocols
Clustering to Explore
Similarity
• Use machine learning
algorithms to identify
possible clusters of
similarity between
traffic patterns across
multiple years.
Relationship betwen
traffic types
• Identify and model
relationship between
key protcols
DATA SCIENCE PIPELINE
SITAPT itself is implemented completely in Python (version 2.7.11), although it relies heavily on other
python packages such as numpy etc. that might be written in other programming languages for speed.
The entire code for SITAPT is available on Github SITAPT repo.
Obtain anonymized internet traces from CAIDA.
The traces are available in pcap format and
contain IP and Transport layer headers only.
Read the packet trace and convert
information from each packet into a JSON
which is then stored in MongoDB.
Remove all data that is not IP.
Find out the traffic mix by
protocols, application, packet
sizes and other criteria. Convert
the results in a pandas
dataframe which is again stored
into Mongo.
· Model traffic as a multivariate time series. Use time
series analysis techniques to forecast traffic for various
applications and protocols.
· Use unsupervised machine learning (clustering) to
identify similarity in traffic across the dataset.
· Identify and model relationship between key protocols
Create visualizations for
understanding the data.
Representing time series and
describing trends.
Explore clustering and regression
ARCHITECTURE
Application
Layer
Application
Layer
AnonymizedInternettraces
Internet trace from CAIDA
Internet trace from a
Service Provider
Ingestion module
(BeautifulSoup4, wget,
gzip, pycapfile)
Ingestion
WORM
ETL
Offline (non-realtime),
Authenticated ingestion
NOSQL
- MongoDB
Immutable Data store
ETL = Extract only IP packets, Transform
to JSON, Load in data store
Computation & Modeling
Models
- AR(I)MA
- PCA, KMeans
- Linear Regression.
Packages
- Statsmodels
- SciKit Learn
Train model on available data sets
Wallofinterpretation
Data from models
made available in
various formats
A WORD ABOUT DATA USED IN SITAPT
CAIDA (Center for Applied Internet Data Analysis, http://www.caida.org/) maintains a lot of data
that can be used as analyzing and understanding Internet traffic.
Anonymized internet traces from the year 2008 to 2015 are available upon request from CAIDA
(see http://www.caida.org/data/passive/passive_2015_dataset.xml ), these traces form the
dataset used by SITAPT.
All traces in this dataset are anonymized (by CAIDA itself) with the same key. In addition, the
payload has been removed from all packets (again by CAIDA itself).
A WORD ABOUT DATA USED IN SITAPT
(CONTD..)
How much data does SITAPT use?
CAIDA provides around 13,000 files (in compressed format) for the period from 2008 to 2015.
The combined size of the uncompressed version of the files stored into a database would run
into several tens of terabytes.
The current version of SITAPT is not a *big data* product.
Clearly, analyzing this amount of data requires horizontal scaling which is outside the scope of
the current project.
To reduce the problem to a more manageable level, SITAPT works with one file for every month
of every year from 2008 to 2015 (for 2014 and 2015 CAIDA provides one file per quarter).
In total, SITAPT analyses 73 packet trace files from 2008 to 2015. Each trace contains millions
of packets.
The size of the database that stores the JSON representation of the trace files is more than
1TB.
DATA TRANSFORMATION FOR
COMPUTATION
 Ingested data is stored in Mongo collections (one for each year).
 This data needs to be transformed into matrix form to make it amenable for
computation.
 Once created, the three collections (applications, protocols and packet size
distribution) are also stored as CSV files such that the modeling phase do
not have to interact with the database at all and can read data on which
they need to work on directly from the CSV file.
DATA TRANSFORMATION FOR
COMPUTATION (CONTD..)
These files represent time series data such that each row is a parameterized
representation of traffic expressed either as combination of applications or
protocols or packet size distribution.
Date sun-sr-
iiop
transmit-
port
ieee-
mms-
ssl
passgo joaJewelSuite ovhpas sdo-tls interwise lm-
instmgr
3/19/200
8
4.36E-06 3.49E-05 0 8.72E-
06
0 0.00079
8
0.00095
9
0.00105
1
0.00060
6
4/30/200
8
9.00E-06 9.00E-06 9.00E
-06
9.00E-
06
9.00E-06 9.00E-06 9.00E-06 9.00E-06 9.00E-06
5/15/200
8
0 0 0 0 0 3.96E-05 0.00118
7
0.00441
3
0
6/19/200
8
0 0 0 0 0 0.00036
8
0.00040
3
0.00026
6
0
7/17/200
8
0.00074
4
6.20E-05 0 0 0 0.00329
9
0.00282
8
1.24E-05 2.48E-05
Time
Applications
Read row wise: composition of Internet traffic by packets percentage
contributed by each application in a trace captured at a particular day.
Read column wise: packets percentage of each application as a time
series.
VISUALIZATIONS
Three different types of visualizations are explored
 Word cloud (for applications and protocols)
 Stacked chart (for applications, protocols and packet size
distribution)
 Heat map (for packet size distribution)
 Parallel Coordinates (protocols)
VISUALIZATIONS: STACKED CHARTS
Observations:
 Almost exponential increase in HTTPS traffic
 Decrease in unclassified (unknown) traffic
 Logarithmic decay in applications that contribute less than 0.5% of packets individually.
VISUALIZATIONS: HEAT MAP
Observations:
Packet size distribution is almost entirely bimodal, with only the 1 to 100 bytes range
and the 1400 to 1500 bytes range showing packet percentages of any significance.
Only two rows show any dark colors (which represents a significant packet percentage)
and these are the 1 to 100 packet size row and the 1400 to 1500 packet size row..
VISUALIZATIONS: PARALLEL
COORDINATES
The protocols parallel coordinates for protocols contributing more than 0.01% to overall traffic.
This chart clearly shows a negative correlation between TCP and UDP protocol traffic.
 Each time series is studied and analyzed individually. The
following operations are done on each time series.
 Plot the first difference series to identify trends.
 Evaluate ACF and PCF to identify dependencies of the series
upon previous time samples.
 Seasonal decomposition to identify trend and seasonality and
residuals.
 ARMA and ARIMA modeling of the time series
 Modeling is done using “statsmodels” package
 The output of each of the above steps is available as part of
SITAPT analysis.
TIME SERIES ANALYSIS
TIME SERIES MODELING FOR TCP
PROTOCOL
TIME SERIES MODELING FOR TCP
PROTOCOL (CONTD..)
TIME SERIES MODELING FOR TCP
PROTOCOL (CONTD..)
TIME SERIES MODELING FOR MULTIPLE
PROTOCOLS AND APPLICATIONS
Forecasted traffic mix
TRENDS IN SOME IMPORTANT
APPLICATIONS
Almost exponential increase in HTTPS traffic
HTTP traffic is decreasing but still contributes a significant percentage
CLUSTERING
 To explore if there are any patterns hidden in the internet traffic data
a clustering technique is employed.
 Each protocol or application or packet size interval is treated as a
feature and each trace is treated as an instance.
 Clustering is done in two steps:
 Dimensionality reduction via PCA (Principal Component Analysis)
 For applications, PCA reduces 5000+ dimensions to 10.
 Clustering via KMeans
 K = 4
 PCA and KMeans are both done using the scikit-learn API.
CLUSTERING (CONTD..)
Some clustering present in applications and
protocols data, not so much in packet size
distribution data (needs higher K maybe).
CLUSTERING
Date Year Half Quarter Fort
night
DayOf
TheWeek
cluster TCP ESP UDP
5/17/2012 2012 1 2 2 Thursday 2 91.01197292 0.190882127 8.219679951
7/19/2012 2012 2 3 2 Thursday 2 91.75760765 0.084797929 7.588290657
9/20/2012 2012 2 3 2 Thursday 2 93.10399212 0.024899575 6.125210312
10/18/2012 2012 2 4 2 Thursday 2 90.43387514 0.492682745 8.564568542
11/15/2012 2012 2 4 1 Thursday 2 95.2341703 0.262422627 3.843731031
12/20/2012 2012 2 4 2 Thursday 2 91.12739062 0.035976644 8.60410183
3/21/2013 2013 1 1 2 Thursday 2 94.65616355 0.019147528 5.206672769
6/20/2013 2013 1 2 2 Thursday 2 90.5349465 0.061648601 9.195006053
9/18/2014 2014 2 3 2 Thursday 2 90.60646827 0.020378309 8.885648934
 It is a matter of further analysis to figure out what event or phenomenon was happening which caused the
Internet traffic at during different times between 2008 to 2015 to be similar.
 If this study was being done on traffic from a closed network (such as from a single ISP) then it would be
much easier to attribute this clustering to real world events (such as the OS update for mobile phones for
example).
 The following is an excerpt from the generated CSV file for protocols showing the additional fields added,
including the label field provided by the clustering algorithm.
 The table is filtered on cluster (label) type 2 and it is seen that traces which has higher than usual TCP
traffic % (90 to 95%) are clustered together.
LINEAR REGRESSION
Parallel coordinates showed negative correlation between the
percentage of TCP traffic and the percentage of UDP traffic.
Creating a scatter plot of TCP Vs UDP and then creating a linear
regression model to fit a straight line through it.
The coefficients vector is [ -1.00805723] and the variance score
is 0.96.
WHAT WORKED?
 The fact that all the packet traces are now available in a
document database means that the data is now available in
a consumable format and this really opens up avenues for
further analysis, asking different types of questions off the
data.
 The time series analysis revealed interesting trends about the
data, such as an almost exponential increase in secure HTTP
traffic which was expected but at the same time there is not
a huge decrease in non-secure HTTP traffic which was
somewhat unexpected.
 Various types of visualization techniques (like parallel
coordinates) and tools like Bokeh provide a really good
insight into the data.
WHAT DID NOT WORK?
 With the amount of data involved, this is clearly a Big Data project,
since that was not something that could be done completed in a
short time so the alternative was use to trace file for each month and
that reduced the number of data points available for analysis (only 73
data points). This limited the prediction ability of the time series
models, not all applications and protocols could be modeled within
the 95% confidence interval and a MAPE of < 5%.
 This data would provide much more insights if it corresponded to
traffic from a closed network rather than the Internet. For example,
such as an ISP’s network limited to certain geographical areas because
then the data would have less variability and would be easier to
explain the clustering.
 For the time series model, only the MAPE was considered while
choosing between the AR(I)MA models. There are other criteria as well
such as Durbin-Watson statistic, the BIC and HQIC etc. which should
have been explored but were not.
CONCLUSION
SITAPT provides valuable insights into network traffic
composition and trends.
 In terms of applications there is an exponential growth trend
in HTTPS traffic, a trend that is visible even at a macro level
(generic internet packet trace).
 The time series analysis is able to provide predictions for
applications and protocols.
 In terms of packet sizes there is a bi-modal distribution.
 Clustering reveals patterns in terms of both application and
protocols

More Related Content

Viewers also liked

Japanese ICT startups Look to Luxembourg as Gateway to European Business.
Japanese ICT startups Look to Luxembourg as Gateway to European Business.Japanese ICT startups Look to Luxembourg as Gateway to European Business.
Japanese ICT startups Look to Luxembourg as Gateway to European Business.TERALINKnetwork
 
Telindus telecom-brochure
Telindus telecom-brochureTelindus telecom-brochure
Telindus telecom-brochuretraizer
 
LBMA 2012 Geofencing
LBMA 2012 GeofencingLBMA 2012 Geofencing
LBMA 2012 GeofencingMars-Philter
 
Feedback on participation to CIP-ICT-PSP - ASSETS4Europeana
Feedback on participation to CIP-ICT-PSP - ASSETS4Europeana Feedback on participation to CIP-ICT-PSP - ASSETS4Europeana
Feedback on participation to CIP-ICT-PSP - ASSETS4Europeana Ghislain Sillaume
 
130130 luxinnovation -europeana cip ict psp workshop
130130 luxinnovation -europeana cip ict psp workshop130130 luxinnovation -europeana cip ict psp workshop
130130 luxinnovation -europeana cip ict psp workshopPatrick Peiffer
 
Developing mobile applications for the City of Luxembourg
Developing mobile applications for the City of LuxembourgDeveloping mobile applications for the City of Luxembourg
Developing mobile applications for the City of LuxembourgEuropeana
 
2015 Mobile Strategies - SEO, Search, Display, HyperLocal Display, GeoFencing...
2015 Mobile Strategies - SEO, Search, Display, HyperLocal Display, GeoFencing...2015 Mobile Strategies - SEO, Search, Display, HyperLocal Display, GeoFencing...
2015 Mobile Strategies - SEO, Search, Display, HyperLocal Display, GeoFencing...Pierre M. Fiorini, Ph.D.
 
Creating Successful Geofencing Campaigns – Case Studies
Creating Successful Geofencing Campaigns – Case Studies Creating Successful Geofencing Campaigns – Case Studies
Creating Successful Geofencing Campaigns – Case Studies Squeeze Mobi
 
Next Generation Collaboration - ICT Spring 2013 Luxembourg
Next Generation Collaboration - ICT Spring 2013 LuxembourgNext Generation Collaboration - ICT Spring 2013 Luxembourg
Next Generation Collaboration - ICT Spring 2013 LuxembourgLaura Yecies
 
Mobile Marketing and Geo Fencing
Mobile Marketing and Geo FencingMobile Marketing and Geo Fencing
Mobile Marketing and Geo Fencingaffordableweb
 
Geofencing & Fleet Management
Geofencing & Fleet ManagementGeofencing & Fleet Management
Geofencing & Fleet ManagementFleet Commander
 
Geofencing and Location Marketing Success Stories
Geofencing and Location Marketing Success StoriesGeofencing and Location Marketing Success Stories
Geofencing and Location Marketing Success StoriesLocaid Technologies
 
VFDM for single user
VFDM for single userVFDM for single user
VFDM for single userGaspard Ggas
 
Geo-Location/Geo-Fencing
Geo-Location/Geo-FencingGeo-Location/Geo-Fencing
Geo-Location/Geo-FencingSqueeze Mobi
 
Mobile Advertising 101: Beyond Geofencing
Mobile Advertising 101: Beyond GeofencingMobile Advertising 101: Beyond Geofencing
Mobile Advertising 101: Beyond GeofencingGil Rogers
 
Building the Future Landscape of Geofencing SXSW workshop Teaser
Building the Future Landscape of Geofencing SXSW workshop TeaserBuilding the Future Landscape of Geofencing SXSW workshop Teaser
Building the Future Landscape of Geofencing SXSW workshop TeaserJenessa Carder
 
Reinventing Marketing in the Age of Digital, ICT Spring 2015, Luxembourg
Reinventing Marketing in the Age of Digital, ICT Spring 2015, LuxembourgReinventing Marketing in the Age of Digital, ICT Spring 2015, Luxembourg
Reinventing Marketing in the Age of Digital, ICT Spring 2015, LuxembourgJohn Watton
 
Internet of Things & Big Data : Quels défis et opportunités pour les métiers ...
Internet of Things & Big Data : Quels défis et opportunités pour les métiers ...Internet of Things & Big Data : Quels défis et opportunités pour les métiers ...
Internet of Things & Big Data : Quels défis et opportunités pour les métiers ...POST Telecom for Business
 

Viewers also liked (20)

Japanese ICT startups Look to Luxembourg as Gateway to European Business.
Japanese ICT startups Look to Luxembourg as Gateway to European Business.Japanese ICT startups Look to Luxembourg as Gateway to European Business.
Japanese ICT startups Look to Luxembourg as Gateway to European Business.
 
Telindus telecom-brochure
Telindus telecom-brochureTelindus telecom-brochure
Telindus telecom-brochure
 
LBMA 2012 Geofencing
LBMA 2012 GeofencingLBMA 2012 Geofencing
LBMA 2012 Geofencing
 
Feedback on participation to CIP-ICT-PSP - ASSETS4Europeana
Feedback on participation to CIP-ICT-PSP - ASSETS4Europeana Feedback on participation to CIP-ICT-PSP - ASSETS4Europeana
Feedback on participation to CIP-ICT-PSP - ASSETS4Europeana
 
130130 luxinnovation -europeana cip ict psp workshop
130130 luxinnovation -europeana cip ict psp workshop130130 luxinnovation -europeana cip ict psp workshop
130130 luxinnovation -europeana cip ict psp workshop
 
Developing mobile applications for the City of Luxembourg
Developing mobile applications for the City of LuxembourgDeveloping mobile applications for the City of Luxembourg
Developing mobile applications for the City of Luxembourg
 
2015 Mobile Strategies - SEO, Search, Display, HyperLocal Display, GeoFencing...
2015 Mobile Strategies - SEO, Search, Display, HyperLocal Display, GeoFencing...2015 Mobile Strategies - SEO, Search, Display, HyperLocal Display, GeoFencing...
2015 Mobile Strategies - SEO, Search, Display, HyperLocal Display, GeoFencing...
 
Creating Successful Geofencing Campaigns – Case Studies
Creating Successful Geofencing Campaigns – Case Studies Creating Successful Geofencing Campaigns – Case Studies
Creating Successful Geofencing Campaigns – Case Studies
 
Next Generation Collaboration - ICT Spring 2013 Luxembourg
Next Generation Collaboration - ICT Spring 2013 LuxembourgNext Generation Collaboration - ICT Spring 2013 Luxembourg
Next Generation Collaboration - ICT Spring 2013 Luxembourg
 
Mobile Marketing and Geo Fencing
Mobile Marketing and Geo FencingMobile Marketing and Geo Fencing
Mobile Marketing and Geo Fencing
 
Geofencing & Fleet Management
Geofencing & Fleet ManagementGeofencing & Fleet Management
Geofencing & Fleet Management
 
Geofencing and Location Marketing Success Stories
Geofencing and Location Marketing Success StoriesGeofencing and Location Marketing Success Stories
Geofencing and Location Marketing Success Stories
 
VFDM for single user
VFDM for single userVFDM for single user
VFDM for single user
 
GPS & Geo-Fencing
GPS & Geo-FencingGPS & Geo-Fencing
GPS & Geo-Fencing
 
Geo-Location/Geo-Fencing
Geo-Location/Geo-FencingGeo-Location/Geo-Fencing
Geo-Location/Geo-Fencing
 
Mobile Advertising 101: Beyond Geofencing
Mobile Advertising 101: Beyond GeofencingMobile Advertising 101: Beyond Geofencing
Mobile Advertising 101: Beyond Geofencing
 
Building the Future Landscape of Geofencing SXSW workshop Teaser
Building the Future Landscape of Geofencing SXSW workshop TeaserBuilding the Future Landscape of Geofencing SXSW workshop Teaser
Building the Future Landscape of Geofencing SXSW workshop Teaser
 
Reinventing Marketing in the Age of Digital, ICT Spring 2015, Luxembourg
Reinventing Marketing in the Age of Digital, ICT Spring 2015, LuxembourgReinventing Marketing in the Age of Digital, ICT Spring 2015, Luxembourg
Reinventing Marketing in the Age of Digital, ICT Spring 2015, Luxembourg
 
Call Center
Call CenterCall Center
Call Center
 
Internet of Things & Big Data : Quels défis et opportunités pour les métiers ...
Internet of Things & Big Data : Quels défis et opportunités pour les métiers ...Internet of Things & Big Data : Quels défis et opportunités pour les métiers ...
Internet of Things & Big Data : Quels défis et opportunités pour les métiers ...
 

Similar to Study of Internet Traffic to Analyze and Predict Traffic

CarStream: An Industrial System of Big Data Processing for Internet of Vehicles
CarStream: An Industrial System of Big Data Processing for Internet of VehiclesCarStream: An Industrial System of Big Data Processing for Internet of Vehicles
CarStream: An Industrial System of Big Data Processing for Internet of Vehiclesijtsrd
 
ArtigofinalpublicadoASTESJ_060139.pdf
ArtigofinalpublicadoASTESJ_060139.pdfArtigofinalpublicadoASTESJ_060139.pdf
ArtigofinalpublicadoASTESJ_060139.pdfMeftahMehdawi
 
NETWORK TRAFFIC ANALYSIS: HADOOP PIG VS TYPICAL MAPREDUCE
NETWORK TRAFFIC ANALYSIS: HADOOP PIG VS TYPICAL MAPREDUCENETWORK TRAFFIC ANALYSIS: HADOOP PIG VS TYPICAL MAPREDUCE
NETWORK TRAFFIC ANALYSIS: HADOOP PIG VS TYPICAL MAPREDUCEcscpconf
 
Cataloging Of Sessions in Genuine Traffic by Packet Size Distribution and Ses...
Cataloging Of Sessions in Genuine Traffic by Packet Size Distribution and Ses...Cataloging Of Sessions in Genuine Traffic by Packet Size Distribution and Ses...
Cataloging Of Sessions in Genuine Traffic by Packet Size Distribution and Ses...IOSR Journals
 
IOT Based Smart City: Weather, Traffic and Pollution Monitoring System
IOT Based Smart City: Weather, Traffic and Pollution Monitoring System      IOT Based Smart City: Weather, Traffic and Pollution Monitoring System
IOT Based Smart City: Weather, Traffic and Pollution Monitoring System IRJET Journal
 
Automated Traffic Classification And Application Identification Using Machine...
Automated Traffic Classification And Application Identification Using Machine...Automated Traffic Classification And Application Identification Using Machine...
Automated Traffic Classification And Application Identification Using Machine...Jennifer Daniel
 
Tracing of voip traffic in the rapid flow internet backbone
Tracing of voip traffic in the rapid flow internet backboneTracing of voip traffic in the rapid flow internet backbone
Tracing of voip traffic in the rapid flow internet backboneeSAT Journals
 
Itcm a real time internet traffic classifier monitor
Itcm a real time internet traffic classifier monitorItcm a real time internet traffic classifier monitor
Itcm a real time internet traffic classifier monitorijcsit
 
A First Step Towards Stream Reasoning at FIS 2008
A First Step Towards Stream Reasoning at FIS 2008A First Step Towards Stream Reasoning at FIS 2008
A First Step Towards Stream Reasoning at FIS 2008Emanuele Della Valle
 
Traffic Profiles and Management for Support of Community Networks
Traffic Profiles and Management for Support of Community NetworksTraffic Profiles and Management for Support of Community Networks
Traffic Profiles and Management for Support of Community NetworksSmartenIT
 
Agata overview
Agata overviewAgata overview
Agata overviewUdi Levin
 
Big Data to SMART Data : Process Scenario
Big Data to SMART Data : Process ScenarioBig Data to SMART Data : Process Scenario
Big Data to SMART Data : Process ScenarioCHAKER ALLAOUI
 
IRJET- Cost Effective Scheme for Delay Tolerant Data Transmission
IRJET- Cost Effective Scheme for Delay Tolerant Data TransmissionIRJET- Cost Effective Scheme for Delay Tolerant Data Transmission
IRJET- Cost Effective Scheme for Delay Tolerant Data TransmissionIRJET Journal
 
Instrumenting and Scaling Databases with Envoy
Instrumenting and Scaling Databases with EnvoyInstrumenting and Scaling Databases with Envoy
Instrumenting and Scaling Databases with EnvoyDaniel Hochman
 
Event Driven Architecture with a RESTful Microservices Architecture (Kyle Ben...
Event Driven Architecture with a RESTful Microservices Architecture (Kyle Ben...Event Driven Architecture with a RESTful Microservices Architecture (Kyle Ben...
Event Driven Architecture with a RESTful Microservices Architecture (Kyle Ben...confluent
 
Reduce the False Positive and False Negative from Real Traffic with Intrusion...
Reduce the False Positive and False Negative from Real Traffic with Intrusion...Reduce the False Positive and False Negative from Real Traffic with Intrusion...
Reduce the False Positive and False Negative from Real Traffic with Intrusion...inventy
 

Similar to Study of Internet Traffic to Analyze and Predict Traffic (20)

CarStream: An Industrial System of Big Data Processing for Internet of Vehicles
CarStream: An Industrial System of Big Data Processing for Internet of VehiclesCarStream: An Industrial System of Big Data Processing for Internet of Vehicles
CarStream: An Industrial System of Big Data Processing for Internet of Vehicles
 
ArtigofinalpublicadoASTESJ_060139.pdf
ArtigofinalpublicadoASTESJ_060139.pdfArtigofinalpublicadoASTESJ_060139.pdf
ArtigofinalpublicadoASTESJ_060139.pdf
 
NETWORK TRAFFIC ANALYSIS: HADOOP PIG VS TYPICAL MAPREDUCE
NETWORK TRAFFIC ANALYSIS: HADOOP PIG VS TYPICAL MAPREDUCENETWORK TRAFFIC ANALYSIS: HADOOP PIG VS TYPICAL MAPREDUCE
NETWORK TRAFFIC ANALYSIS: HADOOP PIG VS TYPICAL MAPREDUCE
 
Cataloging Of Sessions in Genuine Traffic by Packet Size Distribution and Ses...
Cataloging Of Sessions in Genuine Traffic by Packet Size Distribution and Ses...Cataloging Of Sessions in Genuine Traffic by Packet Size Distribution and Ses...
Cataloging Of Sessions in Genuine Traffic by Packet Size Distribution and Ses...
 
IOT Based Smart City: Weather, Traffic and Pollution Monitoring System
IOT Based Smart City: Weather, Traffic and Pollution Monitoring System      IOT Based Smart City: Weather, Traffic and Pollution Monitoring System
IOT Based Smart City: Weather, Traffic and Pollution Monitoring System
 
Automated Traffic Classification And Application Identification Using Machine...
Automated Traffic Classification And Application Identification Using Machine...Automated Traffic Classification And Application Identification Using Machine...
Automated Traffic Classification And Application Identification Using Machine...
 
Tracing of voip traffic in the rapid flow internet backbone
Tracing of voip traffic in the rapid flow internet backboneTracing of voip traffic in the rapid flow internet backbone
Tracing of voip traffic in the rapid flow internet backbone
 
Itcm a real time internet traffic classifier monitor
Itcm a real time internet traffic classifier monitorItcm a real time internet traffic classifier monitor
Itcm a real time internet traffic classifier monitor
 
1720 1724
1720 17241720 1724
1720 1724
 
1720 1724
1720 17241720 1724
1720 1724
 
A First Step Towards Stream Reasoning at FIS 2008
A First Step Towards Stream Reasoning at FIS 2008A First Step Towards Stream Reasoning at FIS 2008
A First Step Towards Stream Reasoning at FIS 2008
 
Traffic Profiles and Management for Support of Community Networks
Traffic Profiles and Management for Support of Community NetworksTraffic Profiles and Management for Support of Community Networks
Traffic Profiles and Management for Support of Community Networks
 
Agata overview
Agata overviewAgata overview
Agata overview
 
Webinar Data Mesh - Part 3
Webinar Data Mesh - Part 3Webinar Data Mesh - Part 3
Webinar Data Mesh - Part 3
 
Big Data to SMART Data : Process Scenario
Big Data to SMART Data : Process ScenarioBig Data to SMART Data : Process Scenario
Big Data to SMART Data : Process Scenario
 
IRJET- Cost Effective Scheme for Delay Tolerant Data Transmission
IRJET- Cost Effective Scheme for Delay Tolerant Data TransmissionIRJET- Cost Effective Scheme for Delay Tolerant Data Transmission
IRJET- Cost Effective Scheme for Delay Tolerant Data Transmission
 
Instrumenting and Scaling Databases with Envoy
Instrumenting and Scaling Databases with EnvoyInstrumenting and Scaling Databases with Envoy
Instrumenting and Scaling Databases with Envoy
 
Event Driven Architecture with a RESTful Microservices Architecture (Kyle Ben...
Event Driven Architecture with a RESTful Microservices Architecture (Kyle Ben...Event Driven Architecture with a RESTful Microservices Architecture (Kyle Ben...
Event Driven Architecture with a RESTful Microservices Architecture (Kyle Ben...
 
Io t data streaming
Io t data streamingIo t data streaming
Io t data streaming
 
Reduce the False Positive and False Negative from Real Traffic with Intrusion...
Reduce the False Positive and False Negative from Real Traffic with Intrusion...Reduce the False Positive and False Negative from Real Traffic with Intrusion...
Reduce the False Positive and False Negative from Real Traffic with Intrusion...
 

Recently uploaded

Bluetooth Controlled Car with Arduino.pdf
Bluetooth Controlled Car with Arduino.pdfBluetooth Controlled Car with Arduino.pdf
Bluetooth Controlled Car with Arduino.pdfngoud9212
 
"Federated learning: out of reach no matter how close",Oleksandr Lapshyn
"Federated learning: out of reach no matter how close",Oleksandr Lapshyn"Federated learning: out of reach no matter how close",Oleksandr Lapshyn
"Federated learning: out of reach no matter how close",Oleksandr LapshynFwdays
 
Designing IA for AI - Information Architecture Conference 2024
Designing IA for AI - Information Architecture Conference 2024Designing IA for AI - Information Architecture Conference 2024
Designing IA for AI - Information Architecture Conference 2024Enterprise Knowledge
 
Bun (KitWorks Team Study 노별마루 발표 2024.4.22)
Bun (KitWorks Team Study 노별마루 발표 2024.4.22)Bun (KitWorks Team Study 노별마루 발표 2024.4.22)
Bun (KitWorks Team Study 노별마루 발표 2024.4.22)Wonjun Hwang
 
Kotlin Multiplatform & Compose Multiplatform - Starter kit for pragmatics
Kotlin Multiplatform & Compose Multiplatform - Starter kit for pragmaticsKotlin Multiplatform & Compose Multiplatform - Starter kit for pragmatics
Kotlin Multiplatform & Compose Multiplatform - Starter kit for pragmaticscarlostorres15106
 
Enhancing Worker Digital Experience: A Hands-on Workshop for Partners
Enhancing Worker Digital Experience: A Hands-on Workshop for PartnersEnhancing Worker Digital Experience: A Hands-on Workshop for Partners
Enhancing Worker Digital Experience: A Hands-on Workshop for PartnersThousandEyes
 
Integration and Automation in Practice: CI/CD in Mule Integration and Automat...
Integration and Automation in Practice: CI/CD in Mule Integration and Automat...Integration and Automation in Practice: CI/CD in Mule Integration and Automat...
Integration and Automation in Practice: CI/CD in Mule Integration and Automat...Patryk Bandurski
 
Key Features Of Token Development (1).pptx
Key  Features Of Token  Development (1).pptxKey  Features Of Token  Development (1).pptx
Key Features Of Token Development (1).pptxLBM Solutions
 
AI as an Interface for Commercial Buildings
AI as an Interface for Commercial BuildingsAI as an Interface for Commercial Buildings
AI as an Interface for Commercial BuildingsMemoori
 
Swan(sea) Song – personal research during my six years at Swansea ... and bey...
Swan(sea) Song – personal research during my six years at Swansea ... and bey...Swan(sea) Song – personal research during my six years at Swansea ... and bey...
Swan(sea) Song – personal research during my six years at Swansea ... and bey...Alan Dix
 
Tech-Forward - Achieving Business Readiness For Copilot in Microsoft 365
Tech-Forward - Achieving Business Readiness For Copilot in Microsoft 365Tech-Forward - Achieving Business Readiness For Copilot in Microsoft 365
Tech-Forward - Achieving Business Readiness For Copilot in Microsoft 3652toLead Limited
 
Connect Wave/ connectwave Pitch Deck Presentation
Connect Wave/ connectwave Pitch Deck PresentationConnect Wave/ connectwave Pitch Deck Presentation
Connect Wave/ connectwave Pitch Deck PresentationSlibray Presentation
 
Install Stable Diffusion in windows machine
Install Stable Diffusion in windows machineInstall Stable Diffusion in windows machine
Install Stable Diffusion in windows machinePadma Pradeep
 
#StandardsGoals for 2024: What’s new for BISAC - Tech Forum 2024
#StandardsGoals for 2024: What’s new for BISAC - Tech Forum 2024#StandardsGoals for 2024: What’s new for BISAC - Tech Forum 2024
#StandardsGoals for 2024: What’s new for BISAC - Tech Forum 2024BookNet Canada
 
Unblocking The Main Thread Solving ANRs and Frozen Frames
Unblocking The Main Thread Solving ANRs and Frozen FramesUnblocking The Main Thread Solving ANRs and Frozen Frames
Unblocking The Main Thread Solving ANRs and Frozen FramesSinan KOZAK
 
"LLMs for Python Engineers: Advanced Data Analysis and Semantic Kernel",Oleks...
"LLMs for Python Engineers: Advanced Data Analysis and Semantic Kernel",Oleks..."LLMs for Python Engineers: Advanced Data Analysis and Semantic Kernel",Oleks...
"LLMs for Python Engineers: Advanced Data Analysis and Semantic Kernel",Oleks...Fwdays
 
APIForce Zurich 5 April Automation LPDG
APIForce Zurich 5 April  Automation LPDGAPIForce Zurich 5 April  Automation LPDG
APIForce Zurich 5 April Automation LPDGMarianaLemus7
 
Making_way_through_DLL_hollowing_inspite_of_CFG_by_Debjeet Banerjee.pptx
Making_way_through_DLL_hollowing_inspite_of_CFG_by_Debjeet Banerjee.pptxMaking_way_through_DLL_hollowing_inspite_of_CFG_by_Debjeet Banerjee.pptx
Making_way_through_DLL_hollowing_inspite_of_CFG_by_Debjeet Banerjee.pptxnull - The Open Security Community
 

Recently uploaded (20)

Bluetooth Controlled Car with Arduino.pdf
Bluetooth Controlled Car with Arduino.pdfBluetooth Controlled Car with Arduino.pdf
Bluetooth Controlled Car with Arduino.pdf
 
DMCC Future of Trade Web3 - Special Edition
DMCC Future of Trade Web3 - Special EditionDMCC Future of Trade Web3 - Special Edition
DMCC Future of Trade Web3 - Special Edition
 
"Federated learning: out of reach no matter how close",Oleksandr Lapshyn
"Federated learning: out of reach no matter how close",Oleksandr Lapshyn"Federated learning: out of reach no matter how close",Oleksandr Lapshyn
"Federated learning: out of reach no matter how close",Oleksandr Lapshyn
 
Designing IA for AI - Information Architecture Conference 2024
Designing IA for AI - Information Architecture Conference 2024Designing IA for AI - Information Architecture Conference 2024
Designing IA for AI - Information Architecture Conference 2024
 
Bun (KitWorks Team Study 노별마루 발표 2024.4.22)
Bun (KitWorks Team Study 노별마루 발표 2024.4.22)Bun (KitWorks Team Study 노별마루 발표 2024.4.22)
Bun (KitWorks Team Study 노별마루 발표 2024.4.22)
 
Kotlin Multiplatform & Compose Multiplatform - Starter kit for pragmatics
Kotlin Multiplatform & Compose Multiplatform - Starter kit for pragmaticsKotlin Multiplatform & Compose Multiplatform - Starter kit for pragmatics
Kotlin Multiplatform & Compose Multiplatform - Starter kit for pragmatics
 
Enhancing Worker Digital Experience: A Hands-on Workshop for Partners
Enhancing Worker Digital Experience: A Hands-on Workshop for PartnersEnhancing Worker Digital Experience: A Hands-on Workshop for Partners
Enhancing Worker Digital Experience: A Hands-on Workshop for Partners
 
Integration and Automation in Practice: CI/CD in Mule Integration and Automat...
Integration and Automation in Practice: CI/CD in Mule Integration and Automat...Integration and Automation in Practice: CI/CD in Mule Integration and Automat...
Integration and Automation in Practice: CI/CD in Mule Integration and Automat...
 
Key Features Of Token Development (1).pptx
Key  Features Of Token  Development (1).pptxKey  Features Of Token  Development (1).pptx
Key Features Of Token Development (1).pptx
 
AI as an Interface for Commercial Buildings
AI as an Interface for Commercial BuildingsAI as an Interface for Commercial Buildings
AI as an Interface for Commercial Buildings
 
Swan(sea) Song – personal research during my six years at Swansea ... and bey...
Swan(sea) Song – personal research during my six years at Swansea ... and bey...Swan(sea) Song – personal research during my six years at Swansea ... and bey...
Swan(sea) Song – personal research during my six years at Swansea ... and bey...
 
The transition to renewables in India.pdf
The transition to renewables in India.pdfThe transition to renewables in India.pdf
The transition to renewables in India.pdf
 
Tech-Forward - Achieving Business Readiness For Copilot in Microsoft 365
Tech-Forward - Achieving Business Readiness For Copilot in Microsoft 365Tech-Forward - Achieving Business Readiness For Copilot in Microsoft 365
Tech-Forward - Achieving Business Readiness For Copilot in Microsoft 365
 
Connect Wave/ connectwave Pitch Deck Presentation
Connect Wave/ connectwave Pitch Deck PresentationConnect Wave/ connectwave Pitch Deck Presentation
Connect Wave/ connectwave Pitch Deck Presentation
 
Install Stable Diffusion in windows machine
Install Stable Diffusion in windows machineInstall Stable Diffusion in windows machine
Install Stable Diffusion in windows machine
 
#StandardsGoals for 2024: What’s new for BISAC - Tech Forum 2024
#StandardsGoals for 2024: What’s new for BISAC - Tech Forum 2024#StandardsGoals for 2024: What’s new for BISAC - Tech Forum 2024
#StandardsGoals for 2024: What’s new for BISAC - Tech Forum 2024
 
Unblocking The Main Thread Solving ANRs and Frozen Frames
Unblocking The Main Thread Solving ANRs and Frozen FramesUnblocking The Main Thread Solving ANRs and Frozen Frames
Unblocking The Main Thread Solving ANRs and Frozen Frames
 
"LLMs for Python Engineers: Advanced Data Analysis and Semantic Kernel",Oleks...
"LLMs for Python Engineers: Advanced Data Analysis and Semantic Kernel",Oleks..."LLMs for Python Engineers: Advanced Data Analysis and Semantic Kernel",Oleks...
"LLMs for Python Engineers: Advanced Data Analysis and Semantic Kernel",Oleks...
 
APIForce Zurich 5 April Automation LPDG
APIForce Zurich 5 April  Automation LPDGAPIForce Zurich 5 April  Automation LPDG
APIForce Zurich 5 April Automation LPDG
 
Making_way_through_DLL_hollowing_inspite_of_CFG_by_Debjeet Banerjee.pptx
Making_way_through_DLL_hollowing_inspite_of_CFG_by_Debjeet Banerjee.pptxMaking_way_through_DLL_hollowing_inspite_of_CFG_by_Debjeet Banerjee.pptx
Making_way_through_DLL_hollowing_inspite_of_CFG_by_Debjeet Banerjee.pptx
 

Study of Internet Traffic to Analyze and Predict Traffic

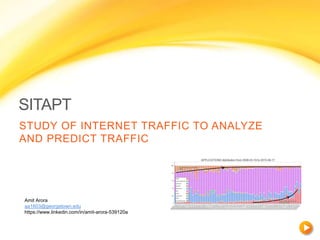
  • 1. SITAPT STUDY OF INTERNET TRAFFIC TO ANALYZE AND PREDICT TRAFFIC Amit Arora aa1603@georgetown.edu https://www.linkedin.com/in/amit-arora-539120a
  • 2. WHAT DOES INTERNET TRAFFIC LOOK LIKE? Word cloud of mean percentage packets contributed by various applications from 2008 to 2015
  • 3. BACKGROUND  Pervasive growth of the Internet.  Internet access becomes faster and applications move to the cloud the profile of Internet traffic continues to change.  Peer to Peer traffic, video sharing and OTT services coupled with almost ubiquitous access to high speed internet poses new challenges  Service providers: how to better utilize bandwidth ?  OEMs: how to increase bits per second and packets per second through the equipment ?  A key to understanding and solving these challenges is to  understand what constitutes Internet traffic  how the internet traffic will look like in the coming years  optimize networks and infrastructure to better utilize available resources.  This is what this project aims to address i.e. understanding internet traffic from various perspectives (application, protocol, packet size and others)  This understanding can then feed into network and infrastructure design. A data product named SITAPT (Study of Internet Traffic to Analyze and Predict Traffic) is built which addresses the above requirements.
  • 4. TARGET AUDIENCE Network OEM Service Provider
  • 5. SCOPE OF SITAPT Visualization of Traffic Data • Hundreds of applications (web, secure web, file transfer etc) • Tens of protocols (TCP, UDP, ESP, GRE etc). • Various packet sizes Time Series Analysis for Traffic Prediction • Multivariate timeseries analysis to predict traffic for various applications and protocols in the next 12 months. • Identify trends in key and upcoming applications/protocols Clustering to Explore Similarity • Use machine learning algorithms to identify possible clusters of similarity between traffic patterns across multiple years. Relationship betwen traffic types • Identify and model relationship between key protcols
  • 6. DATA SCIENCE PIPELINE SITAPT itself is implemented completely in Python (version 2.7.11), although it relies heavily on other python packages such as numpy etc. that might be written in other programming languages for speed. The entire code for SITAPT is available on Github SITAPT repo. Obtain anonymized internet traces from CAIDA. The traces are available in pcap format and contain IP and Transport layer headers only. Read the packet trace and convert information from each packet into a JSON which is then stored in MongoDB. Remove all data that is not IP. Find out the traffic mix by protocols, application, packet sizes and other criteria. Convert the results in a pandas dataframe which is again stored into Mongo. · Model traffic as a multivariate time series. Use time series analysis techniques to forecast traffic for various applications and protocols. · Use unsupervised machine learning (clustering) to identify similarity in traffic across the dataset. · Identify and model relationship between key protocols Create visualizations for understanding the data. Representing time series and describing trends. Explore clustering and regression
  • 7. ARCHITECTURE Application Layer Application Layer AnonymizedInternettraces Internet trace from CAIDA Internet trace from a Service Provider Ingestion module (BeautifulSoup4, wget, gzip, pycapfile) Ingestion WORM ETL Offline (non-realtime), Authenticated ingestion NOSQL - MongoDB Immutable Data store ETL = Extract only IP packets, Transform to JSON, Load in data store Computation & Modeling Models - AR(I)MA - PCA, KMeans - Linear Regression. Packages - Statsmodels - SciKit Learn Train model on available data sets Wallofinterpretation Data from models made available in various formats
  • 8. A WORD ABOUT DATA USED IN SITAPT CAIDA (Center for Applied Internet Data Analysis, http://www.caida.org/) maintains a lot of data that can be used as analyzing and understanding Internet traffic. Anonymized internet traces from the year 2008 to 2015 are available upon request from CAIDA (see http://www.caida.org/data/passive/passive_2015_dataset.xml ), these traces form the dataset used by SITAPT. All traces in this dataset are anonymized (by CAIDA itself) with the same key. In addition, the payload has been removed from all packets (again by CAIDA itself).
  • 9. A WORD ABOUT DATA USED IN SITAPT (CONTD..) How much data does SITAPT use? CAIDA provides around 13,000 files (in compressed format) for the period from 2008 to 2015. The combined size of the uncompressed version of the files stored into a database would run into several tens of terabytes. The current version of SITAPT is not a *big data* product. Clearly, analyzing this amount of data requires horizontal scaling which is outside the scope of the current project. To reduce the problem to a more manageable level, SITAPT works with one file for every month of every year from 2008 to 2015 (for 2014 and 2015 CAIDA provides one file per quarter). In total, SITAPT analyses 73 packet trace files from 2008 to 2015. Each trace contains millions of packets. The size of the database that stores the JSON representation of the trace files is more than 1TB.
  • 10. DATA TRANSFORMATION FOR COMPUTATION  Ingested data is stored in Mongo collections (one for each year).  This data needs to be transformed into matrix form to make it amenable for computation.  Once created, the three collections (applications, protocols and packet size distribution) are also stored as CSV files such that the modeling phase do not have to interact with the database at all and can read data on which they need to work on directly from the CSV file.
  • 11. DATA TRANSFORMATION FOR COMPUTATION (CONTD..) These files represent time series data such that each row is a parameterized representation of traffic expressed either as combination of applications or protocols or packet size distribution. Date sun-sr- iiop transmit- port ieee- mms- ssl passgo joaJewelSuite ovhpas sdo-tls interwise lm- instmgr 3/19/200 8 4.36E-06 3.49E-05 0 8.72E- 06 0 0.00079 8 0.00095 9 0.00105 1 0.00060 6 4/30/200 8 9.00E-06 9.00E-06 9.00E -06 9.00E- 06 9.00E-06 9.00E-06 9.00E-06 9.00E-06 9.00E-06 5/15/200 8 0 0 0 0 0 3.96E-05 0.00118 7 0.00441 3 0 6/19/200 8 0 0 0 0 0 0.00036 8 0.00040 3 0.00026 6 0 7/17/200 8 0.00074 4 6.20E-05 0 0 0 0.00329 9 0.00282 8 1.24E-05 2.48E-05 Time Applications Read row wise: composition of Internet traffic by packets percentage contributed by each application in a trace captured at a particular day. Read column wise: packets percentage of each application as a time series.
  • 12. VISUALIZATIONS Three different types of visualizations are explored  Word cloud (for applications and protocols)  Stacked chart (for applications, protocols and packet size distribution)  Heat map (for packet size distribution)  Parallel Coordinates (protocols)
  • 13. VISUALIZATIONS: STACKED CHARTS Observations:  Almost exponential increase in HTTPS traffic  Decrease in unclassified (unknown) traffic  Logarithmic decay in applications that contribute less than 0.5% of packets individually.
  • 14. VISUALIZATIONS: HEAT MAP Observations: Packet size distribution is almost entirely bimodal, with only the 1 to 100 bytes range and the 1400 to 1500 bytes range showing packet percentages of any significance. Only two rows show any dark colors (which represents a significant packet percentage) and these are the 1 to 100 packet size row and the 1400 to 1500 packet size row..
  • 15. VISUALIZATIONS: PARALLEL COORDINATES The protocols parallel coordinates for protocols contributing more than 0.01% to overall traffic. This chart clearly shows a negative correlation between TCP and UDP protocol traffic.
  • 16.  Each time series is studied and analyzed individually. The following operations are done on each time series.  Plot the first difference series to identify trends.  Evaluate ACF and PCF to identify dependencies of the series upon previous time samples.  Seasonal decomposition to identify trend and seasonality and residuals.  ARMA and ARIMA modeling of the time series  Modeling is done using “statsmodels” package  The output of each of the above steps is available as part of SITAPT analysis. TIME SERIES ANALYSIS
  • 17. TIME SERIES MODELING FOR TCP PROTOCOL
  • 18. TIME SERIES MODELING FOR TCP PROTOCOL (CONTD..)
  • 19. TIME SERIES MODELING FOR TCP PROTOCOL (CONTD..)
  • 20. TIME SERIES MODELING FOR MULTIPLE PROTOCOLS AND APPLICATIONS Forecasted traffic mix
  • 21. TRENDS IN SOME IMPORTANT APPLICATIONS Almost exponential increase in HTTPS traffic HTTP traffic is decreasing but still contributes a significant percentage
  • 22. CLUSTERING  To explore if there are any patterns hidden in the internet traffic data a clustering technique is employed.  Each protocol or application or packet size interval is treated as a feature and each trace is treated as an instance.  Clustering is done in two steps:  Dimensionality reduction via PCA (Principal Component Analysis)  For applications, PCA reduces 5000+ dimensions to 10.  Clustering via KMeans  K = 4  PCA and KMeans are both done using the scikit-learn API.
  • 23. CLUSTERING (CONTD..) Some clustering present in applications and protocols data, not so much in packet size distribution data (needs higher K maybe).
  • 24. CLUSTERING Date Year Half Quarter Fort night DayOf TheWeek cluster TCP ESP UDP 5/17/2012 2012 1 2 2 Thursday 2 91.01197292 0.190882127 8.219679951 7/19/2012 2012 2 3 2 Thursday 2 91.75760765 0.084797929 7.588290657 9/20/2012 2012 2 3 2 Thursday 2 93.10399212 0.024899575 6.125210312 10/18/2012 2012 2 4 2 Thursday 2 90.43387514 0.492682745 8.564568542 11/15/2012 2012 2 4 1 Thursday 2 95.2341703 0.262422627 3.843731031 12/20/2012 2012 2 4 2 Thursday 2 91.12739062 0.035976644 8.60410183 3/21/2013 2013 1 1 2 Thursday 2 94.65616355 0.019147528 5.206672769 6/20/2013 2013 1 2 2 Thursday 2 90.5349465 0.061648601 9.195006053 9/18/2014 2014 2 3 2 Thursday 2 90.60646827 0.020378309 8.885648934  It is a matter of further analysis to figure out what event or phenomenon was happening which caused the Internet traffic at during different times between 2008 to 2015 to be similar.  If this study was being done on traffic from a closed network (such as from a single ISP) then it would be much easier to attribute this clustering to real world events (such as the OS update for mobile phones for example).  The following is an excerpt from the generated CSV file for protocols showing the additional fields added, including the label field provided by the clustering algorithm.  The table is filtered on cluster (label) type 2 and it is seen that traces which has higher than usual TCP traffic % (90 to 95%) are clustered together.
  • 25. LINEAR REGRESSION Parallel coordinates showed negative correlation between the percentage of TCP traffic and the percentage of UDP traffic. Creating a scatter plot of TCP Vs UDP and then creating a linear regression model to fit a straight line through it. The coefficients vector is [ -1.00805723] and the variance score is 0.96.
  • 26. WHAT WORKED?  The fact that all the packet traces are now available in a document database means that the data is now available in a consumable format and this really opens up avenues for further analysis, asking different types of questions off the data.  The time series analysis revealed interesting trends about the data, such as an almost exponential increase in secure HTTP traffic which was expected but at the same time there is not a huge decrease in non-secure HTTP traffic which was somewhat unexpected.  Various types of visualization techniques (like parallel coordinates) and tools like Bokeh provide a really good insight into the data.
  • 27. WHAT DID NOT WORK?  With the amount of data involved, this is clearly a Big Data project, since that was not something that could be done completed in a short time so the alternative was use to trace file for each month and that reduced the number of data points available for analysis (only 73 data points). This limited the prediction ability of the time series models, not all applications and protocols could be modeled within the 95% confidence interval and a MAPE of < 5%.  This data would provide much more insights if it corresponded to traffic from a closed network rather than the Internet. For example, such as an ISP’s network limited to certain geographical areas because then the data would have less variability and would be easier to explain the clustering.  For the time series model, only the MAPE was considered while choosing between the AR(I)MA models. There are other criteria as well such as Durbin-Watson statistic, the BIC and HQIC etc. which should have been explored but were not.
  • 28. CONCLUSION SITAPT provides valuable insights into network traffic composition and trends.  In terms of applications there is an exponential growth trend in HTTPS traffic, a trend that is visible even at a macro level (generic internet packet trace).  The time series analysis is able to provide predictions for applications and protocols.  In terms of packet sizes there is a bi-modal distribution.  Clustering reveals patterns in terms of both application and protocols

Editor's Notes

  1. Labels
  2. Slide for email
  3. Labels: Excel
  4. Labels Outlook
  5. Labels Outlook
  6. Labels/new list
  7. Labels/new list
  8. Excel-Email
  9. Outlook Email
  10. CSV Email
  11. CSV Email
  12. Email Type