Downloaded 183 times

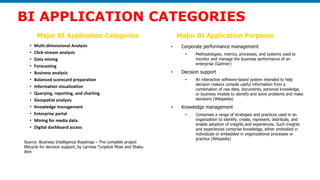
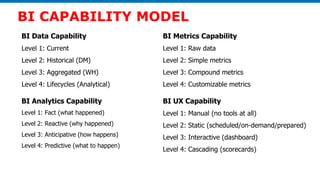
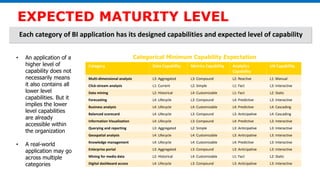

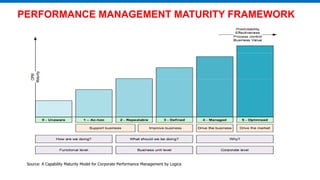
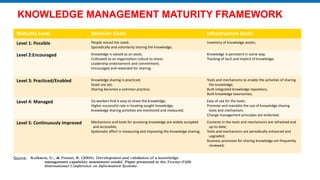
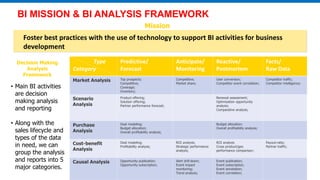
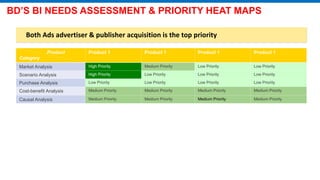
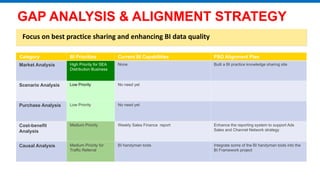


This document discusses business intelligence (BI) capability and maturity models. It begins by listing major BI application categories. It then presents frameworks for assessing maturity levels for BI metrics, user experience, data, and analytics capabilities. Expected maturity levels are outlined for each BI application category. Other sections define frameworks for assessing performance management and knowledge management maturity levels. The document proposes a decision making analysis framework and outlines the scope of BI activities.