SlideShare a Scribd company logo
1 of 9
Download to read offline
News Release
FOR IMMEDIATE RELEASE:
As inventory increases, price gains relent in Metro Vancouver to
begin the fall season
VANCOUVER, BC – October 4, 2023 – The month-over-month price gains seen earlier this
year abated in the Metro Vancouver1
housing market in September due to a seasonal decline in
sales and a modest increase in inventory levels across the region.
The Real Estate Board of Greater Vancouver (REBGV) reports that residential home sales2
in the
region totalled 1,926 in September 2023, a 13.2 per cent increase from the 1,701 sales recorded
in September 2022. This was 26.3 per cent below the 10-year seasonal average (2,614).
“A key dynamic that we’ve been watching this year has been the reluctance of some
homeowners to list their homes given that mortgage rates are the highest they’ve been in over ten
years,” Andrew Lis, REBGV’s director of economics and data analytics said. “With fewer
listings coming to the market earlier this year than usual, inventory levels remained very low,
which led prices to increase throughout the spring and summer months.”
There were 5,446 detached, attached and apartment properties newly listed for sale on the
Multiple Listing Service® (MLS®) in Metro Vancouver in September 2023. This represents a
28.4 per cent increase compared to the 4,243 homes listed in September 2022.
This was 5.2 per cent above the 10-year seasonal average (5,179).
The total number of homes currently listed for sale on the MLS® system in Metro Vancouver is
11,382, a 9.2 per cent increase compared to September 2022 (10,427). This was 6.2 per cent
below the 10-year seasonal average (12,136).
Across all detached, attached and apartment property types, the sales-to-active listings ratio for
September 2023 is 17.7 per cent. By property type, the ratio is 12.6 per cent for detached homes,
21.6 per cent for townhomes, and 21.3 per cent for apartments.
Analysis of the historical data suggests downward pressure on home prices occurs when the ratio
dips below 12 per cent for a sustained period, while home prices often experience upward
pressure when it surpasses 20 per cent over several months.
“In contrast to the spring and summer, the September data suggests there may be a renewed
interest on the part of sellers to participate in the market, with new listing activity rising back in
line with long-term historical averages. This upward shift in new listings has allowed overall
inventory levels to recover modestly from the low levels we saw earlier this year,” Lis said.
“When we pair this dynamic with the slowdown in sales that typically occurs in the fall as a
result of seasonal patterns, the outcome is more balanced market conditions overall.”
The MLS® Home Price Index composite benchmark price for all residential properties in Metro
Vancouver is currently $1,203,300. This represents a 4.4 per cent increase over September 2022
and a 0.4 per cent decrease compared to August 2023.
Sales of detached homes in September 2023 reached 572, a 7.5 per cent increase from the 532
detached sales recorded in September 2022. The benchmark price for a detached home is
$2,017,100. This represents a 5.8 per cent increase from September 2022 and a 0.1 per cent
decrease compared to August 2023.
Sales of apartment homes reached 988 in September 2023, an 11.3 per cent increase compared to
the 888 sales in September 2022. The benchmark price of an apartment home is $768,500. This
represents a 5.8 per cent increase from September 2022 and a 0.2 per cent decrease compared to
August 2023.
Attached home sales in September 2023 totalled 352, a 28.5 per cent increase compared to the
274 sales in September 2022. The benchmark price of an attached home is $1,098,400. This
represents a 5.3 per cent increase from September 2022 and a 0.5 per cent decrease compared to
August 2023.
-30-
*Editor’s Note: Areas covered by the Real Estate Board of Greater Vancouver include: Burnaby, Coquitlam, Maple
Ridge, New Westminster, North Vancouver, Pitt Meadows, Port Coquitlam, Port Moody, Richmond, South Delta,
Squamish, Sunshine Coast, Vancouver, West Vancouver, and Whistler.
The Real Estate Board of Greater Vancouver is an association representing more than 15,000 REALTORS® and
their companies. The Board provides a variety of member services, including the Multiple Listing Service®. For
more information on real estate, statistics, and buying or selling a home, contact a local REALTOR® or visit
www.rebgv.org.
For more information please contact:
Mark Moldowan
Manager, Communication and Editorial
Real Estate Board of Greater Vancouver
604.730.3153
mmoldowan@rebgv.org
Property Type Area
Benchmark
Price
Price
Index
1 Month
Change %
3 Month
Change %
6 Month
Change %
1 Year
Change %
3 Year
Change %
5 Year
Change %
10 Year
Change %
Residential / Composite Lower Mainland $1,140,900 346.7 -0.5% -0.3% 5.7% 3.7% 30.8% 28.1% 92.6%
Greater Vancouver $1,203,300 340.8 -0.4% 0.0% 5.0% 4.4% 26.0% 22.6% 81.8%
Bowen Island $1,444,400 303.1 2.1% 4.1% 2.3% -0.7% 33.6% 45.7% 143.5%
Burnaby East $1,179,500 367.0 -1.3% -0.9% 5.9% 5.6% 25.7% 22.3% 108.8%
Burnaby North $1,014,400 337.8 -0.5% -1.3% 2.9% 2.1% 22.2% 19.5% 96.3%
Burnaby South $1,127,600 355.8 -0.9% 0.4% 5.5% 6.1% 25.2% 21.4% 100.5%
Coquitlam $1,120,900 350.5 -1.2% -1.2% 3.5% 1.7% 29.9% 29.0% 115.4%
Ladner $1,178,700 342.3 0.0% 1.3% 10.8% 7.2% 42.5% 38.7% 119.8%
Maple Ridge $999,600 346.0 -0.6% 0.2% 7.5% 4.0% 42.7% 44.4% 155.9%
New Westminster $840,500 381.0 -0.8% 0.0% 4.8% 4.9% 30.2% 28.8% 119.7%
North Vancouver $1,388,000 318.9 -0.5% -1.5% 3.2% 5.1% 22.4% 24.1% 90.5%
Pitt Meadows $925,500 369.8 -0.2% -0.2% 9.3% 4.4% 41.1% 44.7% 159.1%
Port Coquitlam $958,600 368.7 -1.3% -1.0% 4.8% 5.3% 41.3% 42.2% 147.4%
Port Moody $1,125,600 355.5 -0.3% 0.6% 2.4% -1.1% 34.8% 31.4% 135.9%
Richmond $1,184,700 389.1 -0.3% -0.1% 2.8% 5.2% 31.5% 23.5% 95.4%
Squamish $1,082,300 353.5 -1.9% -1.8% 3.8% -0.6% 30.2% 39.7% 152.9%
Sunshine Coast $843,700 309.4 0.3% 0.1% 2.1% -3.2% 34.9% 45.1% 149.7%
Tsawwassen $1,247,800 324.2 2.6% 0.1% 9.8% 3.6% 29.7% 24.9% 109.6%
Vancouver East $1,228,800 382.2 -0.8% 1.0% 8.3% 7.6% 25.3% 24.6% 99.8%
Vancouver West $1,349,000 317.1 0.2% 0.9% 5.3% 5.7% 14.8% 7.0% 48.6%
West Vancouver $2,653,800 286.1 -0.2% 0.3% 6.3% -1.5% 14.4% 8.2% 48.7%
Whistler $1,372,200 308.3 -1.9% -2.3% 2.5% -1.7% 31.4% 47.7% 167.9%
Single Family Detached Lower Mainland $1,797,800 393.7 -0.2% 0.9% 8.6% 5.5% 35.4% 37.7% 110.6%
Greater Vancouver $2,017,100 375.1 -0.1% 1.3% 7.9% 5.8% 30.2% 29.1% 90.6%
Bowen Island $1,447,500 303.3 2.1% 4.1% 2.3% -0.6% 33.6% 45.6% 143.6%
Burnaby East $1,861,600 398.1 -3.2% -2.6% 8.6% 5.5% 31.6% 33.3% 125.8%
Burnaby North $2,048,900 391.8 0.1% 0.5% 6.4% 5.0% 32.5% 30.2% 116.5%
Burnaby South $2,197,100 411.8 -2.3% -0.7% 8.0% 6.5% 30.3% 28.3% 115.5%
Coquitlam $1,789,300 414.3 -0.5% 0.1% 4.3% 2.3% 36.9% 39.4% 150.6%
Ladner $1,441,400 348.8 -0.3% 1.3% 15.6% 6.9% 43.8% 46.6% 125.0%
Maple Ridge $1,297,200 378.9 -1.0% 1.0% 9.0% 5.3% 43.9% 51.5% 177.0%
New Westminster $1,538,600 380.9 -3.1% -2.1% 7.0% 3.4% 32.8% 36.0% 122.2%
North Vancouver $2,272,800 352.8 0.2% 0.1% 6.0% 8.5% 26.5% 32.4% 114.7%
Pitt Meadows $1,331,600 400.5 1.1% 0.9% 12.3% 8.4% 44.1% 55.3% 170.6%
Port Coquitlam $1,408,000 396.6 -2.1% -0.7% 7.0% 7.1% 44.1% 47.3% 169.4%
Port Moody $2,082,000 395.2 0.3% 2.3% 4.7% 0.9% 42.5% 36.7% 151.9%
Richmond $2,179,100 443.5 -0.9% -0.1% 3.5% 4.5% 31.0% 25.5% 113.2%
Squamish $1,581,000 386.8 -0.9% -3.6% 2.6% -5.6% 25.7% 45.4% 194.8%
Sunshine Coast $903,500 315.7 1.1% 0.4% 2.0% -4.3% 35.9% 48.5% 154.8%
Tsawwassen $1,594,500 352.5 3.0% -0.1% 14.0% 3.3% 33.5% 34.8% 132.5%
Vancouver East $1,898,100 422.2 -0.8% 1.0% 10.9% 8.9% 27.8% 30.9% 123.4%
Vancouver West $3,553,600 369.2 1.0% 3.9% 8.6% 8.0% 16.7% 14.2% 66.7%
West Vancouver $3,281,800 303.8 0.2% 1.7% 7.8% 0.2% 17.8% 12.0% 58.1%
Whistler $2,474,900 323.7 0.5% -1.4% 4.6% -4.3% 31.5% 51.0% 156.3%
HOW TO READ THE TABLE:
• Benchmark Price: Estimated sale price of a benchmark property. Benchmarks represent a typical property within each market.
• Price Index: Index numbers estimate the percentage change in price on typical and constant quality properties over time. All figures are based on past sales.
• x Month/Year Change %: Percentage change of index over a period of x month(s)/year(s) *
In January 2005, the indexes are set to 100.
Townhome properties are similar to Attached properties, a category that was used in the previous MLSLink HPI, but do not included duplexes.
The above info is deemed reliable, but is not guaranteed. All dollar amounts in CDN.
September 2023
*
* MLS®, Multiple Listing Service®, and all related graphics are trademarks of The Canadian Real Estate Association 1 of 20
Property Type Area
Benchmark
Price
Price
Index
1 Month
Change %
3 Month
Change %
6 Month
Change %
1 Year
Change %
3 Year
Change %
5 Year
Change %
10 Year
Change %
September 2023
*
Townhouse Lower Mainland $975,000 371.3 -0.2% 0.1% 5.3% 4.5% 39.8% 38.6% 139.1%
Greater Vancouver $1,098,400 381.5 -0.5% -0.1% 3.6% 5.3% 35.1% 34.0% 136.2%
Burnaby East $913,900 393.9 1.2% 5.8% 8.9% 8.7% 32.1% 33.1% 140.2%
Burnaby North $911,800 374.6 -0.3% 0.9% 4.8% 3.4% 32.3% 27.9% 131.7%
Burnaby South $1,022,200 385.4 -1.4% 2.4% 6.1% 7.9% 32.0% 28.0% 137.0%
Coquitlam $1,075,100 419.1 0.3% 0.0% 5.9% 4.2% 40.3% 42.9% 174.8%
Ladner $1,008,200 402.8 2.1% 3.8% 4.3% 12.9% 41.6% 31.4% 154.8%
Maple Ridge $774,800 388.4 1.5% -1.3% 6.2% 3.6% 42.3% 43.1% 183.1%
New Westminster $971,900 408.7 1.3% 2.8% 3.8% 6.6% 40.4% 36.2% 144.6%
North Vancouver $1,313,000 351.7 -0.5% -1.8% -3.1% 6.5% 31.6% 36.6% 132.1%
Pitt Meadows $816,400 399.4 -1.6% -1.8% 7.6% 0.1% 38.4% 32.3% 170.8%
Port Coquitlam $944,800 379.6 -0.9% -1.8% 6.1% 4.0% 40.8% 43.8% 165.8%
Port Moody $1,056,800 407.4 0.0% 2.3% 5.7% 2.5% 39.7% 41.7% 171.6%
Richmond $1,126,200 406.4 0.5% 0.4% 2.8% 8.0% 39.2% 32.9% 132.2%
Squamish $1,028,500 369.7 -3.5% -2.5% 2.5% 2.0% 41.6% 35.0% 188.4%
Sunshine Coast $740,000 341.6 -3.5% -2.3% 2.9% 3.8% 46.2% 42.5% 170.0%
Tsawwassen $1,028,300 304.0 2.4% 2.9% 1.7% 9.2% 26.2% 3.2% 86.4%
Vancouver East $1,140,400 376.1 0.4% 2.8% 4.5% 8.0% 24.8% 31.3% 114.8%
Vancouver West $1,457,900 331.6 -2.7% -2.6% 2.4% 1.0% 16.6% 17.4% 94.5%
Whistler $1,480,000 383.6 -3.7% -2.2% 2.6% 3.5% 49.9% 48.5% 228.1%
Apartment Lower Mainland $713,600 356.4 -0.4% -0.1% 4.5% 5.2% 26.0% 22.3% 112.1%
Greater Vancouver $768,500 354.1 -0.2% 0.2% 4.5% 5.8% 23.0% 20.0% 109.7%
Burnaby East $796,700 340.9 -0.3% -0.2% 2.0% 6.1% 23.2% 17.4% 109.0%
Burnaby North $746,800 371.9 -0.1% -0.9% 3.2% 4.4% 26.7% 25.5% 124.2%
Burnaby South $822,900 394.3 -0.1% 1.3% 5.6% 9.5% 27.7% 21.5% 127.9%
Coquitlam $729,100 413.3 -1.8% -1.1% 3.8% 4.7% 28.5% 27.8% 157.7%
Ladner $736,400 374.6 0.6% 2.4% 4.0% 4.0% 42.3% 43.5% 150.1%
Maple Ridge $542,600 379.7 -0.5% 1.9% 7.4% 1.9% 40.4% 37.8% 164.8%
New Westminster $661,900 403.8 0.4% 1.3% 4.3% 6.3% 27.1% 24.6% 141.2%
North Vancouver $811,900 327.0 -0.7% -0.9% 5.4% 4.0% 21.8% 21.2% 119.3%
Pitt Meadows $616,200 421.2 -0.6% 1.5% 8.1% 2.9% 36.4% 32.5% 168.8%
Port Coquitlam $626,600 428.0 0.0% -0.6% 2.0% 4.1% 32.8% 35.0% 176.1%
Port Moody $724,200 388.9 -0.7% -0.5% 3.3% 2.2% 26.3% 25.8% 151.2%
Richmond $750,200 412.2 0.4% 1.4% 3.4% 7.5% 29.3% 27.4% 131.6%
Squamish $626,200 371.4 -1.2% 3.3% 8.0% 8.3% 33.2% 42.9% 216.9%
Sunshine Coast $579,700 330.7 -2.7% 0.6% 7.3% 6.2% 23.4% 26.9% 127.3%
Tsawwassen $709,600 332.7 1.0% 2.7% 4.1% 4.8% 29.8% 25.5% 125.6%
Vancouver East $719,100 414.5 -0.6% 0.8% 4.7% 5.4% 16.9% 15.8% 115.1%
Vancouver West $849,800 324.4 0.3% -0.7% 3.7% 4.7% 14.3% 9.1% 88.7%
West Vancouver $1,331,600 259.5 -1.9% -0.6% 9.8% 11.5% 19.5% 11.3% 76.9%
Whistler $713,400 306.8 -2.1% 2.3% 10.0% 11.7% 40.2% 52.6% 216.0%
HOW TO READ THE TABLE:
• Benchmark Price: Estimated sale price of a benchmark property. Benchmarks represent a typical property within each market.
• Price Index: Index numbers estimate the percentage change in price on typical and constant quality properties over time. All figures are based on past sales.
• x Month/Year Change %: Percentage change of index over a period of x month(s)/year(s)
In January 2005, the indexes are set to 100. *
Townhome properties are similar to attached properties, a category that was used in the previous MLSLink HPI, but do not included duplexes.
Lower Mainland includes areas serviced by both Real Estate Board of Greater Vancouver & Fraser Valley Real Estate Board.
The above info is deemed reliable, but is not guaranteed. All dollar amounts in CDN.
* MLS®, Multiple Listing Service®, and all related graphics are trademarks of The Canadian Real Estate Association 2 of 20
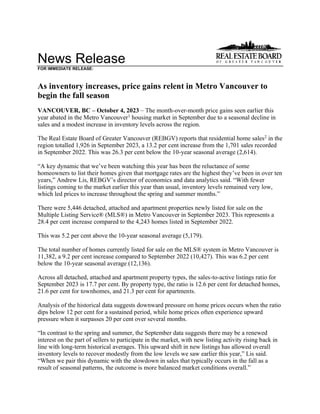
C:DATAMonthEndHpiexporthi_resgv-hpi2.tif
Greater
Vancouver
5
Year
Trend
60
110
160
210
260
310
360
410
460
Sep 2018
Nov 2018
Jan 2019
Mar 2019
May 2019
Jul 2019
Sep 2019
Nov 2019
Jan 2020
Mar 2020
May 2020
Jul 2020
Sep 2020
Nov 2020
Jan 2021
Mar 2021
May 2021
Jul 2021
Sep 2021
Nov 2021
Jan 2022
Mar 2022
May 2022
Jul 2022
Sep 2022
Nov 2022
Jan 2023
Mar 2023
May 2023
Jul 2023
Sep 2023
Price
Index
Residential
Detached
Townhouse
Apartment
Jan
2005
HPI
=
100
9
30
2023
MLS
®
SALES
Facts
B
u
r
n
a
b
y
C
o
q
u
it
la
m
D
e
lt
a
-
S
o
u
th
Is
la
n
d
s
-
G
u
lf
M
a
p
le
R
id
g
e
/P
it
t
M
e
a
d
o
w
s
N
e
w
W
e
s
tm
in
s
t
e
r
N
o
r
th
V
a
n
c
o
u
v
e
r
P
o
r
t
C
o
q
u
it
la
m
P
o
r
t
M
o
o
d
y
/B
e
lc
a
r
r
a
R
ic
h
m
o
n
d
S
q
u
a
m
is
h
S
u
n
s
h
in
e
C
o
a
s
t
V
a
n
c
o
u
v
e
r
E
a
s
t
V
a
n
c
o
u
v
e
r
W
e
s
t
W
e
s
t
V
a
n
c
o
u
v
e
r
/H
o
w
e
S
o
u
n
d
W
h
is
tl
e
r
/P
e
m
b
e
r
to
n
Detached
46
53
35
5
58
11
51
27
13
74
7
25
68
55
32
8
568
Attached
40
32
20
0
39
6
33
15
13
51
13
5
27
44
3
11
352
Apartment
171
83
13
0
35
55
84
23
17
130
7
4
97
238
18
13
988
Detached
$2,070,000
$1,846,500
$1,550,000
n/a
$1,258,750
n/a
$2,007,500
$1,438,000
n/a
$1,875,000
n/a
$880,000
$1,880,000
$3,402,500
$3,000,000
n/a
Attached
$1,191,750
$1,207,450
$1,119,950
n/a
$837,000
n/a
$1,380,000
n/a
n/a
$1,120,000
n/a
n/a
$1,325,000
$1,688,000
n/a
n/a
n/a
Apartment
$705,000
$705,000
n/a
n/a
$515,000
$593,800
$838,000
$626,500
n/a
$644,000
n/a
n/a
$688,000
$821,500
n/a
n/a
Detached
44
47
23
4
61
19
37
28
12
63
15
41
80
69
34
7
584
Attached
52
37
16
0
49
7
38
13
12
63
18
6
43
45
5
18
422
Apartment
207
119
13
0
32
61
85
28
34
193
14
6
127
319
17
15
1,270
Detached
$2,044,400
$1,730,000
$1,539,000
n/a
$1,312,500
n/a
$2,320,000
$1,413,750
n/a
$1,950,000
n/a
$1,005,000
$1,950,000
$4,070,000
$2,892,500
n/a
Attached
$1,139,000
$1,161,900
n/a
n/a
$793,000
n/a
$1,455,000
n/a
n/a
$1,150,000
n/a
n/a
$1,479,000
$1,496,000
n/a
n/a
n/a
Apartment
$720,000
$720,000
n/a
n/a
$559,000
$647,900
$821,000
$630,000
$730,000
$698,400
n/a
n/a
$678,000
$830,875
n/a
n/a
Detached
35
52
30
6
65
9
50
15
9
53
12
36
66
54
26
7
525
Attached
32
15
3
0
38
7
21
13
16
42
6
4
28
33
6
10
274
Apartment
157
74
8
0
31
51
57
22
28
115
13
2
84
214
10
22
888
Detached
$1,661,000
$1,715,000
$1,481,000
n/a
$1,192,500
n/a
$1,849,500
n/a
n/a
$2,085,400
n/a
$835,000
$1,660,000
$3,395,000
$2,695,000
n/a
Attached
$897,000
n/a
n/a
n/a
$747,450
n/a
$1,190,000
n/a
n/a
$1,046,500
n/a
n/a
$1,344,000
$1,619,500
n/a
n/a
n/a
Apartment
$667,000
$638,000
n/a
n/a
$525,000
$575,000
$712,000
$516,500
$687,500
$635,000
n/a
n/a
$612,500
$809,250
n/a
$757,500
Detached
505
526
328
49
729
161
549
214
131
670
135
311
716
657
285
92
6,058
Attached
462
357
145
0
413
92
294
134
142
556
122
60
515
403
38
150
3,883
Apartment
1,909
893
151
2
365
599
861
260
330
1,423
90
48
1,047
2,723
169
193
11,063
Detached
$1,950,000
$1,750,000
$1,475,000
$850,000
$1,253,000
$1,549,000
$2,100,000
$1,394,250
$1,893,750
$1,985,000
$1,445,000
$950,000
$1,905,000
$3,530,000
$3,105,000
$2,289,500
Attached
$1,094,000
$1,160,000
$1,040,000
n/a
$795,000
$970,000
$1,399,450
$948,000
$1,042,500
$1,150,000
$967,000
$638,000
$1,400,000
$1,643,000
$1,875,000
$1,437,500
n/a
Apartment
$728,000
$684,400
$645,000
n/a
$520,000
$618,000
$789,900
$597,000
$720,000
$683,000
$618,500
$480,000
$680,000
$846,750
$1,200,000
$650,000
Detached
580
600
350
51
791
169
609
280
144
765
155
432
814
696
368
92
6,896
Attached
454
309
110
2
456
119
334
193
159
633
141
68
479
480
51
160
4,148
Apartment
2,084
1,073
179
3
432
752
980
353
253
1,652
114
46
1,329
3,425
134
238
13,047
Detached
$2,100,000
$1,800,000
$1,620,000
$796,000
$1,401,000
$1,608,000
$2,198,000
$1,500,000
$2,035,000
$2,080,000
$1,550,000
$999,952
$1,960,000
$3,488,000
$3,000,000
$3,095,000
Attached
$1,050,000
$1,150,000
$965,000
n/a
$840,000
$999,999
$1,369,000
$985,000
$1,050,000
$1,120,888
$1,049,000
$633,000
$1,379,000
$1,579,000
$2,275,000
$1,377,501
n/a
Apartment
$715,000
$700,000
$655,000
n/a
$550,000
$615,000
$791,000
$582,500
$742,000
$673,800
$694,050
$579,000
$675,000
$850,000
$1,120,000
$618,500
Note:
Median
Selling
Prices
are
not
reported
for
areas
with
less
than
20
sales
or
for
the
Gulf
Islands
Number
of
Sales
September
2023
Number
of
Sales
Median
Selling
Price
Number
of
Sales
Median
Selling
Price
Number
of
Sales
Median
Selling
Price
August
2023
September
2022
Jan.
-
Sep.
2023
Jan.
-
Sep.
2022
Median
Selling
Price
Number
of
Sales
Median
Selling
Price
September
2023
Year-to-date
Year-to-date
9
30
2023
MLS
®
LISTINGS
Facts
B
u
r
n
a
b
y
C
o
q
u
it
la
m
D
e
lt
a
-
S
o
u
th
Is
la
n
d
s
-
G
u
lf
M
a
p
le
R
id
g
e
/P
it
t
M
e
a
d
o
w
s
N
e
w
W
e
s
tm
in
s
t
e
r
N
o
r
th
V
a
n
c
o
u
v
e
r
P
o
r
t
C
o
q
u
it
la
m
P
o
r
t
M
o
o
d
y
/B
e
lc
a
r
r
a
R
ic
h
m
o
n
d
S
q
u
a
m
is
h
S
u
n
s
h
in
e
C
o
a
s
t
V
a
n
c
o
u
v
e
r
E
a
s
t
V
a
n
c
o
u
v
e
r
W
e
s
t
W
e
s
t
V
a
n
c
o
u
v
e
r
/H
o
w
e
S
o
u
n
d
W
h
is
tl
e
r
/P
e
m
b
e
r
to
n
Detached
125
140
75
10
226
38
170
45
34
179
41
101
190
193
192
32
1,791
Attached
97
88
39
0
81
12
93
38
23
114
31
4
164
149
15
32
980
Apartment
408
211
23
0
93
121
213
55
43
299
24
13
270
809
37
33
2,652
Detached
37%
38%
47%
50%
26%
29%
30%
60%
38%
41%
17%
25%
36%
28%
17%
25%
Attached
41%
36%
51%
n/a
48%
50%
35%
39%
57%
45%
42%
125%
16%
30%
20%
34%
n/a
Apartment
42%
39%
57%
n/a
38%
45%
39%
42%
40%
43%
29%
31%
36%
29%
49%
39%
Detached
101
72
55
18
171
30
85
52
28
150
36
103
140
141
107
35
1,324
Attached
75
72
18
2
63
21
52
23
15
97
22
9
78
101
9
20
677
Apartment
325
150
13
0
70
103
115
40
32
247
18
13
162
579
31
18
1,916
Detached
44%
65%
42%
22%
36%
63%
44%
54%
43%
42%
42%
40%
57%
49%
32%
20%
Attached
69%
51%
89%
0%
78%
33%
73%
57%
80%
65%
82%
67%
55%
45%
56%
90%
n/a
Apartment
64%
79%
100%
n/a
46%
59%
74%
70%
106%
78%
78%
46%
78%
55%
55%
83%
Detached
102
114
57
13
199
35
148
29
24
144
35
89
130
174
122
22
1,437
Attached
81
46
11
2
60
24
77
31
16
93
20
10
96
98
19
21
705
Apartment
253
159
27
0
67
112
173
63
46
224
19
16
222
635
48
23
2,087
Detached
34%
46%
53%
46%
33%
26%
34%
52%
38%
37%
34%
40%
51%
31%
21%
32%
Attached
40%
33%
27%
0%
63%
29%
27%
42%
100%
45%
30%
40%
29%
34%
32%
48%
n/a
Apartment
62%
47%
30%
n/a
46%
46%
33%
35%
61%
51%
68%
13%
38%
34%
21%
96%
Detached
1,001
981
625
106
1,615
308
1,084
389
272
1,448
326
888
1,462
1,546
1,176
230
13,457
Attached
767
685
245
5
619
157
513
207
204
935
203
103
1,049
999
104
247
7,042
Apartment
3,157
1,480
223
2
645
942
1,420
429
467
2,337
151
90
1,927
5,902
344
278
19,794
Detached
50%
54%
52%
46%
45%
52%
51%
55%
48%
46%
41%
35%
49%
42%
24%
40%
Attached
60%
52%
59%
0%
67%
59%
57%
65%
70%
59%
60%
58%
49%
40%
37%
61%
n/a
Apartment
60%
60%
68%
100%
57%
64%
61%
61%
71%
61%
60%
53%
54%
46%
49%
69%
Detached
1,179
1,199
716
109
2,006
369
1,270
532
287
1,781
352
877
1,778
1,878
1,241
232
15,806
Attached
805
560
193
9
887
196
599
289
240
1,139
236
101
994
1,035
99
260
7,642
Apartment
3,277
1,710
248
5
686
1,144
1,602
551
444
2,637
201
86
2,221
6,613
343
348
22,116
Detached
49%
50%
49%
47%
39%
46%
48%
53%
50%
43%
44%
49%
46%
37%
30%
40%
Attached
56%
55%
57%
22%
51%
61%
56%
67%
66%
56%
60%
67%
48%
46%
52%
62%
n/a
Apartment
64%
63%
72%
60%
63%
66%
61%
64%
57%
63%
57%
53%
60%
52%
39%
68%
*
Year-to-date
listings
represent
a
cumulative
total
of
listings
rather
than
total
active
listings.
%
Sales
to
Listings
Number
of
Listings
%
Sales
to
Listings
August
2023
September
2022
Jan.
-
Sep.
2023
Jan.
-
Sep.
2022
%
Sales
to
Listings
Number
of
Listings
%
Sales
to
Listings
Number
of
Listings
September
2023
Number
of
Listings
%
Sales
to
Listings
Number
of
Listings
September
2023
Year-to-date*
Year-to-date*
Listing & Sales Activity Summary
Listings Sales
1 2 3 Col. 2 & 3 5 6 7 Col. 6 & 7 9 10 Col. 9 & 10
Sep Aug Sep Percentage Sep Aug Sep Percentage Jul 2022 - Jul 2023 - Percentage
2022 2023 2023 Variance 2022 2023 2023 Variance Sep 2022 Sep 2023 Variance
BURNABY % % %
DETACHED 102 101 125 23.8 35 44 46 4.5 139 149 7.2
ATTACHED 81 75 97 29.3 32 52 40 -23.1 102 144 41.2
APARTMENTS 253 325 408 25.5 157 207 171 -17.4 518 590 13.9
COQUITLAM
DETACHED 114 72 140 94.4 52 47 53 12.8 150 169 12.7
ATTACHED 46 72 88 22.2 15 37 32 -13.5 70 123 75.7
APARTMENTS 159 150 211 40.7 74 119 83 -30.3 219 302 37.9
DELTA
DETACHED 57 55 75 36.4 30 23 35 52.2 74 87 17.6
ATTACHED 11 18 39 116.7 3 16 20 25.0 23 52 126.1
APARTMENTS 27 13 23 76.9 8 13 13 0.0 35 40 14.3
MAPLE RIDGE/PITT MEADOWS
DETACHED 199 171 226 32.2 65 61 58 -4.9 191 202 5.8
ATTACHED 60 63 81 28.6 38 49 39 -20.4 111 131 18.0
APARTMENTS 67 70 93 32.9 31 32 35 9.4 91 108 18.7
NORTH VANCOUVER
DETACHED 148 85 170 100.0 50 37 51 37.8 136 146 7.4
ATTACHED 77 52 93 78.8 21 38 33 -13.2 66 99 50.0
APARTMENTS 173 115 213 85.2 57 85 84 -1.2 223 268 20.2
NEW WESTMINSTER
DETACHED 35 30 38 26.7 9 19 11 -42.1 32 55 71.9
ATTACHED 24 21 12 -42.9 7 7 6 -14.3 32 29 -9.4
APARTMENTS 112 103 121 17.5 51 61 55 -9.8 162 194 19.8
PORT MOODY/BELCARRA
DETACHED 24 28 34 21.4 9 12 13 8.3 28 43 53.6
ATTACHED 16 15 23 53.3 16 12 13 8.3 34 47 38.2
APARTMENTS 46 32 43 34.4 28 34 17 -50.0 69 92 33.3
PORT COQUITLAM
DETACHED 29 52 45 -13.5 15 28 27 -3.6 64 82 28.1
ATTACHED 31 23 38 65.2 13 13 15 15.4 53 42 -20.8
APARTMENTS 63 40 55 37.5 22 28 23 -17.9 81 83 2.5
RICHMOND
DETACHED 144 150 179 19.3 53 63 74 17.5 163 195 19.6
ATTACHED 93 97 114 17.5 42 63 51 -19.0 137 184 34.3
APARTMENTS 224 247 299 21.1 115 193 130 -32.6 358 486 35.8
SUNSHINE COAST
DETACHED 89 103 101 -1.9 36 41 25 -39.0 99 102 3.0
ATTACHED 10 9 4 -55.6 4 6 5 -16.7 10 19 90.0
APARTMENTS 16 13 13 0.0 2 6 4 -33.3 11 13 18.2
SQUAMISH
DETACHED 35 36 41 13.9 12 15 7 -53.3 34 42 23.5
ATTACHED 20 22 31 40.9 6 18 13 -27.8 23 43 87.0
APARTMENTS 19 18 24 33.3 13 14 7 -50.0 22 29 31.8
VANCOUVER EAST
DETACHED 130 140 190 35.7 66 80 68 -15.0 177 238 34.5
ATTACHED 96 78 164 110.3 28 43 27 -37.2 123 138 12.2
APARTMENTS 222 162 270 66.7 84 127 97 -23.6 271 351 29.5
VANCOUVER WEST
DETACHED 174 141 193 36.9 54 69 55 -20.3 157 193 22.9
ATTACHED 98 101 149 47.5 33 45 44 -2.2 102 133 30.4
APARTMENTS 635 579 809 39.7 214 319 238 -25.4 790 882 11.6
WHISTLER/PEMBERTON
DETACHED 22 35 32 -8.6 7 7 8 14.3 22 24 9.1
ATTACHED 21 20 32 60.0 10 18 11 -38.9 33 46 39.4
APARTMENTS 23 18 33 83.3 22 15 13 -13.3 52 42 -19.2
WEST VANCOUVER/HOWE SOUND
DETACHED 122 107 192 79.4 26 34 32 -5.9 84 89 6.0
ATTACHED 19 9 15 66.7 6 5 3 -40.0 14 10 -28.6
APARTMENTS 48 31 37 19.4 10 17 18 5.9 44 58 31.8
GRAND TOTALS
DETACHED 1424 1306 1781 36.4 519 580 563 -2.9 1550 1816 17.2
ATTACHED 703 675 980 45.2 274 422 352 -16.6 933 1240 32.9
APARTMENTS 2087 1916 2652 38.4 888 1270 988 -22.2 2946 3538 20.1
Residential
Average
Sale
Prices
-
January
1977
to
September
2023
0
500
1000
1500
2000
2500
1
9
7
7
1
9
7
8
1
9
7
9
1
9
8
0
1
9
8
1
1
9
8
2
1
9
8
3
1
9
8
4
1
9
8
5
1
9
8
6
1
9
8
7
1
9
8
8
1
9
8
9
1
9
9
0
1
9
9
1
1
9
9
2
1
9
9
3
1
9
9
4
1
9
9
5
1
9
9
6
1
9
9
7
1
9
9
8
1
9
9
9
2
0
0
0
2
0
0
1
2
0
0
2
2
0
0
3
2
0
0
4
2
0
0
5
2
0
0
6
2
0
0
7
2
0
0
8
2
0
0
9
2
0
1
0
2
0
1
1
2
0
1
2
2
0
1
3
2
0
1
4
2
0
1
5
2
0
1
6
2
0
1
7
2
0
1
8
2
0
1
9
2
0
2
0
2
0
2
1
2
0
2
2
2
0
2
3
DETACHED
CONDOMINIUM
ATTACHED
APARTMENTS
IN
THOUSANDS
($)
NOTE:
From
1977
-
1984
condominium
averages
were
not
separated
into
attached
&
apartment.
$1,227,218
$816,356
$2,172,613

More Related Content

Similar to Real Estate Board of Greater Vancouver Statistics Package September 2023.pdf

Rebgv stats-pkg-march-2019
Rebgv stats-pkg-march-2019Rebgv stats-pkg-march-2019
Rebgv stats-pkg-march-2019Sherryl Jacobs
 
Rebgv stats-pkg-november-2019-f
Rebgv stats-pkg-november-2019-fRebgv stats-pkg-november-2019-f
Rebgv stats-pkg-november-2019-fVicky Aulakh
 
REBGV January 2020 Statistics Package
REBGV January 2020 Statistics Package REBGV January 2020 Statistics Package
REBGV January 2020 Statistics Package Vicky Aulakh
 
REBGV Statistics Package October 2020
REBGV Statistics Package October 2020REBGV Statistics Package October 2020
REBGV Statistics Package October 2020Vicky Aulakh
 
Rebgv stats-pkg-february-2019
Rebgv stats-pkg-february-2019Rebgv stats-pkg-february-2019
Rebgv stats-pkg-february-2019Kathryn Huang
 
Rebgv stats-pkg-february-2019
Rebgv stats-pkg-february-2019Rebgv stats-pkg-february-2019
Rebgv stats-pkg-february-2019Sherryl Jacobs
 
Real Estate Board of Greater Vancouver Statistics Package August 2021
Real Estate Board of Greater Vancouver Statistics Package August 2021Real Estate Board of Greater Vancouver Statistics Package August 2021
Real Estate Board of Greater Vancouver Statistics Package August 2021Vicky Aulakh
 
Rebgv stats-pkg-september-2018
Rebgv stats-pkg-september-2018Rebgv stats-pkg-september-2018
Rebgv stats-pkg-september-2018Kathryn Huang
 
Real Estate Board of Greater Vancouver Statistics Package January 2021
Real Estate Board of Greater Vancouver Statistics Package January 2021 Real Estate Board of Greater Vancouver Statistics Package January 2021
Real Estate Board of Greater Vancouver Statistics Package January 2021 Vicky Aulakh
 
REBGV Statistics Package June 2020
REBGV Statistics Package June 2020REBGV Statistics Package June 2020
REBGV Statistics Package June 2020Vicky Aulakh
 
REBGV Statistics Package November 2022
REBGV Statistics Package November 2022REBGV Statistics Package November 2022
REBGV Statistics Package November 2022VickyAulakh1
 
May-2019 Stats Package for Greater Vancouver
May-2019 Stats Package for Greater VancouverMay-2019 Stats Package for Greater Vancouver
May-2019 Stats Package for Greater VancouverBC PRIME Realty
 
Rebgv stats-pkg-may-2019
Rebgv stats-pkg-may-2019Rebgv stats-pkg-may-2019
Rebgv stats-pkg-may-2019Kathryn Huang
 
October 2016 REBGV Statistics Package Vancouver BC Mike Stewart Realtor
October 2016 REBGV Statistics Package Vancouver BC Mike Stewart RealtorOctober 2016 REBGV Statistics Package Vancouver BC Mike Stewart Realtor
October 2016 REBGV Statistics Package Vancouver BC Mike Stewart RealtorMike Stewart
 
REBGV Statistic Package December 2020
REBGV Statistic Package December 2020REBGV Statistic Package December 2020
REBGV Statistic Package December 2020Vicky Aulakh
 
REBGV Statistics Package May 2020
REBGV Statistics Package May 2020REBGV Statistics Package May 2020
REBGV Statistics Package May 2020Vicky Aulakh
 
Rebgv stats-pkg-january-2019
Rebgv stats-pkg-january-2019Rebgv stats-pkg-january-2019
Rebgv stats-pkg-january-2019Kathryn Huang
 

Similar to Real Estate Board of Greater Vancouver Statistics Package September 2023.pdf (19)

Rebgv stats-pkg-march-2019
Rebgv stats-pkg-march-2019Rebgv stats-pkg-march-2019
Rebgv stats-pkg-march-2019
 
Rebgv stats-pkg-november-2019-f
Rebgv stats-pkg-november-2019-fRebgv stats-pkg-november-2019-f
Rebgv stats-pkg-november-2019-f
 
REBGV January 2020 Statistics Package
REBGV January 2020 Statistics Package REBGV January 2020 Statistics Package
REBGV January 2020 Statistics Package
 
REBGV Statistics Package October 2020
REBGV Statistics Package October 2020REBGV Statistics Package October 2020
REBGV Statistics Package October 2020
 
Rebgv stats-pkg-october-2020
Rebgv stats-pkg-october-2020Rebgv stats-pkg-october-2020
Rebgv stats-pkg-october-2020
 
Rebgv stats-pkg-february-2019
Rebgv stats-pkg-february-2019Rebgv stats-pkg-february-2019
Rebgv stats-pkg-february-2019
 
Rebgv stats-pkg-february-2019
Rebgv stats-pkg-february-2019Rebgv stats-pkg-february-2019
Rebgv stats-pkg-february-2019
 
Real Estate Board of Greater Vancouver Statistics Package August 2021
Real Estate Board of Greater Vancouver Statistics Package August 2021Real Estate Board of Greater Vancouver Statistics Package August 2021
Real Estate Board of Greater Vancouver Statistics Package August 2021
 
Rebgv stats-pkg-august-2021
Rebgv stats-pkg-august-2021Rebgv stats-pkg-august-2021
Rebgv stats-pkg-august-2021
 
Rebgv stats-pkg-september-2018
Rebgv stats-pkg-september-2018Rebgv stats-pkg-september-2018
Rebgv stats-pkg-september-2018
 
Real Estate Board of Greater Vancouver Statistics Package January 2021
Real Estate Board of Greater Vancouver Statistics Package January 2021 Real Estate Board of Greater Vancouver Statistics Package January 2021
Real Estate Board of Greater Vancouver Statistics Package January 2021
 
REBGV Statistics Package June 2020
REBGV Statistics Package June 2020REBGV Statistics Package June 2020
REBGV Statistics Package June 2020
 
REBGV Statistics Package November 2022
REBGV Statistics Package November 2022REBGV Statistics Package November 2022
REBGV Statistics Package November 2022
 
May-2019 Stats Package for Greater Vancouver
May-2019 Stats Package for Greater VancouverMay-2019 Stats Package for Greater Vancouver
May-2019 Stats Package for Greater Vancouver
 
Rebgv stats-pkg-may-2019
Rebgv stats-pkg-may-2019Rebgv stats-pkg-may-2019
Rebgv stats-pkg-may-2019
 
October 2016 REBGV Statistics Package Vancouver BC Mike Stewart Realtor
October 2016 REBGV Statistics Package Vancouver BC Mike Stewart RealtorOctober 2016 REBGV Statistics Package Vancouver BC Mike Stewart Realtor
October 2016 REBGV Statistics Package Vancouver BC Mike Stewart Realtor
 
REBGV Statistic Package December 2020
REBGV Statistic Package December 2020REBGV Statistic Package December 2020
REBGV Statistic Package December 2020
 
REBGV Statistics Package May 2020
REBGV Statistics Package May 2020REBGV Statistics Package May 2020
REBGV Statistics Package May 2020
 
Rebgv stats-pkg-january-2019
Rebgv stats-pkg-january-2019Rebgv stats-pkg-january-2019
Rebgv stats-pkg-january-2019
 

More from VickyAulakh1

NIDO by Wanson Group Floor Plan Set 2024
NIDO by Wanson Group Floor Plan Set 2024NIDO by Wanson Group Floor Plan Set 2024
NIDO by Wanson Group Floor Plan Set 2024VickyAulakh1
 
Portico by Wanson Group Floor Plans 2024
Portico by Wanson Group Floor Plans 2024Portico by Wanson Group Floor Plans 2024
Portico by Wanson Group Floor Plans 2024VickyAulakh1
 
Portico By Wanson Group Floor Plans 2024
Portico By Wanson Group Floor Plans 2024Portico By Wanson Group Floor Plans 2024
Portico By Wanson Group Floor Plans 2024VickyAulakh1
 
The Trails North Vancouver Floor Plans Feb 25, 2024
The Trails North Vancouver Floor Plans Feb 25, 2024The Trails North Vancouver Floor Plans Feb 25, 2024
The Trails North Vancouver Floor Plans Feb 25, 2024VickyAulakh1
 
AMAYA LIVING Surrey FLOOR PLANS by Panorama West Group
AMAYA LIVING Surrey FLOOR PLANS by Panorama West GroupAMAYA LIVING Surrey FLOOR PLANS by Panorama West Group
AMAYA LIVING Surrey FLOOR PLANS by Panorama West GroupVickyAulakh1
 
Willow Walk Oakridge Townhome & Garden Flat Floor Plans
Willow Walk Oakridge Townhome & Garden Flat Floor PlansWillow Walk Oakridge Townhome & Garden Flat Floor Plans
Willow Walk Oakridge Townhome & Garden Flat Floor PlansVickyAulakh1
 
JUNO Surrey By Streetside Developments Floor Plans
JUNO Surrey By Streetside Developments Floor PlansJUNO Surrey By Streetside Developments Floor Plans
JUNO Surrey By Streetside Developments Floor PlansVickyAulakh1
 
SKA+Building+2+Floorplan+-+Web+-+Current.pdf
SKA+Building+2+Floorplan+-+Web+-+Current.pdfSKA+Building+2+Floorplan+-+Web+-+Current.pdf
SKA+Building+2+Floorplan+-+Web+-+Current.pdfVickyAulakh1
 
Nolita-Floorplans.pdf
Nolita-Floorplans.pdfNolita-Floorplans.pdf
Nolita-Floorplans.pdfVickyAulakh1
 
Adore 49 Floor Plans.pdf
Adore 49 Floor Plans.pdfAdore 49 Floor Plans.pdf
Adore 49 Floor Plans.pdfVickyAulakh1
 
Citizen Burnaby Floor Plans
Citizen Burnaby Floor PlansCitizen Burnaby Floor Plans
Citizen Burnaby Floor PlansVickyAulakh1
 
VREB May 2023 Statistics Package.pdf
VREB May 2023 Statistics Package.pdfVREB May 2023 Statistics Package.pdf
VREB May 2023 Statistics Package.pdfVickyAulakh1
 
April 2023 Okanagan Statistics Graphs.pdf
April 2023 Okanagan Statistics Graphs.pdfApril 2023 Okanagan Statistics Graphs.pdf
April 2023 Okanagan Statistics Graphs.pdfVickyAulakh1
 
FVREB April 2023 Statistics Package.pdf
FVREB April 2023 Statistics Package.pdfFVREB April 2023 Statistics Package.pdf
FVREB April 2023 Statistics Package.pdfVickyAulakh1
 
VREB April 2023 Stats.pdf
VREB April 2023 Stats.pdfVREB April 2023 Stats.pdf
VREB April 2023 Stats.pdfVickyAulakh1
 
Okanagan Statistics Reports March 2023
Okanagan Statistics Reports March 2023Okanagan Statistics Reports March 2023
Okanagan Statistics Reports March 2023VickyAulakh1
 
FVREB March 2023 Statistics Package.pdf
FVREB March 2023 Statistics Package.pdfFVREB March 2023 Statistics Package.pdf
FVREB March 2023 Statistics Package.pdfVickyAulakh1
 
VREB March 2023.pdf
VREB March 2023.pdfVREB March 2023.pdf
VREB March 2023.pdfVickyAulakh1
 
Central Okangan Monthly Statistics - February 2023.pdf
Central Okangan Monthly Statistics - February 2023.pdfCentral Okangan Monthly Statistics - February 2023.pdf
Central Okangan Monthly Statistics - February 2023.pdfVickyAulakh1
 
FVREB Feb 2023 Statistics Package.pdf
FVREB Feb 2023 Statistics Package.pdfFVREB Feb 2023 Statistics Package.pdf
FVREB Feb 2023 Statistics Package.pdfVickyAulakh1
 

More from VickyAulakh1 (20)

NIDO by Wanson Group Floor Plan Set 2024
NIDO by Wanson Group Floor Plan Set 2024NIDO by Wanson Group Floor Plan Set 2024
NIDO by Wanson Group Floor Plan Set 2024
 
Portico by Wanson Group Floor Plans 2024
Portico by Wanson Group Floor Plans 2024Portico by Wanson Group Floor Plans 2024
Portico by Wanson Group Floor Plans 2024
 
Portico By Wanson Group Floor Plans 2024
Portico By Wanson Group Floor Plans 2024Portico By Wanson Group Floor Plans 2024
Portico By Wanson Group Floor Plans 2024
 
The Trails North Vancouver Floor Plans Feb 25, 2024
The Trails North Vancouver Floor Plans Feb 25, 2024The Trails North Vancouver Floor Plans Feb 25, 2024
The Trails North Vancouver Floor Plans Feb 25, 2024
 
AMAYA LIVING Surrey FLOOR PLANS by Panorama West Group
AMAYA LIVING Surrey FLOOR PLANS by Panorama West GroupAMAYA LIVING Surrey FLOOR PLANS by Panorama West Group
AMAYA LIVING Surrey FLOOR PLANS by Panorama West Group
 
Willow Walk Oakridge Townhome & Garden Flat Floor Plans
Willow Walk Oakridge Townhome & Garden Flat Floor PlansWillow Walk Oakridge Townhome & Garden Flat Floor Plans
Willow Walk Oakridge Townhome & Garden Flat Floor Plans
 
JUNO Surrey By Streetside Developments Floor Plans
JUNO Surrey By Streetside Developments Floor PlansJUNO Surrey By Streetside Developments Floor Plans
JUNO Surrey By Streetside Developments Floor Plans
 
SKA+Building+2+Floorplan+-+Web+-+Current.pdf
SKA+Building+2+Floorplan+-+Web+-+Current.pdfSKA+Building+2+Floorplan+-+Web+-+Current.pdf
SKA+Building+2+Floorplan+-+Web+-+Current.pdf
 
Nolita-Floorplans.pdf
Nolita-Floorplans.pdfNolita-Floorplans.pdf
Nolita-Floorplans.pdf
 
Adore 49 Floor Plans.pdf
Adore 49 Floor Plans.pdfAdore 49 Floor Plans.pdf
Adore 49 Floor Plans.pdf
 
Citizen Burnaby Floor Plans
Citizen Burnaby Floor PlansCitizen Burnaby Floor Plans
Citizen Burnaby Floor Plans
 
VREB May 2023 Statistics Package.pdf
VREB May 2023 Statistics Package.pdfVREB May 2023 Statistics Package.pdf
VREB May 2023 Statistics Package.pdf
 
April 2023 Okanagan Statistics Graphs.pdf
April 2023 Okanagan Statistics Graphs.pdfApril 2023 Okanagan Statistics Graphs.pdf
April 2023 Okanagan Statistics Graphs.pdf
 
FVREB April 2023 Statistics Package.pdf
FVREB April 2023 Statistics Package.pdfFVREB April 2023 Statistics Package.pdf
FVREB April 2023 Statistics Package.pdf
 
VREB April 2023 Stats.pdf
VREB April 2023 Stats.pdfVREB April 2023 Stats.pdf
VREB April 2023 Stats.pdf
 
Okanagan Statistics Reports March 2023
Okanagan Statistics Reports March 2023Okanagan Statistics Reports March 2023
Okanagan Statistics Reports March 2023
 
FVREB March 2023 Statistics Package.pdf
FVREB March 2023 Statistics Package.pdfFVREB March 2023 Statistics Package.pdf
FVREB March 2023 Statistics Package.pdf
 
VREB March 2023.pdf
VREB March 2023.pdfVREB March 2023.pdf
VREB March 2023.pdf
 
Central Okangan Monthly Statistics - February 2023.pdf
Central Okangan Monthly Statistics - February 2023.pdfCentral Okangan Monthly Statistics - February 2023.pdf
Central Okangan Monthly Statistics - February 2023.pdf
 
FVREB Feb 2023 Statistics Package.pdf
FVREB Feb 2023 Statistics Package.pdfFVREB Feb 2023 Statistics Package.pdf
FVREB Feb 2023 Statistics Package.pdf
 

Recently uploaded

Call Girls In Mayur Vihar-1 Delhi ❤️8860477959 Good Looking Escorts In 24/7 D...
Call Girls In Mayur Vihar-1 Delhi ❤️8860477959 Good Looking Escorts In 24/7 D...Call Girls In Mayur Vihar-1 Delhi ❤️8860477959 Good Looking Escorts In 24/7 D...
Call Girls In Mayur Vihar-1 Delhi ❤️8860477959 Good Looking Escorts In 24/7 D...lizamodels9
 
Namrata 7 Plumeria Drive Pimpri Chinchwad Pune Brochure.pdf
Namrata 7 Plumeria Drive Pimpri Chinchwad Pune Brochure.pdfNamrata 7 Plumeria Drive Pimpri Chinchwad Pune Brochure.pdf
Namrata 7 Plumeria Drive Pimpri Chinchwad Pune Brochure.pdfPrachiRudram
 
Call Girls in Pitampura Delhi 💯Call Us 🔝8264348440🔝
Call Girls in Pitampura Delhi 💯Call Us 🔝8264348440🔝Call Girls in Pitampura Delhi 💯Call Us 🔝8264348440🔝
Call Girls in Pitampura Delhi 💯Call Us 🔝8264348440🔝soniya singh
 
Call Girls In Mundka Industrial Metro@꧂8447779280 ↬Enjoy ꧂Escort Service in ...
Call Girls In Mundka Industrial Metro@꧂8447779280 ↬Enjoy ꧂Escort Service in  ...Call Girls In Mundka Industrial Metro@꧂8447779280 ↬Enjoy ꧂Escort Service in  ...
Call Girls In Mundka Industrial Metro@꧂8447779280 ↬Enjoy ꧂Escort Service in ...asmaqueen5
 
Call Girls In Vasundhara Ghaziabad ❤️8860477959 Low Rate Escorts Service In 2...
Call Girls In Vasundhara Ghaziabad ❤️8860477959 Low Rate Escorts Service In 2...Call Girls In Vasundhara Ghaziabad ❤️8860477959 Low Rate Escorts Service In 2...
Call Girls In Vasundhara Ghaziabad ❤️8860477959 Low Rate Escorts Service In 2...lizamodels9
 
Low Rate Call Girls in Akshardham Delhi Call 9990771857
Low Rate Call Girls in Akshardham   Delhi Call 9990771857Low Rate Call Girls in Akshardham   Delhi Call 9990771857
Low Rate Call Girls in Akshardham Delhi Call 9990771857delhimodel235
 
Call Girls in Kashmiri Gate Delhi 💯Call Us 🔝8264348440🔝
Call Girls in Kashmiri Gate Delhi 💯Call Us 🔝8264348440🔝Call Girls in Kashmiri Gate Delhi 💯Call Us 🔝8264348440🔝
Call Girls in Kashmiri Gate Delhi 💯Call Us 🔝8264348440🔝soniya singh
 
Nanke Area Estate commercial ( Dir. Kat Kuo)
Nanke Area Estate commercial ( Dir. Kat Kuo)Nanke Area Estate commercial ( Dir. Kat Kuo)
Nanke Area Estate commercial ( Dir. Kat Kuo)jessica288382
 
Call Girls In The Lalit New Delhi ❤️8860477959 Good Looking Escorts In 24/7 D...
Call Girls In The Lalit New Delhi ❤️8860477959 Good Looking Escorts In 24/7 D...Call Girls In The Lalit New Delhi ❤️8860477959 Good Looking Escorts In 24/7 D...
Call Girls In The Lalit New Delhi ❤️8860477959 Good Looking Escorts In 24/7 D...lizamodels9
 
Choose Noida's Leading Architect
Choose    Noida's    Leading   ArchitectChoose    Noida's    Leading   Architect
Choose Noida's Leading ArchitectMM Design Studio
 
Call Girls in Nehru Place Delhi 💯Call Us 🔝8264348440🔝
Call Girls in Nehru Place Delhi 💯Call Us 🔝8264348440🔝Call Girls in Nehru Place Delhi 💯Call Us 🔝8264348440🔝
Call Girls in Nehru Place Delhi 💯Call Us 🔝8264348440🔝soniya singh
 
Call Girls in Khan Market 9654467111 ESCORTS SERVICE
Call Girls in Khan Market 9654467111 ESCORTS SERVICECall Girls in Khan Market 9654467111 ESCORTS SERVICE
Call Girls in Khan Market 9654467111 ESCORTS SERVICESapana Sha
 
SSPL The Strand Abodes Kharadi Pune Brochure.pdf
SSPL The Strand Abodes Kharadi Pune Brochure.pdfSSPL The Strand Abodes Kharadi Pune Brochure.pdf
SSPL The Strand Abodes Kharadi Pune Brochure.pdfabbu831446
 
SVN Live 4.22.24 Weekly Property Broadcast
SVN Live 4.22.24 Weekly Property BroadcastSVN Live 4.22.24 Weekly Property Broadcast
SVN Live 4.22.24 Weekly Property BroadcastSVN International Corp.
 
Call Girls in Inderpuri Delhi 💯Call Us 🔝8264348440🔝
Call Girls in Inderpuri Delhi 💯Call Us 🔝8264348440🔝Call Girls in Inderpuri Delhi 💯Call Us 🔝8264348440🔝
Call Girls in Inderpuri Delhi 💯Call Us 🔝8264348440🔝soniya singh
 
Purva Palm Hills Devanahalli, Bangalore E- Brochure.pdf
Purva Palm Hills Devanahalli, Bangalore E- Brochure.pdfPurva Palm Hills Devanahalli, Bangalore E- Brochure.pdf
Purva Palm Hills Devanahalli, Bangalore E- Brochure.pdffaheemali990101
 
The Omaxe State Dwarka Delhi-broucher.pdf.pdf
The Omaxe State Dwarka Delhi-broucher.pdf.pdfThe Omaxe State Dwarka Delhi-broucher.pdf.pdf
The Omaxe State Dwarka Delhi-broucher.pdf.pdfkratirudram
 
Rustomjee The Panorama At Pali Hill, Bandra West, Mumbai - Brochure.pdf
Rustomjee The Panorama At Pali Hill, Bandra West, Mumbai - Brochure.pdfRustomjee The Panorama At Pali Hill, Bandra West, Mumbai - Brochure.pdf
Rustomjee The Panorama At Pali Hill, Bandra West, Mumbai - Brochure.pdfmonikasharma630
 
How to Build Multifamily and Laneway Suites in Toronto!! (feat. Expert Archi...
How to Build Multifamily and Laneway Suites  in Toronto!! (feat. Expert Archi...How to Build Multifamily and Laneway Suites  in Toronto!! (feat. Expert Archi...
How to Build Multifamily and Laneway Suites in Toronto!! (feat. Expert Archi...Volition Properties
 
83770-87607 ۞Call Girls In Near The Park Hotel (Cp) Delhi
83770-87607 ۞Call Girls In Near The Park Hotel (Cp) Delhi83770-87607 ۞Call Girls In Near The Park Hotel (Cp) Delhi
83770-87607 ۞Call Girls In Near The Park Hotel (Cp) Delhidollysharma2066
 

Recently uploaded (20)

Call Girls In Mayur Vihar-1 Delhi ❤️8860477959 Good Looking Escorts In 24/7 D...
Call Girls In Mayur Vihar-1 Delhi ❤️8860477959 Good Looking Escorts In 24/7 D...Call Girls In Mayur Vihar-1 Delhi ❤️8860477959 Good Looking Escorts In 24/7 D...
Call Girls In Mayur Vihar-1 Delhi ❤️8860477959 Good Looking Escorts In 24/7 D...
 
Namrata 7 Plumeria Drive Pimpri Chinchwad Pune Brochure.pdf
Namrata 7 Plumeria Drive Pimpri Chinchwad Pune Brochure.pdfNamrata 7 Plumeria Drive Pimpri Chinchwad Pune Brochure.pdf
Namrata 7 Plumeria Drive Pimpri Chinchwad Pune Brochure.pdf
 
Call Girls in Pitampura Delhi 💯Call Us 🔝8264348440🔝
Call Girls in Pitampura Delhi 💯Call Us 🔝8264348440🔝Call Girls in Pitampura Delhi 💯Call Us 🔝8264348440🔝
Call Girls in Pitampura Delhi 💯Call Us 🔝8264348440🔝
 
Call Girls In Mundka Industrial Metro@꧂8447779280 ↬Enjoy ꧂Escort Service in ...
Call Girls In Mundka Industrial Metro@꧂8447779280 ↬Enjoy ꧂Escort Service in  ...Call Girls In Mundka Industrial Metro@꧂8447779280 ↬Enjoy ꧂Escort Service in  ...
Call Girls In Mundka Industrial Metro@꧂8447779280 ↬Enjoy ꧂Escort Service in ...
 
Call Girls In Vasundhara Ghaziabad ❤️8860477959 Low Rate Escorts Service In 2...
Call Girls In Vasundhara Ghaziabad ❤️8860477959 Low Rate Escorts Service In 2...Call Girls In Vasundhara Ghaziabad ❤️8860477959 Low Rate Escorts Service In 2...
Call Girls In Vasundhara Ghaziabad ❤️8860477959 Low Rate Escorts Service In 2...
 
Low Rate Call Girls in Akshardham Delhi Call 9990771857
Low Rate Call Girls in Akshardham   Delhi Call 9990771857Low Rate Call Girls in Akshardham   Delhi Call 9990771857
Low Rate Call Girls in Akshardham Delhi Call 9990771857
 
Call Girls in Kashmiri Gate Delhi 💯Call Us 🔝8264348440🔝
Call Girls in Kashmiri Gate Delhi 💯Call Us 🔝8264348440🔝Call Girls in Kashmiri Gate Delhi 💯Call Us 🔝8264348440🔝
Call Girls in Kashmiri Gate Delhi 💯Call Us 🔝8264348440🔝
 
Nanke Area Estate commercial ( Dir. Kat Kuo)
Nanke Area Estate commercial ( Dir. Kat Kuo)Nanke Area Estate commercial ( Dir. Kat Kuo)
Nanke Area Estate commercial ( Dir. Kat Kuo)
 
Call Girls In The Lalit New Delhi ❤️8860477959 Good Looking Escorts In 24/7 D...
Call Girls In The Lalit New Delhi ❤️8860477959 Good Looking Escorts In 24/7 D...Call Girls In The Lalit New Delhi ❤️8860477959 Good Looking Escorts In 24/7 D...
Call Girls In The Lalit New Delhi ❤️8860477959 Good Looking Escorts In 24/7 D...
 
Choose Noida's Leading Architect
Choose    Noida's    Leading   ArchitectChoose    Noida's    Leading   Architect
Choose Noida's Leading Architect
 
Call Girls in Nehru Place Delhi 💯Call Us 🔝8264348440🔝
Call Girls in Nehru Place Delhi 💯Call Us 🔝8264348440🔝Call Girls in Nehru Place Delhi 💯Call Us 🔝8264348440🔝
Call Girls in Nehru Place Delhi 💯Call Us 🔝8264348440🔝
 
Call Girls in Khan Market 9654467111 ESCORTS SERVICE
Call Girls in Khan Market 9654467111 ESCORTS SERVICECall Girls in Khan Market 9654467111 ESCORTS SERVICE
Call Girls in Khan Market 9654467111 ESCORTS SERVICE
 
SSPL The Strand Abodes Kharadi Pune Brochure.pdf
SSPL The Strand Abodes Kharadi Pune Brochure.pdfSSPL The Strand Abodes Kharadi Pune Brochure.pdf
SSPL The Strand Abodes Kharadi Pune Brochure.pdf
 
SVN Live 4.22.24 Weekly Property Broadcast
SVN Live 4.22.24 Weekly Property BroadcastSVN Live 4.22.24 Weekly Property Broadcast
SVN Live 4.22.24 Weekly Property Broadcast
 
Call Girls in Inderpuri Delhi 💯Call Us 🔝8264348440🔝
Call Girls in Inderpuri Delhi 💯Call Us 🔝8264348440🔝Call Girls in Inderpuri Delhi 💯Call Us 🔝8264348440🔝
Call Girls in Inderpuri Delhi 💯Call Us 🔝8264348440🔝
 
Purva Palm Hills Devanahalli, Bangalore E- Brochure.pdf
Purva Palm Hills Devanahalli, Bangalore E- Brochure.pdfPurva Palm Hills Devanahalli, Bangalore E- Brochure.pdf
Purva Palm Hills Devanahalli, Bangalore E- Brochure.pdf
 
The Omaxe State Dwarka Delhi-broucher.pdf.pdf
The Omaxe State Dwarka Delhi-broucher.pdf.pdfThe Omaxe State Dwarka Delhi-broucher.pdf.pdf
The Omaxe State Dwarka Delhi-broucher.pdf.pdf
 
Rustomjee The Panorama At Pali Hill, Bandra West, Mumbai - Brochure.pdf
Rustomjee The Panorama At Pali Hill, Bandra West, Mumbai - Brochure.pdfRustomjee The Panorama At Pali Hill, Bandra West, Mumbai - Brochure.pdf
Rustomjee The Panorama At Pali Hill, Bandra West, Mumbai - Brochure.pdf
 
How to Build Multifamily and Laneway Suites in Toronto!! (feat. Expert Archi...
How to Build Multifamily and Laneway Suites  in Toronto!! (feat. Expert Archi...How to Build Multifamily and Laneway Suites  in Toronto!! (feat. Expert Archi...
How to Build Multifamily and Laneway Suites in Toronto!! (feat. Expert Archi...
 
83770-87607 ۞Call Girls In Near The Park Hotel (Cp) Delhi
83770-87607 ۞Call Girls In Near The Park Hotel (Cp) Delhi83770-87607 ۞Call Girls In Near The Park Hotel (Cp) Delhi
83770-87607 ۞Call Girls In Near The Park Hotel (Cp) Delhi
 

Real Estate Board of Greater Vancouver Statistics Package September 2023.pdf