
Recommended
Recommended
More Related Content
What's hot
What's hot (20)
Similar to Elevation GPS comparison to SRTM Warwick, NY
Similar to Elevation GPS comparison to SRTM Warwick, NY (20)
Elevation GPS comparison to SRTM Warwick, NY
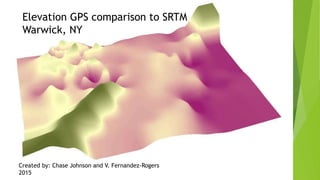
- 1. Elevation GPS comparison to SRTM Warwick, NY Created by: Chase Johnson and V. Fernandez-Rogers 2015
- 2. Stage One Design the project (scope, what is involved, helpers, equipment.) finding DEM data, land data, raster data, property, boundary data Find helpers Logistics (travel, date, Time) Program the GPS (downloading base maps, creating data dictionary.) Stage Two Gathering data three separate occasions Stage Three post processing comparing of data created maps Statistics Stage Four creating presentation presenting
- 6. Interpolated surface with data points SRTM grid with difference in elevation values
- 7. SRTM with GPS points SRTM raster with GPS point values and location, and statistics.
- 8. 3. Dr. Gorovich conducted his study in two large areas, Puckett and the Catskills mountains. The SRTM values are accurate enough for large area study where small variations in land elevation is not an issue. However, in small area study, where small elevation variance is needed, such as the one we did on 7 acres the SRTM values are not accurate enough. Conclusion: 1. The SRTM values are within the 10 meter accuracy that is expected. We observed an average of 4.35 M difference, average Standard Deviation of 2.93 2. Our results mirror Dr. Gorovich findings in his paper Accuracy assessment of the processed SRTM-based elevation data by CGIAR using field data from USA and Thailand and its relation to the terrain characteristics, Published in 2006 his average difference was 2.77 meters in the Catskill Mountains
- 9. Integration Google Earth Lab 1: Located the property using Google Maps. Georeferencing Raster Images Lab 2 :Georeferenced map of property GPS Lab3: Collected GPS points, post processed, created data dictionary, Created zones in map, downloaded map into GPS Creating spacial data from non-spacial data Lab 4 : Created Geodatabase, compared georeferenced map an overlayed map from the New York State clearinghouse tiles. Geoprocessing Lab 5: The clipping feature was used to clip the SRTM data to the property. Making lab 6: Joined tables from several layers. Use of DEM for terrain mapping using ARCGIS Lab 7: created surface map, created 3D visual using Arc Scene Landsat Imagery in GIS Lab 8: Worked with SRTM elevation data. Remote Sensing Data: practical applications, an example of basic GIS analysis Lab 9: Spacial joined attribute tables from SRTM data and GPS points calculated the elevation difference between the two. Calculated zonal statistics based on that data.