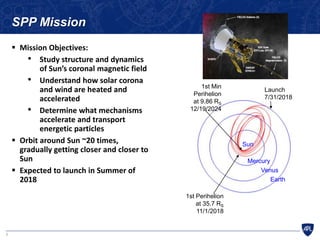
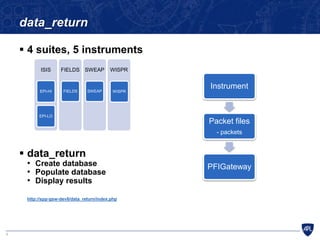
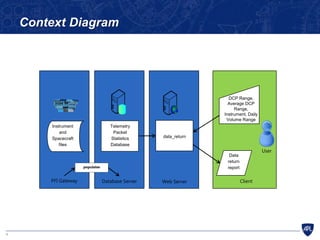
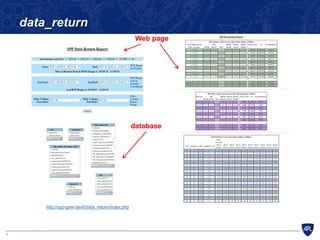
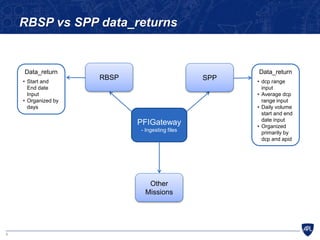
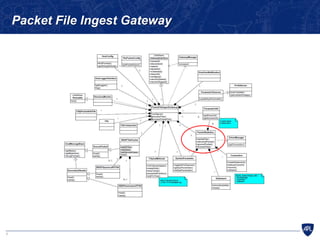
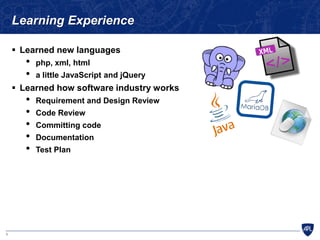
2. 2
SPP Mission
Mission Objectives:
• Study structure and dynamics
of Sun’s coronal magnetic field
• Understand how solar corona
and wind are heated and
accelerated
• Determine what mechanisms
accelerate and transport
energetic particles
Orbit around Sun ~20 times,
gradually getting closer and closer to
Sun
Expected to launch in Summer of
2018
Sun
Venus
Mercury
Earth
Launch
7/31/2018
1st Min
Perihelion
at 9.86 RS
12/19/2024
1st Perihelion
at 35.7 RS
11/1/2018
4. 4
Context Diagram
data_return
DCP Range,
Average DCP
Range,
Instrument, Daily
Volume Range
Data
return
report
Database Server Web Server Client
User
PFI Gateway
populates
Telemetry
Packet
Statistics
Database
Instrument
and
Spacecraft
files
6. 6
RBSP vs SPP data_returns
PFIGateway
- Ingesting files
RBSP SPP
Other
Missions
Data_return
• Start and
End date
Input
• Organized by
days
Data_return
• dcp range
input
• Average dcp
range input
• Daily volume
start and end
date input
• Organized
primarily by
dcp and apid
8. 8
Learning Experience
Learned new languages
• php, xml, html
• a little JavaScript and jQuery
Learned how software industry works
• Requirement and Design Review
• Code Review
• Committing code
• Documentation
• Test Plan
SPP has 5 science instruments categorized into 4 suites that collects data in packet files
Each file contains many packets (that are categorized by APIDS)
These files are ingested and parsed in the Packet File Ingest Gateway (PFIGateway)
Mission Ops (MOC) and Science Ops (SOC) want to know how much data is being recorded by the sc and its instruments, so my job was to create the data_return application (based off of RBSP’s).
Essentially 3 parts to creating data_return: creating database, populating database, and displaying results on web page
Created database using Maria DB
Used PFIGateway app to populate database
Wrote php scripts to display results on web page
Show web page
Front page – input
Allows user to pick which instruments want to see and if they want to see sc data or not
Also allows user to choose start and end dcp and displays the time period that the dcp range spans
Results will also show average amount of data per dcp and apid so can choose the average dcp range want to see
Lastly, user can choose the start and end date that will display daily volumes of data
Result page – 3 tables
green one is a summary table that shows user totals per dcp per instrument, and per suite if there is more than one instrument in a suite. Also shows user a science total and sc total if chosen on start page
Last two rows shows the average and grand totals per instrument, suite, science, and sc.
Purple table is a daily volume table that shows user totals per day per instrument. Just like green table, also shows user a science total and sc total if chosen on start page
Last two rows shows the average and grand totals per instrument, suite, science, and sc.
Blue table is the full table that shows user totals per apid per dcp. It also shows the average total based on what the chosen range was from the start page
Database has 6 tables: spacecraft, suite, instrument, dcp, cfdp_packet_file, and cfdp_packet_file_ingest_stats
cfdp_packet_file holds information for packet files
cfdp_packet_file_ingest_stats holds information for packets in packet files
RBSP has a data_return application just like SPP, but RBSP’s data_return is organized by days, and SPP’s data_return is primarily organized by dcp and apid. So the data_return app is pretty specific to its mission, but instrument and sc files from both missions are ingested through PFIGateway
Part of my job was I had to alter the PFIGateway to populate SPP’s database without breaking the way it populates RBSP’s database. I had to keep SPP and RBSP compatible – This was my biggest challenge
PFIGateway is a big application that is used by many different missions. I basically had to find the one class in the app that dealt with populating the database, tweak it so it populated the SPP database correctly, and make sure that my tweaking didn’t change the way it populates RBSP’s database or interfere with any other mission
This was definitely my biggest challenge. I had to understand which parts of the gateway was connected to data_return and change it without completely breaking functionality for other missions. It was also really hard to test and debug this because the Gateway is embedded in software called InControl and it can’t be run as a Java Application.