Thesis figures final
•
1 like•274 views

The document describes methods used to analyze tissue samples from tumor and heart experiments. It includes 15 figures showing staining and imaging results. Figure 1 shows quantification of tumor area in lung tissue. Figures 2-3 show quantification of proliferation and apoptosis markers in tumor tissue. Figures 4-6 show quantification of endothelial and epithelial markers. Figures 7-10 show imaging results from experiments on heart development in mouse embryos with VEGF overexpression. Figures 11-15 show results from experiments on VEGF knockdown in endothelial cells, including effects on autophagy, FOXO1 expression and rescue with FOXO1 knockdown. Supplemental figures provide additional imaging data from mouse embryos and hearts.

Recommended
Recommended
More Related Content
What's hot
What's hot (20)
Similar to Thesis figures final
Similar to Thesis figures final (20)
Thesis figures final
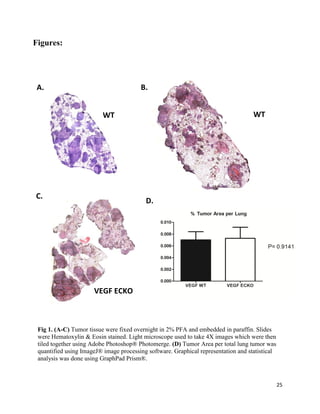
- 1. 25 Figures: Fig 1. (A-C) Tumor tissue were fixed overnight in 2% PFA and embedded in paraffin. Slides were Hematoxylin & Eosin stained. Light microscope used to take 4X images which were then tiled together using Adobe Photoshop® Photomerge. (D) Tumor Area per total lung tumor was quantified using ImageJ® image processing software. Graphical representation and statistical analysis was done using GraphPad Prism®. A. B. C. D. WT WT VEGF ECKO
- 2. 26 3 Fig 2. (A-B) Tumor tissue (a, VEGF WT, b: VEGF ECKO) were fixed overnight in 2% PFA and embedded in paraffin. Slides were stained using α-phosphohistone 3 antibody. Laser Confocal Microscope used to take 40X images. (C) Total number of PH3 positive nuclei over total nuclei in the tumor was quantified using ImageJ® image processing software. Graphical representation and statistical analysis was done using GraphPad Prism®. A. B. C.
- 3. 27 Fig 3. (A-B) Tumor tissue (a, VEGF WT, b: VEGF ECKO) were fixed overnight in 2% PFA and embedded in paraffin. Slides were stained using Upstate Biotechnology TUNEL apoptosis kit. Laser Confocal Microscope used to take 4x4 tiled 40X images. (C) Total number of apoptotic nuclei over total tumor area was quantified using ImageJ® image processing software. Graphical representation and statistical analysis was done using GraphPad Prism®. A. B. C.
- 4. 28 Fig 4. (A-B) Tumor tissue (a, VEGF WT, b: VEGF ECKO) were fixed overnight in 2% PFA and embedded in paraffin. Slides were co-stained using α-PECAM, α-NG2 antibodies . Laser Confocal Microscope used to take 3x3 tiled 40X images. (C-E) Expression of each marker over total tumor area was quantified using ImageJ® image processing software. Graphical representation and statistical analysis was done using GraphPad Prism®. A. B. C. D. E.
- 5. 29 Fig 5. (A-B)Tumor tissue (a, VEGF WT, b: VEGF ECKO) were fixed overnight in 2% PFA and embedded in paraffin. Slides were stained using α-E Cadherin antibody. Laser Confocal Microscope used to take 3x3 tiled 40X images. (C) Expression of N-Cadherin over total tumor area was quantified using ImageJ® image processing software. Graphical representation and statistical analysis was done using GraphPad Prism®. A. B. C.
- 6. 30 Fig 6. (A-B) Tumor tissue (a, VEGF WT, b: VEGF ECKO) were fixed overnight in 2% PFA and embedded in paraffin. Slides were stained using α-SNAIL antibody. Laser Confocal Microscope used to take 3x3 tiled 40X images. (C) Number of Nuclei positive for SNAIL over total number of nuclei in the tumor was quantified using ImageJ® image processing software. Graphical representation and statistical analysis was done using GraphPad Prism®. A. B. C.
- 7. 31 WT E12.5 Sm22:Cre+ Rosa-VEGF+ WT Sm22:Cre+ Rosa-VEGF+ E10.5 Fig 7. (A) E12.5 embryos were harvested from multiple litters and a comparison of the mutant (VEGF knock-in) animals shows possible hemorrhaging and retarded development, although most embryos looked relatively normal and alive at time of dissection (B) E10.5 embryo hearts were dissected under microscope and comparison showed no observable difference between the wildtype and VEFG knock-in animals. A. B.
- 8. 32 Fig 8. (A) Survival data of the SM22xVEGF line shows lethality by P1which reduced number of mutants observed starting E14.5. (B) Histology of SM22:VEGF++ and WT hearts shows a ventricular spetal defect and a thickening of the ventricular wall. (C) Whole mount images of SM22:VEGF++ and WT hearts at P0 show clear defect in both atria and the ventricles. (D) In one P0 mutant an abnormally large Flk-1+ vessel is observed as shown by histology and immunoflourescent staining. (E) Mutant heart size is on average slightly larger than WT. (F) Ventricular walls in mutant P0 hearts are approximately twice as thick as measured by ImageJ. VEGF WTSm22:VEGF+ + A. B. C. D. E. F.
- 9. 33 Fig 9. (A) Atrial defect observed in P0 SM22:VEGF++ hearts as compared to WT, mutant atria seem to have tumor like growth. (B) VEGF knock-in in cardiomycocytes increases cardiomyocyte density in atria of mutant animals as compared to WT, measured by comparing stained area per area of atria using ImageJ Software. (C) Atria of SM22:VEGF++ mutants are significantly larger that WT counterparts. (D) Histology shows a thinckening of the distal regions of the atria of SM22:VEGF++ P0 mutant hearts as compared to WT. (E) Immunoflourescent staining confirms the regions of atria and ventricules thickened in SM22:VEGF++ mutants are Troponing T positive. VEGF WT DAPI Trp T Sm22:VEGF++ VEGF WT A. D. E.VEGF WTSm22:VEGF++ A. B. C.
- 10. 34 E10.5 E12.5 E14.5 P0 Atrial Septum Flk-1+ Troponin T + Flk-1+ Troponin T + Flk-1+ Troponin T - Flk-1- Troponin T + Sionatrial Node (Data not shown in this report) Flk-1+ Troponin T + HCN4 + Flk-1+ Troponin T + HCN4 + Flk-1- Troponin T + HCN4 + Flk-1- Troponin T + HCN4 + Fig 10. (A) Immunoflourescent staining of WT hearts with Flk-1 (green) and cardiac Troponin T (blue) show a collocalization of Flk-1 and Troponin T in the atrail spetum in E12.5. The atrial sepctum is Flk-1 positive and Troponin T negative by E 14.5. By P0 the atrial septum is no longer Flk-1 positive. (B) Collocalization of Flk-1 and Troponin T in the atrial spetum and sionatrial node over various time points in development. Merged Flk-1 Troponin T E12.5E14.5P0 A. B.
- 11. 35 Fig 11. VEGF KD (knock down) is detrimental to HUVEC survival. (A) After siRNA knock- down of VEGF, mRNA levels were measured by qPCR and show drastic decrease of VEGF mRNA in the VEGF KD cells relative to scramble knock down. (B) Bright field microscopy shows a significant reduction in confluence of Human Umbilical Vein Endothelial Cells (HUVEC). (C) Cell survival as measured by confluence is significantly reduced in VEGF KD cells as compared to WT. (D) Viability assays with different treatments of VEGF shows that only intercellular VEGF can rescue the deletion phenotype. (E) Even differentiated cells ablated of VEGF with adeno-Cre induction lose cellular viability.
- 12. 36 Fig 12. (A) After siRNA knock-down of VEGF cells were stained with Cyto-ID ® autophagy die (green) and DAPI (white). Autophagosomes are labeled with yellow arrows. (B) Mean intensity after Cyto-ID staining shows significant increase in autophagy in VEGF KD cells. (C) Transition Electron Micrographs shows an increase number of autophagy vesicles in VEGF ECKO animals. A. B.A. C. .
- 13. 37 Fig 13. (A) Microarray on VEGF KD and WT cells shows a change in expression in target to transcription factor FOXO-1. (B) VEGF KD and Scrambled KD cells were stained with α- FOXO-1 antibody (green), Phalloidin (blue) and DAPI (white) (C-D) Total FOXO-1 levels and nuclear localization of FOXO-1 was quantified using ImageJ® image processing software. Graphical representation and statistical analysis was done using GraphPad Prism®. A. .
- 14. 38 Fig 14. Foxo1 is distinctly expressed by the endothelial layer in VEGF-ECKO mice. Adult Lung tissue were fixed overnight in 2% PFA and embedded in paraffin. Slides were stained using α-FOXO-1 antibody and amplified using TSA® amplification kit. Laser Confocal Microscope used to take 40X images.
- 15. 39 Fig 15. Removing FOXO-1 Rescues VEGF deletion phenotype. (A) Bright field microscopy of HUVECs with either Scrambled siRNA, VEGF siRNA, FOXO-1 siRNA, or VEGF+FOXO-1 siRNA shows a rescue of the cell viability phenotype by removing FOXO-1. (B) Quantification of Cell number from treatments in A. (C) The cells were stained using Cyto-ID autophagy die and quantified using ImageJ. Autophagy die A. B. C.
- 16. 40 Supplemental Figures: S.Fig 1. In the E 12.5 WT animals No Co-localization of Flk-1, HCN4, and Troponin T observed at sections preceeding the atriam septum and sinoatrial nodes.
- 17. 41 S. Fig 2. In the E 12.5 WT animals Co-localization of Flk-1, HCN4, and Troponin T is observed as the sections include parts of the atrial sepctum and the Troponin T DAPI Flk-1 HCN4
- 18. 42 Troponin T DAPI Flk-1 HCN4 S. Fig 3. In the E 12.5 WT animals Co-localization of Flk-1, HCN4, and Troponin T is not observed at the preferial regions of the atrial septum but only towards the center.
- 19. 43 S. Fig 4. In the E 12.5 WT animals Co-localization of Flk-1, HCN4, and Troponin T is observed in the simoatrial node. Troponin T DAPI Flk-1 HCN4
- 20. 44 S. Fig 5. In the E 10.5 WT animals Co-localization of Flk-1, HCN4, and Troponin T is observed in the simoatrial node. This staining was completed by Yasuhiro Nakashima who has colaborated with us on this project. HCN4 Troponin T Flk-1 DAPI
- 21. 45 S. Fig 6. E10 embryo harvest sheet. 3 sm22-Cre+ Rosa VEGF+ mutants out of a litter of 9. No obserable difference in the phenotypes. All embryos were alive during harvset.
- 22. 46 S. Fig 7.A E12 embryo harvest sheet. 14 sm22-Cre+ Rosa VEGF+ mutants out of a litter of 24. All embryos were alive during harvset except 19721 #3 which explains the retarded development. Possible hemoraging phenotype in 14 sm22-Cre+ Rosa VEGF+ mutants.
- 23. 47 S. Fig 7.B E12 embryo harvest sheet. 14 sm22-Cre+ Rosa VEGF+ mutants out of a litter of 24. All embryos were alive during harvset except 19721 #3 which explains the retarded development. Possible hemoraging phenotype in 14 sm22-Cre+ Rosa VEGF+ mutants.
- 24. 48 S. Fig 8 E14.5 embryo harvest sheet. 2 sm22-Cre+ Rosa VEGF+ mutants out of a litter of 8. All embryos were alive during harvset. No Observable difference in phenotype.
- 25. 49 Supplemental Figures: Sup. Fig 9. P0 mutant heart histology. After dissection, the hearts were fixed with 2% PFA overnight and then frozen in OCT. 8µm thick sections were cut using a cryostat and H&E staining was carried out. 10X pictures using light microscope were attached together using Photomerge application in Adobe Photoshop. Ventricular septal defect and ventricular and atrial wall thickening is observed.
- 26. 50 Sup. Fig 10. P0 WT heart histology. After dissection, the hearts were fixed with 2% PFA overnight and then frozen in OCT. 8µm thick sections were cut using a cryostat and H&E staining was carried out. 10X pictures using light microscope were attached together using Photomerge application in Adobe Photoshop.
- 27. 51 Sup. Fig 11. Histology of P0 mutant heart. After dissection, the hearts were fixed with 2% PFA overnight and then frozen in OCT. 8µm thick sections were cut using a cryostat and H&E staining was carried out. 10X pictures using light microscope were attached together using Photomerge application in Adobe Photoshop. Ventricular septal defect and ventricular and atrial wall thickening is observed.