Motion-Based Angiogenesis Analysis_A Simple Method to Quanitfy Blood Vessel Growth
•
1 like•87 views


Recommended
Recommended
More Related Content
What's hot
What's hot (19)
Similar to Motion-Based Angiogenesis Analysis_A Simple Method to Quanitfy Blood Vessel Growth
Similar to Motion-Based Angiogenesis Analysis_A Simple Method to Quanitfy Blood Vessel Growth (20)
Motion-Based Angiogenesis Analysis_A Simple Method to Quanitfy Blood Vessel Growth
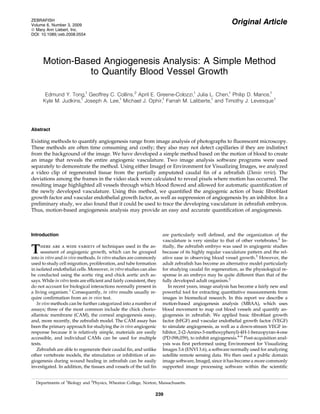
- 1. Original Article Motion-Based Angiogenesis Analysis: A Simple Method to Quantify Blood Vessel Growth Edmund Y. Tong,1 Geoffrey C. Collins,2 April E. Greene-Colozzi,1 Julia L. Chen,1 Philip D. Manos,1 Kyle M. Judkins,1 Joseph A. Lee,1 Michael J. Ophir,1 Farrah M. Laliberte,1 and Timothy J. Levesque1 Abstract Existing methods to quantify angiogenesis range from image analysis of photographs to fluorescent microscopy. These methods are often time consuming and costly; they also may not detect capillaries if they are indistinct from the background of the image. We have developed a simple method based on the motion of blood to create an image that reveals the entire angiogenic vasculature. Two image analysis software programs were used separately to demonstrate the method. Using either ImageJ or Environment for Visualizing Images, we analyzed a video clip of regenerated tissue from the partially amputated caudal fin of a zebrafish (Danio rerio). The deviations among the frames in the video stack were calculated to reveal pixels where motion has occurred. The resulting image highlighted all vessels through which blood flowed and allowed for automatic quantification of the newly developed vasculature. Using this method, we quantified the angiogenic action of basic fibroblast growth factor and vascular endothelial growth factor, as well as suppression of angiogenesis by an inhibitor. In a preliminary study, we also found that it could be used to trace the developing vasculature in zebrafish embryos. Thus, motion-based angiogenesis analysis may provide an easy and accurate quantification of angiogenesis. Introduction There are a wide variety of techniques used in the as- sessment of angiogenic growth, which can be grouped into in vitro and in vivo methods. In vitro studies are commonly used to study cell migration, proliferation, and tube formation in isolated endothelial cells. Moreover, in vitro studies can also be conducted using the aortic ring and chick aortic arch as- says. While in vitro tests are efficient and fairly consistent, they do not account for biological interactions normally present in a living organism.1 Consequently, in vitro results usually re- quire confirmation from an in vivo test. In vivo methods can be further categorized into a number of assays; three of the most common include the chick chorio- allantoic membrane (CAM), the corneal angiogenesis assay, and, more recently, the zebrafish model. The CAM assay has been the primary approach for studying the in vivo angiogenic response because it is relatively simple, materials are easily accessible, and individual CAMs can be used for multiple tests. Zebrafish are able to regenerate their caudal fin, and unlike other vertebrate models, the stimulation or inhibition of an- giogenesis during wound healing in zebrafish can be easily investigated. In addition, the tissues and vessels of the tail fin are particularly well defined, and the organization of the vasculature is very similar to that of other vertebrates.2 In- itially, the zebrafish embryo was used in angiogenic studies because of its highly regular vasculature pattern and the rel- ative ease in observing blood vessel growth.3 However, the adult zebrafish has become an alternative model particularly for studying caudal fin regeneration, as the physiological re- sponse in an embryo may be quite different than that of the fully developed adult organism.2 In recent years, image analysis has become a fairly new and powerful tool for extracting quantitative measurements from images in biomedical research. In this report we describe a motion-based angiogenesis analysis (MBAA), which uses blood movement to map out blood vessels and quantify an- giogenesis in zebrafish. We applied basic fibroblast growth factor (bFGF) and vascular endothelial growth factor (VEGF) to simulate angiogenesis, as well as a down-stream VEGF in- hibitor, 2-(2-Amino-3-methoxyphenyl)-4H-1-benzopyran-4-one (PD 098,059), to inhibit angiogenesis.4–6 Post-acquisition anal- ysis was first performed using Environment for Visualizing Images 3.6 (ENVI 3.6), a software normally used for analyzing satellite remote sensing data. We then used a public domain image software, ImageJ, since it has become a more commonly supported image processing software within the scientific Departments of 1 Biology and 2 Physics, Wheaton College, Norton, Massachusetts. ZEBRAFISH Volume 6, Number 3, 2009 ª Mary Ann Liebert, Inc. DOI: 10.1089=zeb.2008.0554 239
- 2. community.7 As shown in the Results and Discussion sections, similar results were obtained using ImageJ and ENVI. The MBAA method offers certain advantages over existing methods. In most in vivo angiogenesis assays, an angiograph is taken after the injection of a fluorescent agent or dye into the bloodstream of the experimental specimen before image analysis. More recently, investigators started to use transgenic zebrafish, which express enhanced green fluorescence protein in endothelial cells during vascular development to study an- giogenesis. This method is successful, but special transgenic zebrafish, such as fli:enhanced green fluorescence protein have to be used.8 Using MBAA, an image revealing any blood cell motion is produced without the administration of any agents to illuminate the vessels; in other words, a few red blood cells moving through a capillary allow the vessel to appear in the final image. The likelihood of obtaining an image of the entire regenerated vasculature in a given region for automatic quan- tification is much greater. Specific to investigations using zeb- rafish, the presence of pigments would not interfere with the analysis using MBAA. Consequently, there is no need to use the genetically altered transparent zebrafish or pretreatment with chemicals to prevent pigment development. Applying the same basic principle but using custom-made Analytical Language for Images programs, Schwerte and Pelster (2000) measured erythrocyte velocity, vessel diameter, blood distribution, and the development of peripheral vascular system in zebrafish embryos.9 Particle Image Velocimetry (PIV) is another technique that has been employed in analyzing blood flow velocity by investigators.10 The technique involves capturing sequential digital images that are taken from blood flowing through vessels that have been traced with markers on the timing scale of nanoseconds. A laser light source and a special camera are fitted to a fluorescent microscope allowing for computer analysis of the velocity of blood flow through the use of a timing system. There is a similarity between PIV and MBAA in utilizing sequential images of moving blood cells or other particles as a means to measure blood flow velocity in the former and blood vessel growth in the latter; however, PIV is too expensive a system to be modified to quantify angiogenesis. Materials and Methods Video acquisition Zebrafish (purchased from Aquatica Tropicals, Plant City, FL) were anesthetized in 100 mL water containing 200 mg=mL Tricaine (Sigma, St. Louis, MO). Using a Nikon C-W10xA=22 dissecting microscope, the three most ventral bones from the caudal fin were amputated with a razor blade anterior to the branching point. After recovering from anesthesia in fresh water, control fish were placed in fresh water tanks, while the experimental fish were placed into a solution of bFGF (8 mg=mL). After an exposure time of 1 h, the experimental fish were placed into fish tanks for 3 days. A second experiment was carried out in the same manner, using VEGF (12.5 ng) instead of bFGF. In this experiment, another group of zebra- fish was pretreated postamputation with the inhibitor PD 098,059 for 1 h before the application of VEGF. Using a Nikon C-W10xA=22 dissecting microscope, the three most ventral bones from the caudal fin were amputated with a razor blade anterior to the branching point. After recovering from anes- thesia in fresh water, control fish were placed in fresh water tanks, while the experimental fish were placed into a solution FIG. 1. Representative images of the experimental and control fish (oriented with anterior to the left) after each step of MBAA using ImageJ software. Micrographs of lower ventral region of zebrafish caudal fin of experimental (A) exposed to bFGF (8 mg=mL) imaged 3 days postamputation (3 dpa) and control (B) exposed to no angiogenic stimulator. (C) and (D) Eight-bit grayscale images of (A) and (B) after loading video clip into ImageJ software. (E) and (F) Com- posite images of (C) and (D) that combined the slices of the video clip revealing only the vascular bed in white due to the movement of blood cells. (G) and (H) Images after threshold was applied to eliminate detection noise. (I) and (J) Final images of (G) and (H) with only area of new vascular growth outlined. Area of the new vasculature was quantified and reported in pixels2 (control: 39,072; experimental: 85,649). Point of amputation has been indicated by orange arrows. MBAA, motion-based angiogenesis analysis; bFGF, basic fi- broblast growth factor. (To view color image, go to www. liebertonline.com). 240 TONG ET AL.
- 3. of PD 098,059 (20 mM) for 1 h. The fish were then transferred to a solution of VEGF (12.5 ng) for an additional hour, and subsequently placed into fish tanks for 3 days. To analyze the amount of vessel growth 3 days postam- putation (dpa), each fish was first anesthetized in 100 mL water containing 200 mg=mL Tricaine (Sigma). The angiogenic response was viewed at 40Âusing a Nikon Eclipse E200 mi- croscope. When blood flow was stabilized after the initial ef- fect of anesthesia, a Sony DFW–x700 camera was used in conjunction with BTV Pro software to record a 16 bit short video (1024Â768 pixels) lasting 2–4 s. Analysis using ImageJ The video clip was exported into ImageJ as a ‘‘Plugin.’’ The video clip was converted into image stacks (slices) resulting in an 8-bit grayscale image. The slices were merged by means of standard deviation (SD). The best merged image was achieved with stack sizes ranging from 5 to 10 slices. This range provided the most optimized images that had minimal back- ground noise, without the loss of image detail. Consequently, a composite image of the vascular bed in white was produced after the blood vessels were illuminated due to the movement of blood cells, while the background remained black. A threshold was then applied to eliminate background noise caused by either fish movements or debris. Threshold values were determined using the following parameters obtained from the histogram of each merged image: mean (XX), maxi- mum, and SD of pixel densities within the area of regenera- tion. The maximum setting was kept the same, while the minimum was set to a formula (1.5ÂSD) þ XX, which excluded any pixel value below this threshold from quantification. This formula is specific for the settings and conditions within our lab, and values may differ depending on experimental pro- tocol and image acquisition=processing settings. The area, which contained the new vascular growth from the point of amputation, was then outlined with the polygon selection tool. Finally, the total area of the new vasculature was quan- tified and reported in pixels. Although ImageJ could be used to convert pixels to micrometers, we present our data in this report in pixels. Other possible improvements to the threshold processing are addressed in the Results and Discussion sec- tions. Analysis using ENVI 3.6 Using ENVI 3.6 the video clip was exported at a rate of 29.97 frames per second as TIFF files. The TIFF files were subsequently imported to ENVI. The number of TIFF files depended on the length of the video. A sequence of 20 colored-frame TIFF files was saved as ENVI files. Only the red spectrum (channel) was selected, creating 8-bit grayscale images. These frames were then merged based on the SD of the pixel densities between the frames. This resulted in a com- posite image that illuminated the moving blood through all blood vessels. Once a threshold was applied and standard- ized for each image to eliminate background noise, the area of new vascular growth from the amputation point was out- lined. Measurements of mean (XX) and SD of pixel values were taken within the area of regeneration. A value derived from the addition of one SD to the mean (d þ XX) was used as the minimum threshold value. After the threshold was applied, FIG. 2. Representative images of the experimental and control fish (oriented with anterior to the left) after each step of MBAA using Environment for Visualizing Images (ENVI) 3.6. Lower ventral region of zebrafish caudal fin of experi- mental (A) exposed to bFGF (8 mg=mL) imaged 3 days postamputation (3 dpa) and control (B) exposed to no an- giogenic stimulator. (C) and (D) Grayscale images of (A) and (B), respectively, after saving as ENVI files with only red spectrum. (E) and (F) Composite images, revealing only the vascular bed in white due to movement of blood, summing the standard deviation of pixel densities of (C) and (D). (G) and (H) Images after threshold was applied to eliminate detection noise (red). (I) and (J) Final images highlighting the newly developed blood vessels (blue) after selecting area of new vasculature from point of amputation. Area of the new vasculature was quantified and reported in pixels2 (control: 5613; experimental: 12,209). Point of amputation has been indicated by orange arrows. (To view color image, go to www.liebertonline.com). MOTION-BASED ANGIOGENIC ANALYSIS 241
- 4. only the pixel values above the threshold range were high- lighted. Consequently, the area of new blood vessel growth was selected and pseudocolored blue. This area of new vas- culature was then quantified and reported in pixels2 . Results The new blood vessels in the regenerated caudal fin are scarcely visible in the initial images (Figs. 1A, B and 2A, B) before any image processing was applied. In contrast, one is able to highlight the vasculature for better observation after applying a threshold to eliminate background=detection noise (Figs. 1E, F and 2E, F). All the new blood vessels, in- cluding those that are not clearly visible in the initial im- age, appear vividly after processing a video of the specimen through ImageJ (Fig. 1I, J) or ENVI (Fig. 2I, J). All blood vessels are illuminated in white and can easily be distinguished from all other tissue in the caudal fin of the zebrafish, which ap- pears black. Further, the area of angiogenesis from the point of amputation was outlined using ImageJ (Fig. 1I, J) or high- lighted in blue using ENVI (Fig. 2I, J). In both ImageJ and ENVI, the area of new vasculature was expressed in pixels2 for a more quantitative comparison. Using ImageJ, the area in the control was 5613 pixels2 (Fig. 1I), while that of the experimental exposed to bFGF was 12,209 pixels2 (Fig. 1J). Using ENVI, the area of new vasculature in the same control was 39,072 pixels2 (Fig. 2I), and that of the same ex- perimental was 85,649 pixels2 (Fig. 2J). Although the numerical values between the two programs are different, the ratio of the number of pixels is the same. In ImageJ, the pixel area of the experimental is 2.19 times that of the control; in ENVI, the number of pixels of the experimental is 2.17 times the control. The ratio between these two programs is 1:1, suggesting that the process is consistent between ImageJ and ENVI. The dif- ference in the absolute pixel values is due to a discrepancy in the number of pixels per unit area between the two programs. Figure 3 shows our preliminary study using MBAA to trace the vasculature in the zebrafish embryo. The blood vessels in the initial images in the head region (A) and the tail region (B) of a 72 hours postfertilization unanesthetized zebrafish embryo were highlighted in red after MBAA (C and D, re- spectively). The vasculature in the head region is not visible because the tissue in this region is too thick. Using ENVI as the software in MBAA to quantify angio- genesis, the proangiogenic effects of bFGF were used as one example to demonstrate the effectiveness of this new method. As seen in Figure 4, there was a statistically significant in- crease in average area of new vascular growth in the experi- mental group compared to the control group. Using ImageJ as the software in MBAA to quantify angiogenesis, the proan- giogenic effects of VEGF were used as another example. In addition, inhibition of angiogenesis by PD 098,059 pretreat- ment before VEGF application was also demonstrated. As shown in Figure 5, there is a statistically significant difference FIG. 3. Micrographs of the head region (A) and the tail region (B) of a 72 hours postfertilization zebrafish embryo (anterior to the left). (C, D) Final images of the same regions with the vasculature highlighted in red after MBAA analysis using ImageJ. FIG. 4. After exposing zebrafish to a solution of bFGF (8 mg=mL) for 1 h, a statistically significant increase in area of new vascular growth during wound healing angiogenesis in the caudal fin was observed ( p 0.05, two-sample T-test). Image analysis was performed using ENVI. Statistical anal- ysis was performed using two-sample T-test, and data are presented as mean number of pixels2 with standard error (SE). The experimental group demonstrated a significantly larger area (39,417 pixels2 ; n ¼ 16), compared to the aver- age area of the control group (9259 pixels2 ; n ¼ 12). FIG. 5. After exposing zebrafish to a solution of vascular endothelial growth factor (VEGF; 12.5 ng=mL) for 1 h, a sta- tistically significant increase in area of new vascular growth during wound healing angiogenesis in the caudal fin was observed ( p 0.05, two-sample T-test). The angiogenic effect of VEGF is inhibited by 1 h pretreatment with the inhibitor PD098,059 (10 mM). Analysis was performed using ImageJ, and data are presented as number of pixels2 . The VEGF group demonstrated a larger area (49,516 pixels2 ) compared to the average area of the water control group (25,924 pixels2 ), while the average of the inhibitor pretreatment group was lower than both groups (43,297 pixels2 ). 242 TONG ET AL.
- 5. between the angiogenic effects of the control and VEGF- treated zebrafish. Due to the small sample size of the PD 098,059 pretreated zebrafish, there is no statistically signifi- cant difference between this group and the other two groups. Discussion Although ENVI was first used in the development of the MBAA method, ImageJ was found to be a more efficient video=image-processing software. In addition, ImageJ is free and widely used. Thus, it will be the focus of the following discussion. If the composite image does not provide enough contrast, it is most likely due to an inadequate recording of the original videos. This is possibly caused by fish movement or stage disturbance during the video recording. It may also be due to video processing or inconsistent microscope settings. These disturbances do not necessarily produce an image with false-positives (inaccurate blood vessel detection), but in- stead, simply do not produce any composite image that can be analyzed. The noise trouble can sometimes be managed by altering the number of frames used to create the composite image. By combining less stacks (5–10 frames) or using a different sequence of stacks within the video that are of higher quality (periods where there may be no disturbances), the composite image could be made clearer and further proces- sing becomes possible. However, a minimum of five frames are necessary to show the difference among the frames, and to gain a composite image with enough contrast to effectively highlight the blood vessels. To obtain accurate and consistent data from the videos, it is important to standardize every aspect of the recording and to use a constant method to establish the threshold. It is most important to maintain a consistent light intensity while avoid- ing any glare. Any moving water or fish movement may alter the light intensity or cause glare, which interferes with the im- age processing and affects quantification. In addition to what is mentioned in the Materials and Methods section for this study, there are other ways to better standardize the imaging process. One possible alternative would be to first create a standard histogram (e.g., designating the mean to be 128 and the SD to be 10 on the histogram). The greater the SD between pixel values among frames, the more distinct the blood vessels will appear in the composite image. All of the images would then be stretched to fit the standard histogram by adjusting the average bright- ness (mean) and contrast (SD). By normalizing the brightness among frames, the threshold can be set at a constant value that best highlights the blood vessels, such as SD ¼ 3 or SD ¼ 4. Although measuring the total area of a particular vascular bed was the only parameter quantified in this study, it is only one aspect of the image analysis that may be performed. Many other parameters can be calculated in both ImageJ and ENVI by uploading any specific macro program to expand the versa- tility of the MBAA method. For example, vessel length and number of branching points could be measured. In our pre- liminary study using the zebrafish embryo, we have demon- strated that the method can be used to study the vasculature during embryonic development. However, one limitation of this method also became evident. When the sample is too thick, MBAA cannot be used to estimate blood vessel growth. Nevertheless, in two major angiogenesis models, the CAM model and the cornea model, the thickness of the sample should not be a problem. We plan to expand the application of this simple method to the chick CAM model and the rabbit cornea model to study angiogenesis. Further, although ImageJ and ENVI software were used in this study, any image- processing software would most likely be able to perform the analysis. The precise protocols of the software may vary slightly, but the basic approach remains the same. Finally, the numerous steps described in image processing could be auto- mated with an appropriate Plugin or Macro program. Acknowledgments We would like to thank the following persons for their support and assistance throughout this project: Erin Post and Beth Amaral for animal care, and Dr. Chris Kalberg for tech- nical advising. The research was supported by Wheaton Foundation Grant, Hood Faculty=Student Summer Research Fellowship, Melon Faculty=Student Summer Research Fel- lowship, Wheaton Trustee Scholarship, Wheaton Community Scholarship, and Wheaton Research Partnership. Disclosure Statement No competing financial interests exist. References 1. Auerbach R, Lewis R, Shinners B, Kubai L, Akhtar N. An- giogenesis assays. Clin Chem 2003;49:32–40. 2. Bayliss P, Bellavance K, Whitehead G, Abrams J, Aegerter S, Robbins H, et al. Chemical modulation of receptor signalling inhibits regenerative angiogenesis in adult zebrafish. Nat Chem Biol 2006;2:265–273. 3. Childs S, Chen J, Garrity D, Fishman M. Patterning of an- giogenesis in the zebrafish embryo. Development 2002;129: 973–982. 4. Alessi D, Cuenda A, Cohen P, Dudley D, Saltiel A. PD 098,059 is a specific inhibitor of the activation of mitogen- activated protein kinase in vitro and in vivo. J Biol Chem 1995;46:27489–27494. 5. Folkman J. Tumor Angiogenesis. In: Vande Woude G, Klein G, Weinhouse S (eds) Advances in Cancer Research. Aca- demic Press, New York, NY, 1985, pp. 175–199. 6. Ferrara N, Davis-Smyth T. The biology of vascular endo- thelial growth factor. Endocr Rev 1997;18:4–25. 7. Rasband W. ImageJ. U.S. National Institutes of Health, Bethesda, Maryland 1997–2008. http:==rsh.info.nih.gove=ij=. 8. Lawson N, Weinstein B. In vivo imaging of embryonic vas- cular development using transgenic zebrafish. Dev Biol 2002;248:307–318. 9. Schwerte T, Pelster B. Digital motion analysis as a tool for analyzing the shape and performance of the circulatory sys- tem in transparent animals. J Exp Biol 2000;203:1659–1669. 10. Vennemann P, Kiger K, Lindken R, Groenendijk C, Stekelenburg-de Vos S, ten Hagen T, et al. In vivo micro particle image velocimetry measurements of blood-plasma in the embryonic avian heart. J Biomech 2006;39:1191–1200. Address correspondence to: Edmund Y. Tong, Ph.D. Department of Biology Wheaton College 26 East Main St. Norton, MA 02766 E-mail: etong@wheatoncollege.edu MOTION-BASED ANGIOGENIC ANALYSIS 243