
Recommended
Recommended
More Related Content
What's hot
What's hot (11)
Similar to Crandall-em trauma
Similar to Crandall-em trauma (20)
More from UFJaxEMS
More from UFJaxEMS (20)
Recently uploaded
Recently uploaded (20)
Crandall-em trauma
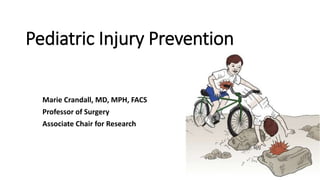
- 1. Pediatric Injury Prevention Marie Crandall, MD, MPH, FACS Professor of Surgery Associate Chair for Research
- 2. 2 Overview of Injuries in Childhood • Unintentional injuries are the leading cause of death in children from 1 - 21 years of age in the U.S. • Each year, 20-25% of children sustain an injury requiring medical attention, missed school, and/or bedrest • Leading cause of childhood medical spending in U.S.
- 3. Average Day in U.S. • > 80,000 injuries resulting in hospitalizations and ED visits; >28,000 in kids 0-19 y.o. • > 400 deaths due to injuries; > 50 in kids 0-19 y.o. Source: National Center for Injury Prevention and control, 2008
- 4. Childhood Injuries - Deaths 0 10 20 30 40 50 60 70 80 90 1-4 yr 5-9 yr 10-14 yr 15-19 yr 1955 1967 1988 1998 2001 2006 % total mortality Source: National Center for Injury Prevention and Control, 2008
- 5. Mortality after Pediatric Trauma Admissions 0 0.5 1 1.5 2 2.5 3 3.5 4 <1 1 2 3 4 5 6 7 8 9 10 11 12 13 14 15 16 17 18 19 Age % NTDB Pediatric Annual Report, 2009
- 6. Functional Outcomes after Trauma Children • 10-25% with severe injuries have functional limitations • 30% of LE fracture and 15% of UE fracture have physical limitations at 12 mos. • 2% of mild TBI, 50% of moderate TBI and >90% of severe TBI have disability • 20% of children and 40% of adolescents have signs of PTSD Adults • 50% are not back to work at 1 year • 35% report health as fair-poor at 1 year • 40% of elderly have difficulty walking • No effect of TC care on functional outcomes in TBI or elderly • 40% of adults have PTSD sxs at one year
- 7. Injury Pyramid Deaths 147,891 ______________ Hospital discharges 2,591,000 ____________________________ Emergency department visits 36,961,000 ________________________________________ Episodes of injuries reported 59,127,000 1/18 1/14 2/3 |------------------------------- | | | 1/400 | | | | | |-------
- 8. U.S. Death Rates for Infections and Injuries, Ages 1-19 Injuries
- 9. Why has there been success in other areas of child health versus injuries? • Increase in new knowledge and development of new technologies has been responsible for most of the advances and gains in life expectancies. • Efforts to improve health systems and policies have been central to success in these other diseases • Increases in life expectancies increased incomes and GDP
- 10. Resources for injury control YLL DALYs WHO reg. $ WHO extra $ Communicable disease & maternal, perinatal and nutritional conditions 54% 41% 68% 91% Non-communicable dis. 33% 47% 31% 8% Injuries 13% 12% <1% <1% Lopez, The Lancet Nov 2008
- 11. 11 Basics of Injury Prevention • INJURIES ARE NOT ACCIDENTS • Injuries are often understandable, predictable, and preventable • Specific injuries share similar characteristics of person, place , and time • By understanding injuries, interventions can be developed and implemented to prevent or limit the extent of a given injury
- 12. 12 Strategies for Prevention Intervention or countermeasures are classified based on requirements for behavior change • Active - rely on actions taken by an individual (e.g. keeping firearms in locked cabinets) • Passive - do not rely on the efforts of an individual to be successful (restricting access to firearms)
- 13. 13 Methods of prevention: “The Three Es” • Engineering • Environmental change • Education
- 14. Bicycles • 700-900 people die in bicycle-related injuries each year in the United States • The majority of bicycle injuries occur in children less than 15 years old • 90% of patients killed in bicycle crashes were not wearing helmets
- 15. Why Wear a Helmet? • The skull is less than a ¼ inch thick. • You do not need to be going fast or fall far to injure the brain. • Children riding a tricycle should wear a helmet. • Bicycles are not toys, and should be considered a child’s first vehicle.
- 16. Bicycle Injury Prevention Research Helmets provide a 63% to 88% reduction in the risk of head, brain and severe brain injury for all ages of bicyclists.
- 17. Bicycle Injury Prevention Research 18% reduction in head injury crashes among children versus adults who were not subject to the law.
- 18. Bicycle Injury Prevention Research Racial disparities in helmet use; little effect if no primary enforcement.
- 19. Pediatric Firearm Injury Statistics • 30,000+ firearm-related deaths/year in the United States • 12,000 homicides, 20,000 suicides • 110,000 firearm injuries that are brought to medical or legal attention
- 20. Pediatric Firearm Injury Statistics • 4 children killed daily by guns • 50 injured seriously • 40% American households have guns • 1.7 million children live with unlocked/loaded guns in the home (that’s 40% of the 40%) • 75% of kids know where “hidden” guns are in the home
- 21. Firearm Injury Prevention Research 7-40% reduction in firearm related injuries in states with stricter licensing. No effect with concealed carry laws.
- 22. Firearm Injury Prevention Research 13% reduction in firearm suicides.
- 23. Firearm Injury Prevention Research Unlocked, loaded weapons much more likely to be associated with youth firearm injuries and suicides.
- 24. Firearm Injury Prevention Research Firearm injury admissions much more common in states with lenient gun laws.
- 25. Firearm Injury Prevention Research Guns 2x as likely in the homes of suicide victims as in homes of suicide attempters.
- 26. Restraints
- 27. 10 year old Male • Back seat passenger • Wearing lap belt ONLY • MVC going 40 mph • No LOC, no vomiting • ABCs intact • GCS 15 • + Seatbelt Sign • Right hip TTP
- 29. 3 year old Female • Sitting in aunt’s lap in backseat • MVC at 40 mph • + LOC • GCS 9 at scene • In trauma center: • Intubated • Bradycardic • Hypertensive
- 31. Motor Vehicle Crashes • LEADING CAUSE OF CHILD DEATH • Car seats reduce risk of injury and fatality • Especially in infants & toddlers • Up to 7 out of every 10 children are improperly restrained
- 32. AAP 2011 Recommendations Age Restraint Up to 2 years Rear-facing car seat Up to 4 years Forward-facing car seat Up to 8 years Belt-positioning booster seat Outgrown Booster Seat Lap-and-shoulder seat belts Up to 13 years Ride in the back seat
- 34. Clear as Crystal? Clear as Mud? • www.healthychildren.org • www.nhtsa.org • www.safekids.org
- 35. Car Seat Programs • Car Seat Screening Programs • ED/Trauma • Primary Care • Child Passenger Safety (CPS) Certification • Community
- 36. Falls
- 37. 7 year old Female • Playing at park after school • On the monkey bars • Fell on outstretched arm
- 39. Fall out of two story window • 5 year old boy • History ADHD • Beautiful 70 degree sunny day
- 41. Falls Leading cause of non fatal injury for children 0-19 years (CDC) 8,000 ED visits every day Leading cause of hospitalization for ages < 14 years
- 42. While Playing • Playground Deisgn - woodchips or sand (no dirt, concrete, grass) • Helmets – inline skating, skateboarding, bicycle, ATV, dirt bike • Supervision
- 43. Home • Window guards and/or stops (screens keep bugs out) • Move furniture away from windows (kids climb up) • Stair gates • Secure young children when seated • Never leave children alone in shopping carts
- 44. Burns
- 47. Scald Burns • Younger children • Traditional Counseling: Set hot water temperature at 120 degrees F • Closer monitoring in high risk areas (kitchen, bath) • Safety gates around fireplaces, ovens, furnaces • Cooking safety • Deep child safe distance away • Avoid carrying /holding child while cooking • Turn pot handles away from the edge • Close, snug-fitting clothes
- 49. Flame burns • Older Children • Fire extinguishers on every level • Every room with potential for open flame • Space heaters, kerosene heaters • Stop, drop, roll
- 50. 2/3 of household fire deaths in homes without smoke detectors or without working smoke detectors Dual smoke detector/carbon monoxide alarms preferred
- 51. Smoke Detectors Test Once a MonthTest Replace Battery Once a YearReplace Replace Detector Every 10 years (or per manufacturer)Replace Place on every floor, outside each sleeping area and inside each bedroomPlace on
- 52. Are injury prevention programs effective? • Cochrane Reviews • School-based programs • Parenting Interventions • Bicycle safety programs
- 54. Resources • www.injuryfree.org • www.healthychildren.org • www.nhtsa.org • www.safekids.org