Downloaded 212 times


The document discusses optimizing Apache Kafka for high throughput and low latency in production environments, highlighting the necessity of collaboration between developers and SREs to troubleshoot performance issues. Key areas of focus include hardware and software configurations, monitoring crucial metrics, ensuring message throughput, and appropriately sizing topics. It emphasizes proactive measures and proper cluster scaling to avoid operational challenges and improve system reliability.
Introduction to presenters Todd Palino and Gwen Shapira, their roles at LinkedIn and Confluent.
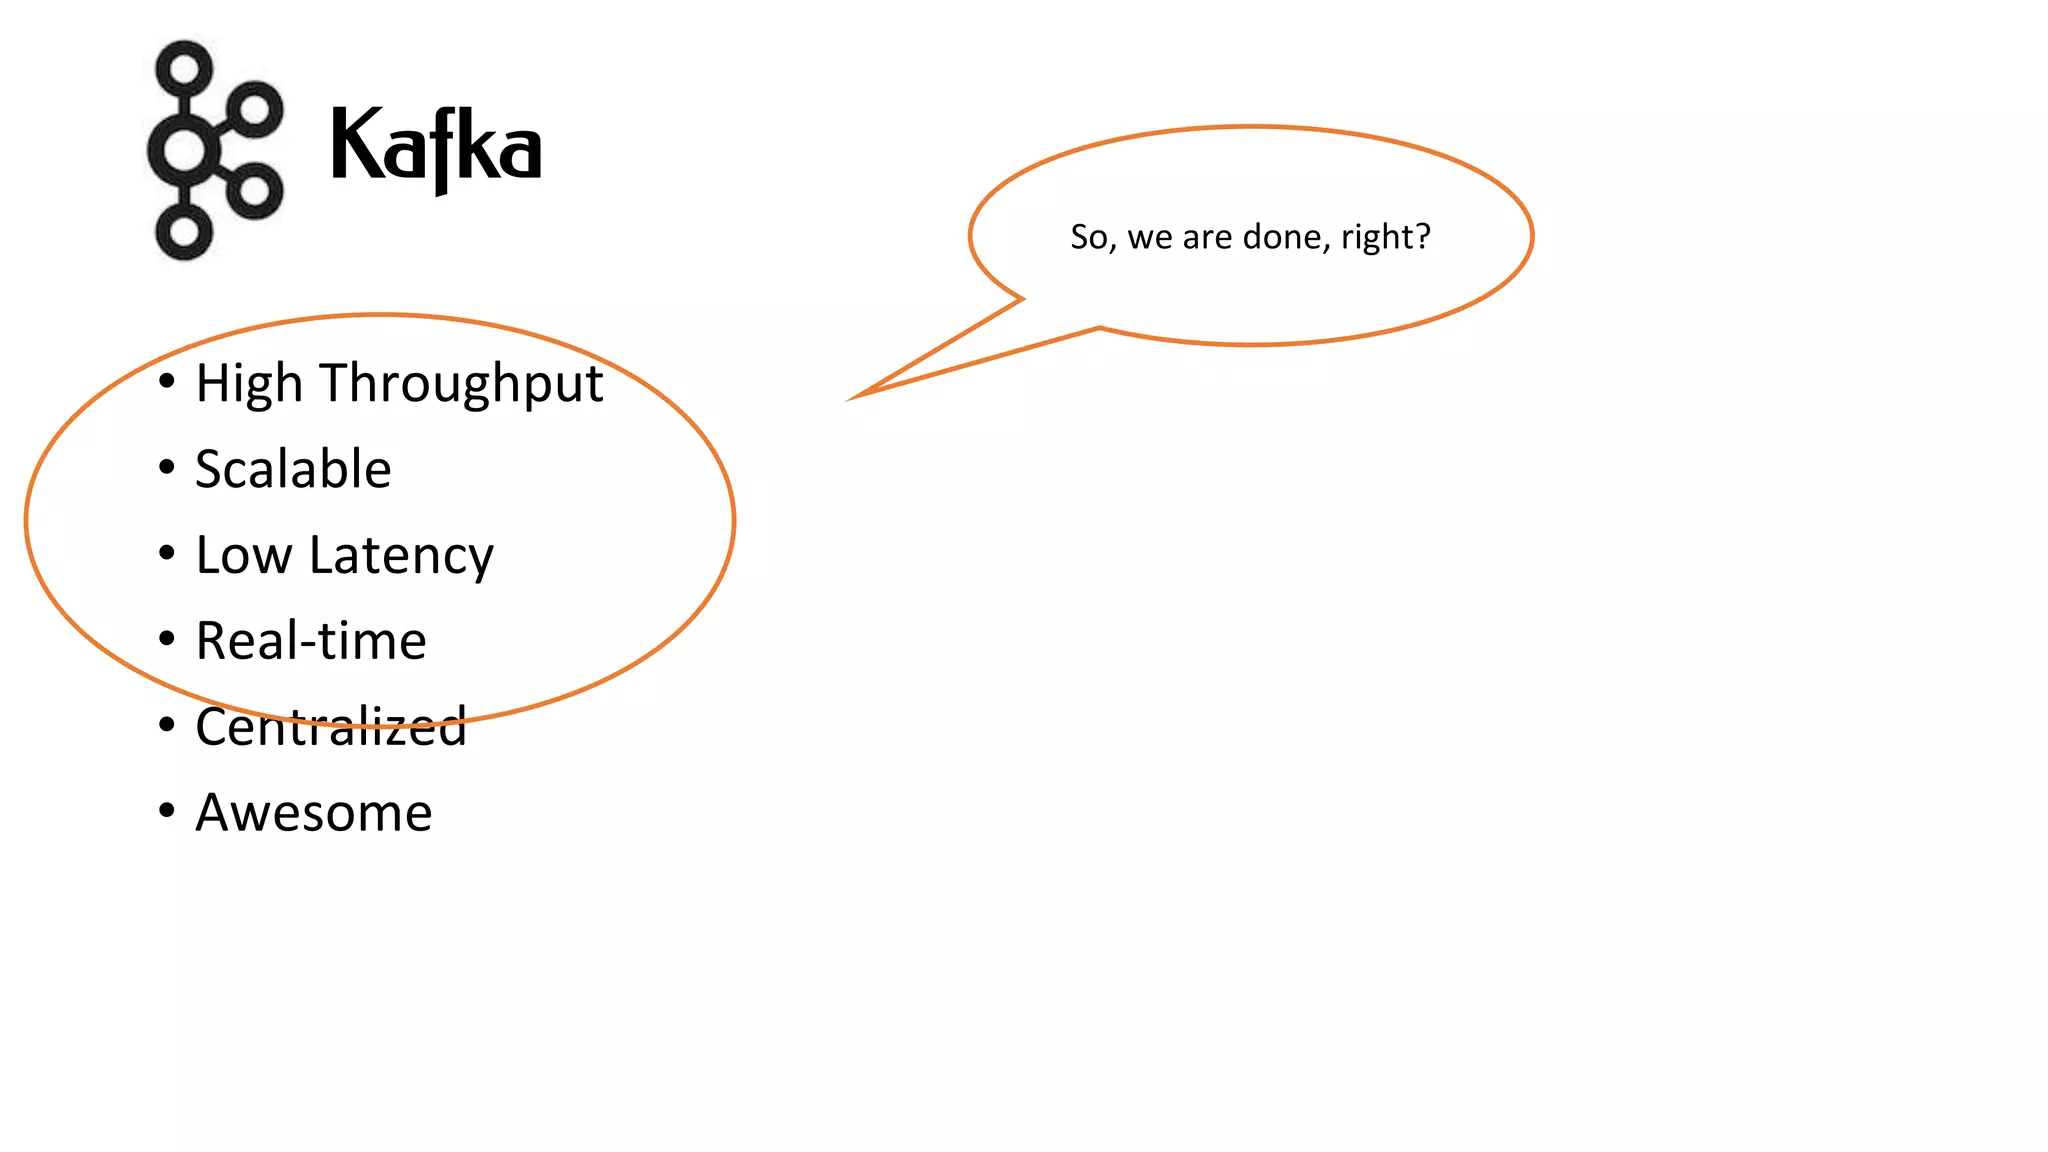
Discusses the availability of a book about Kafka and addresses common concerns regarding Kafka's performance.
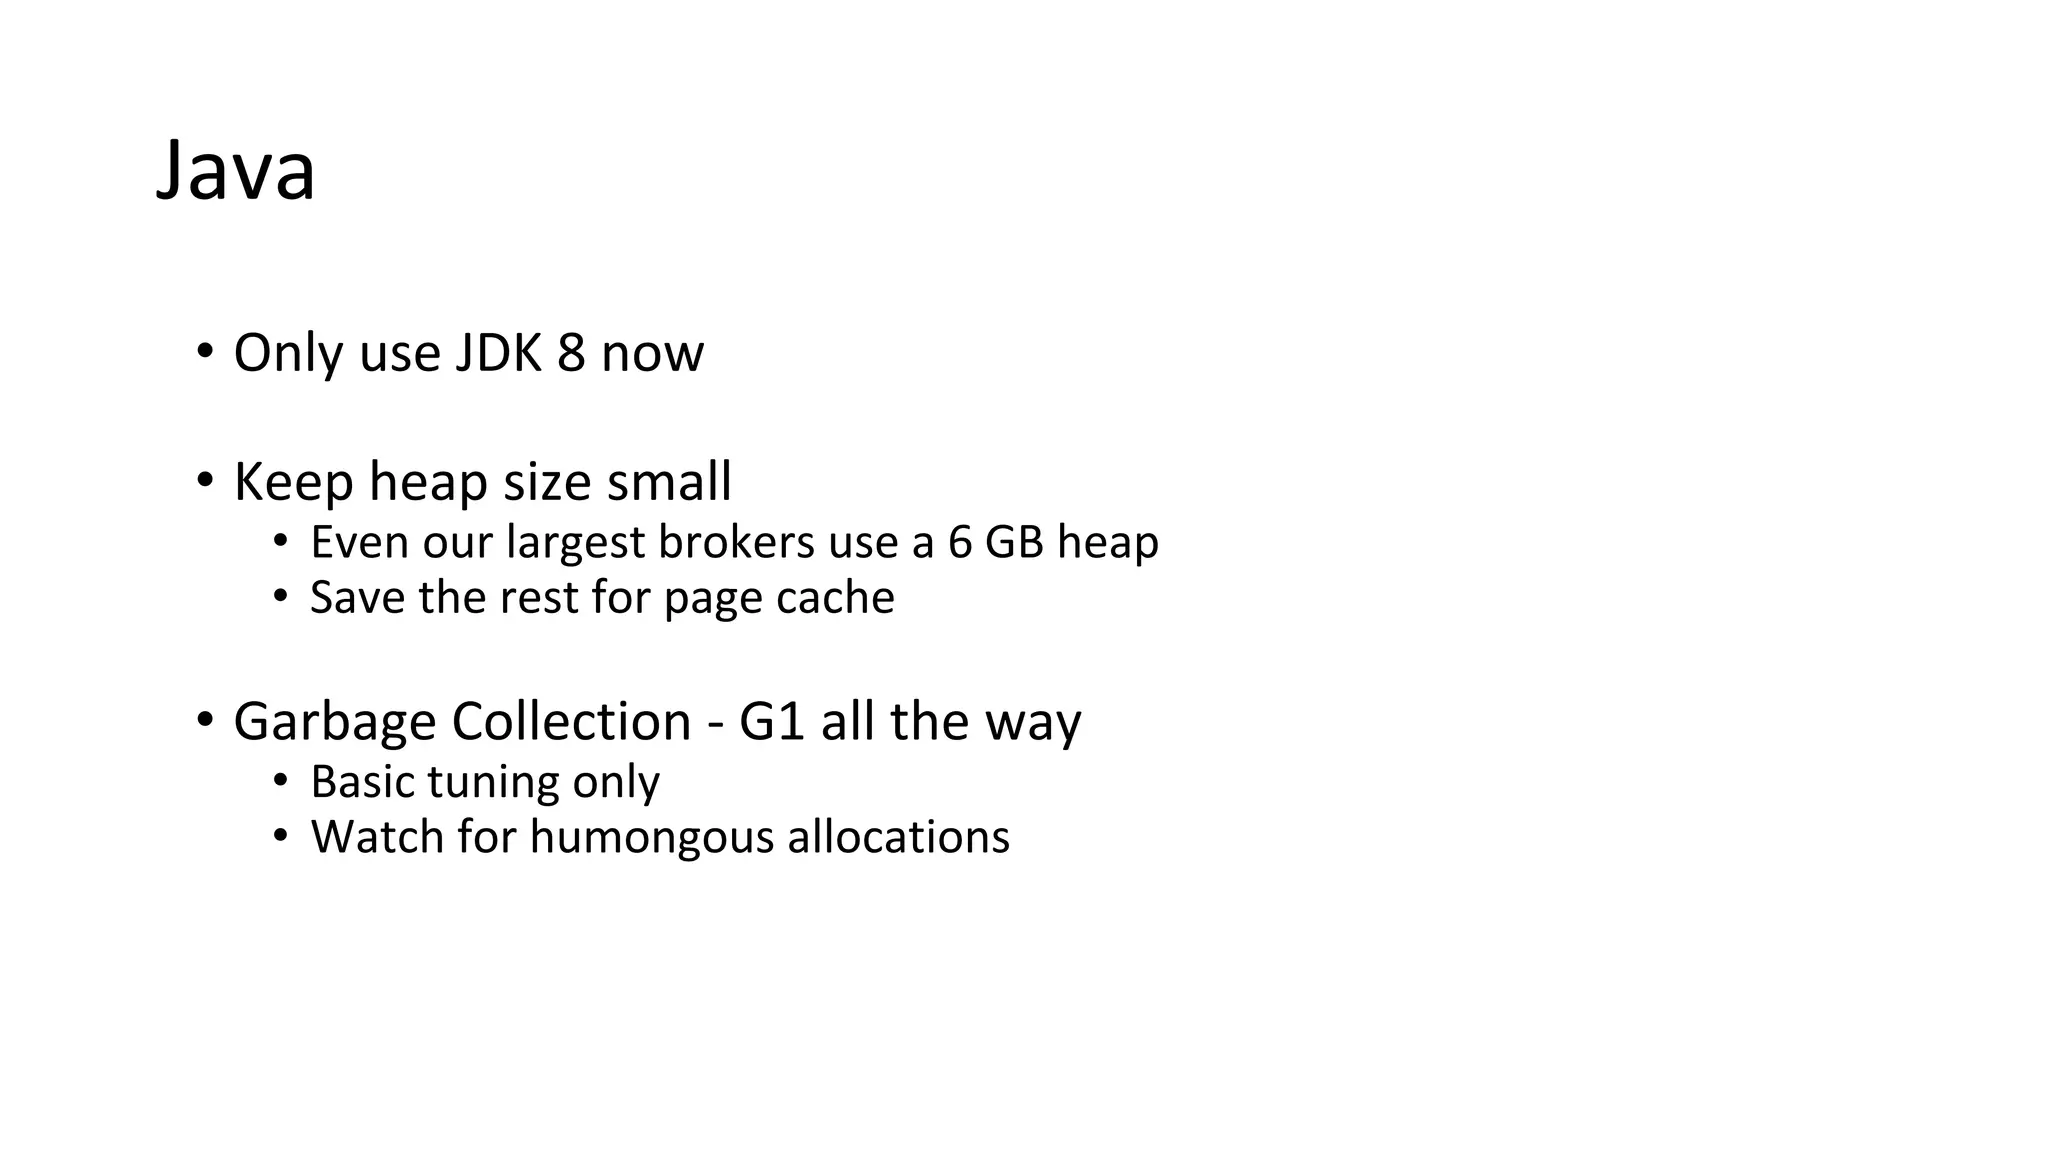
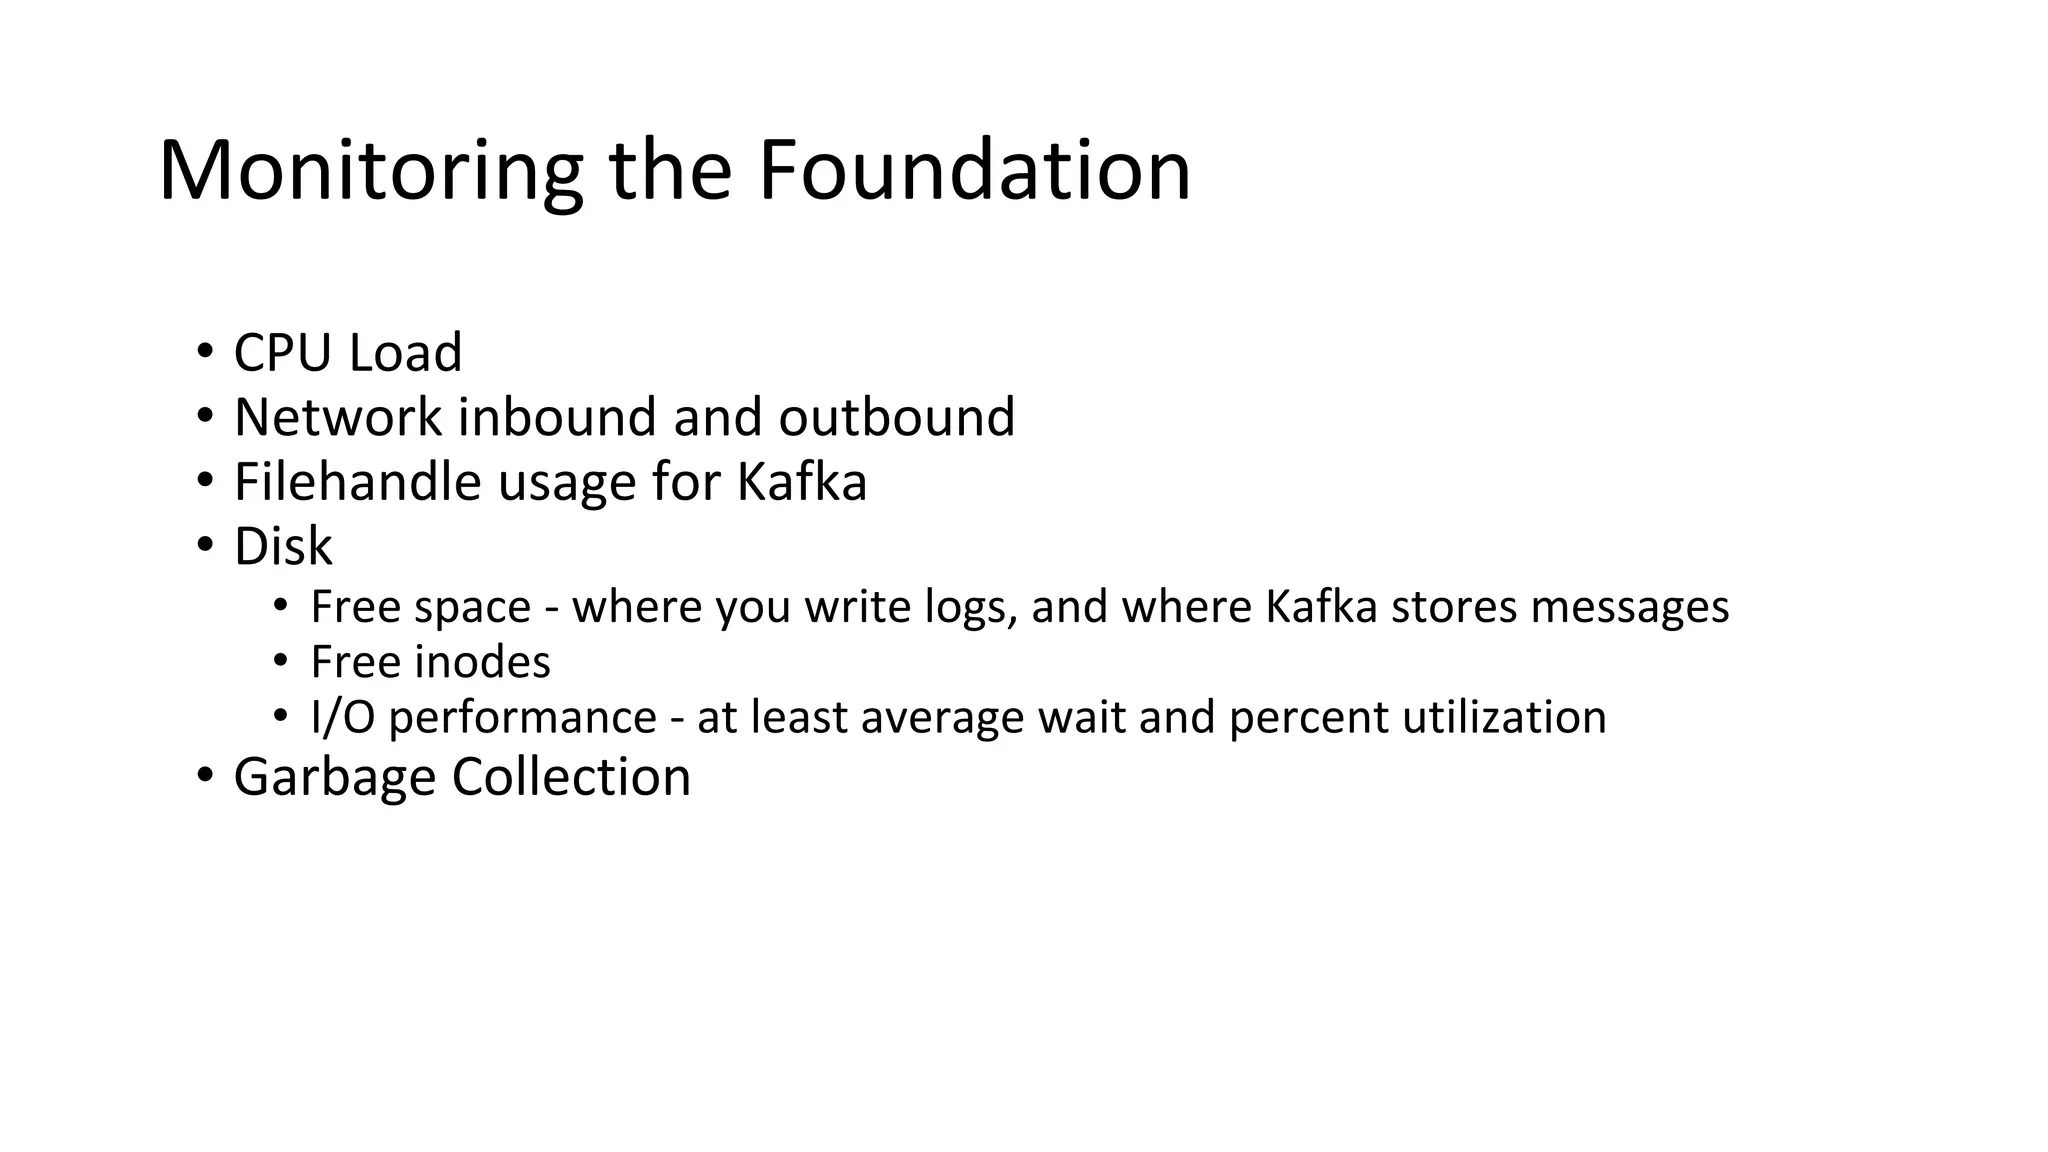
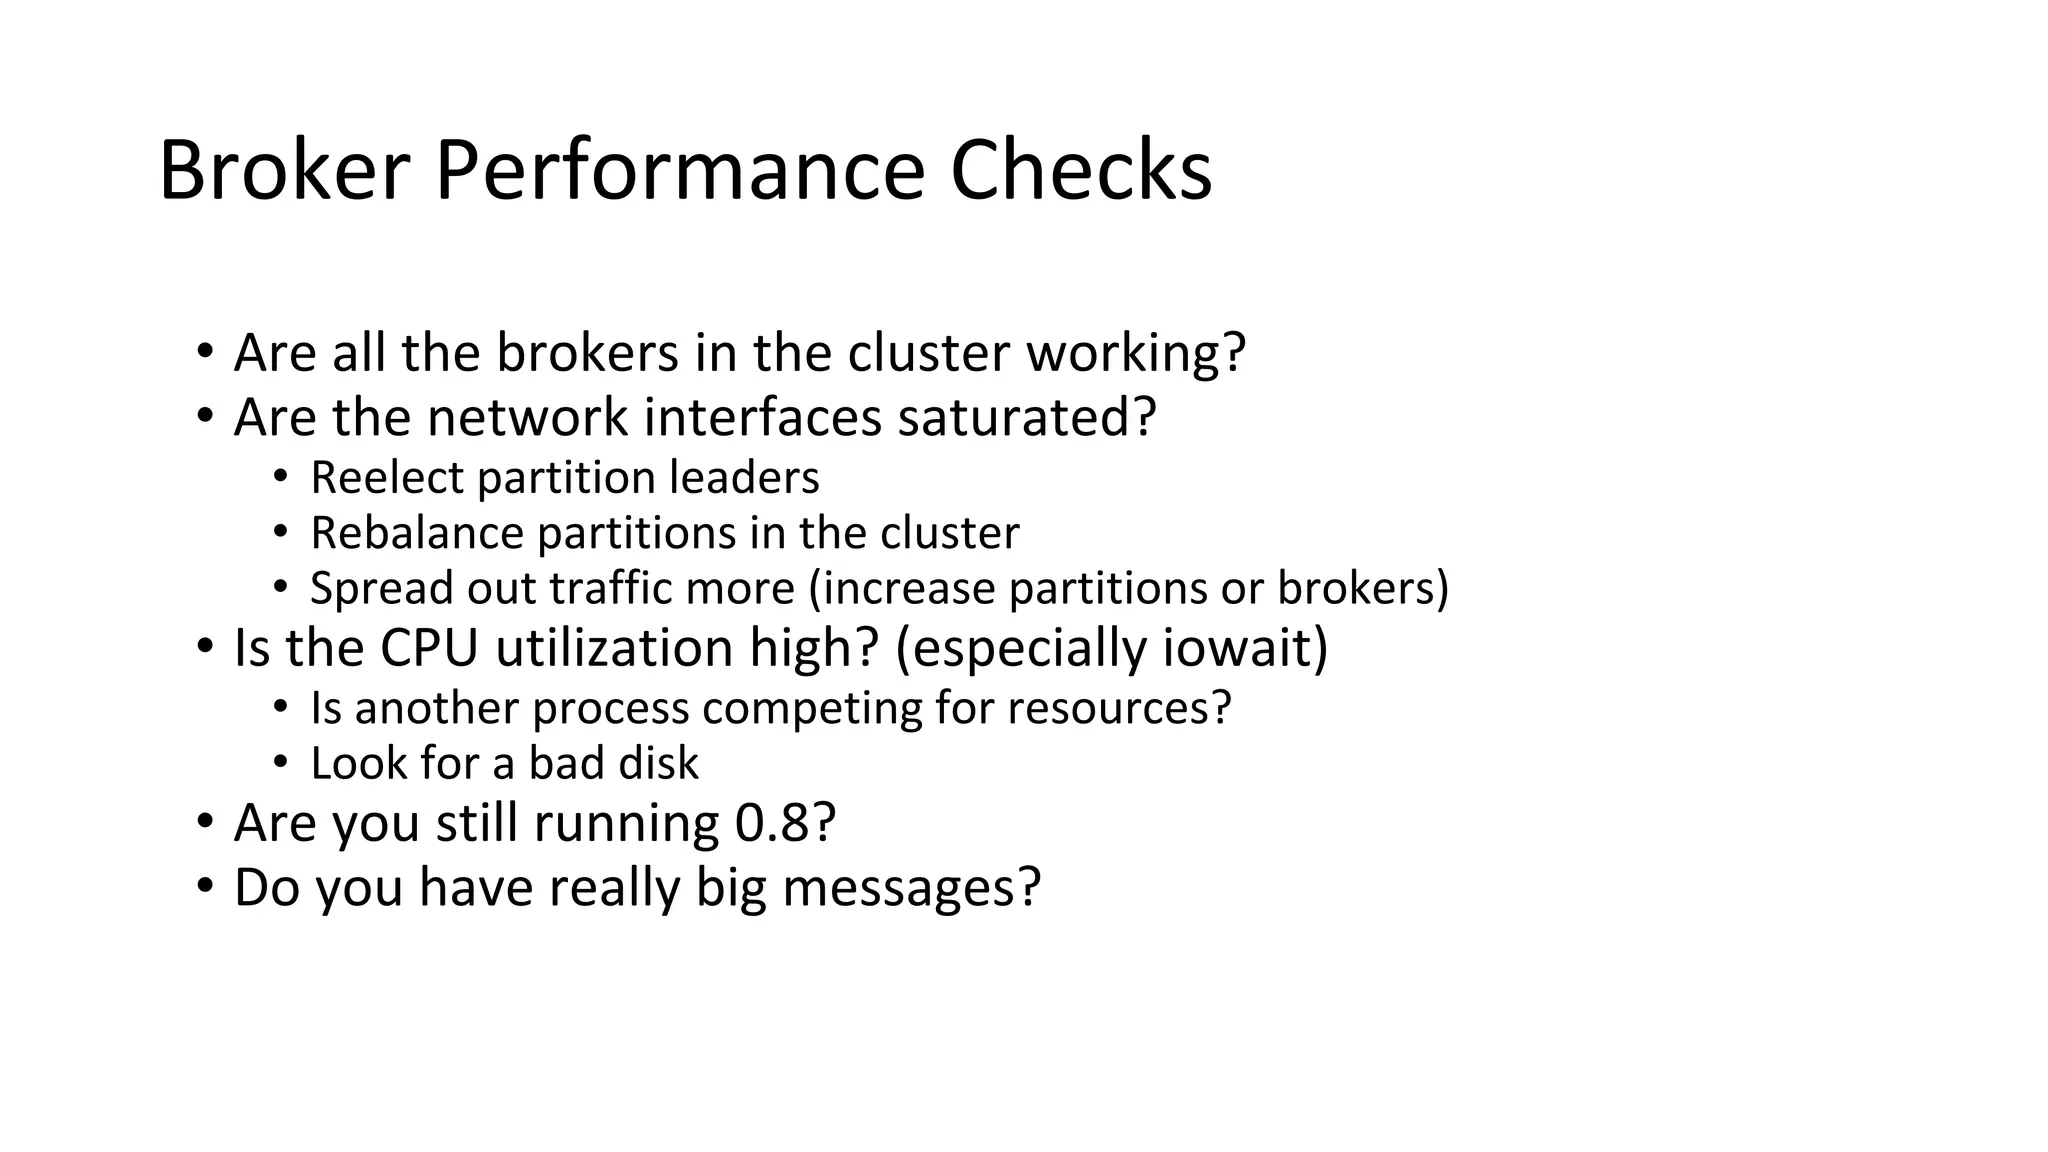
Key aspects of building and tuning a Kafka cluster including hardware, message throughput, and resource monitoring.
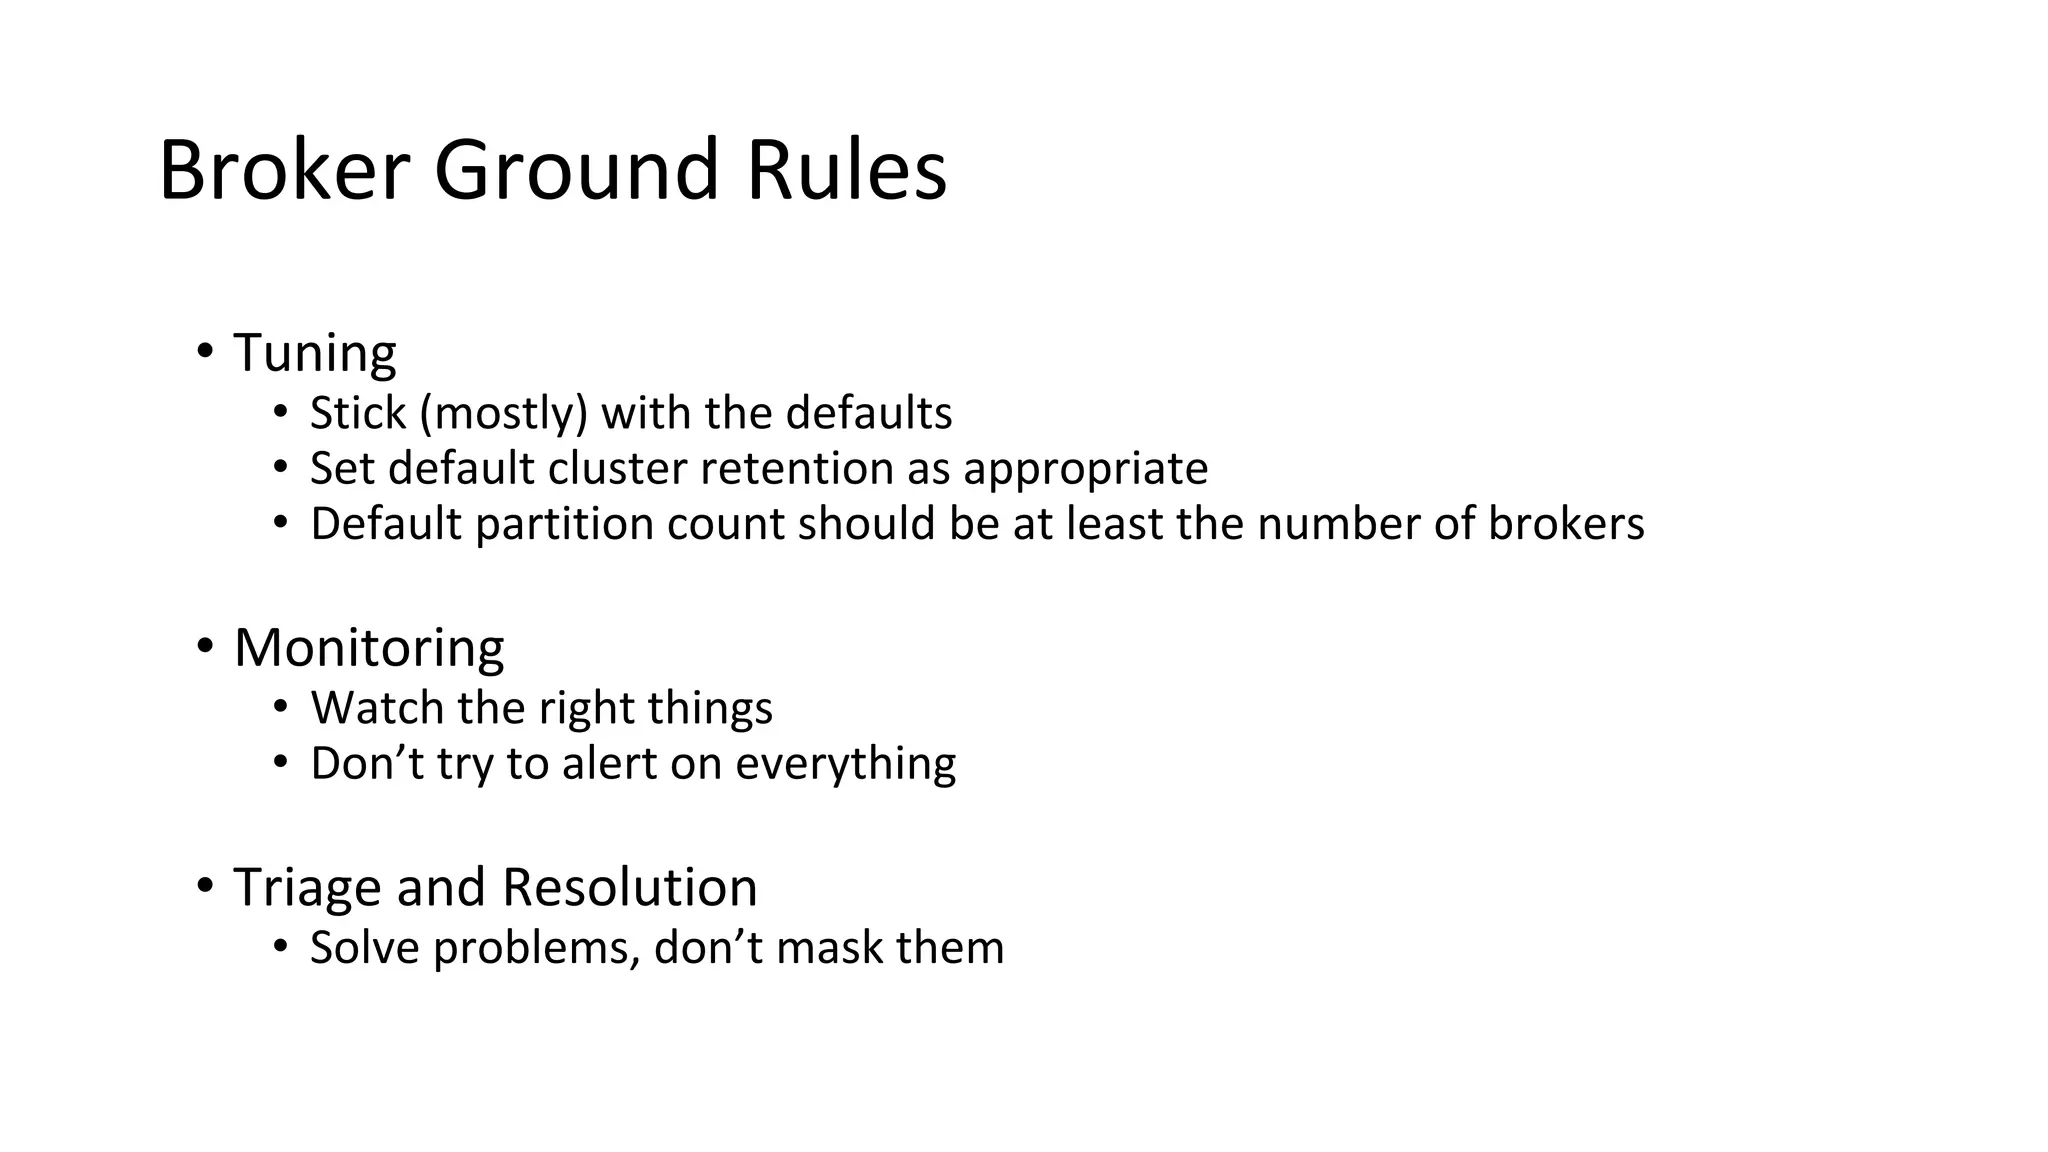
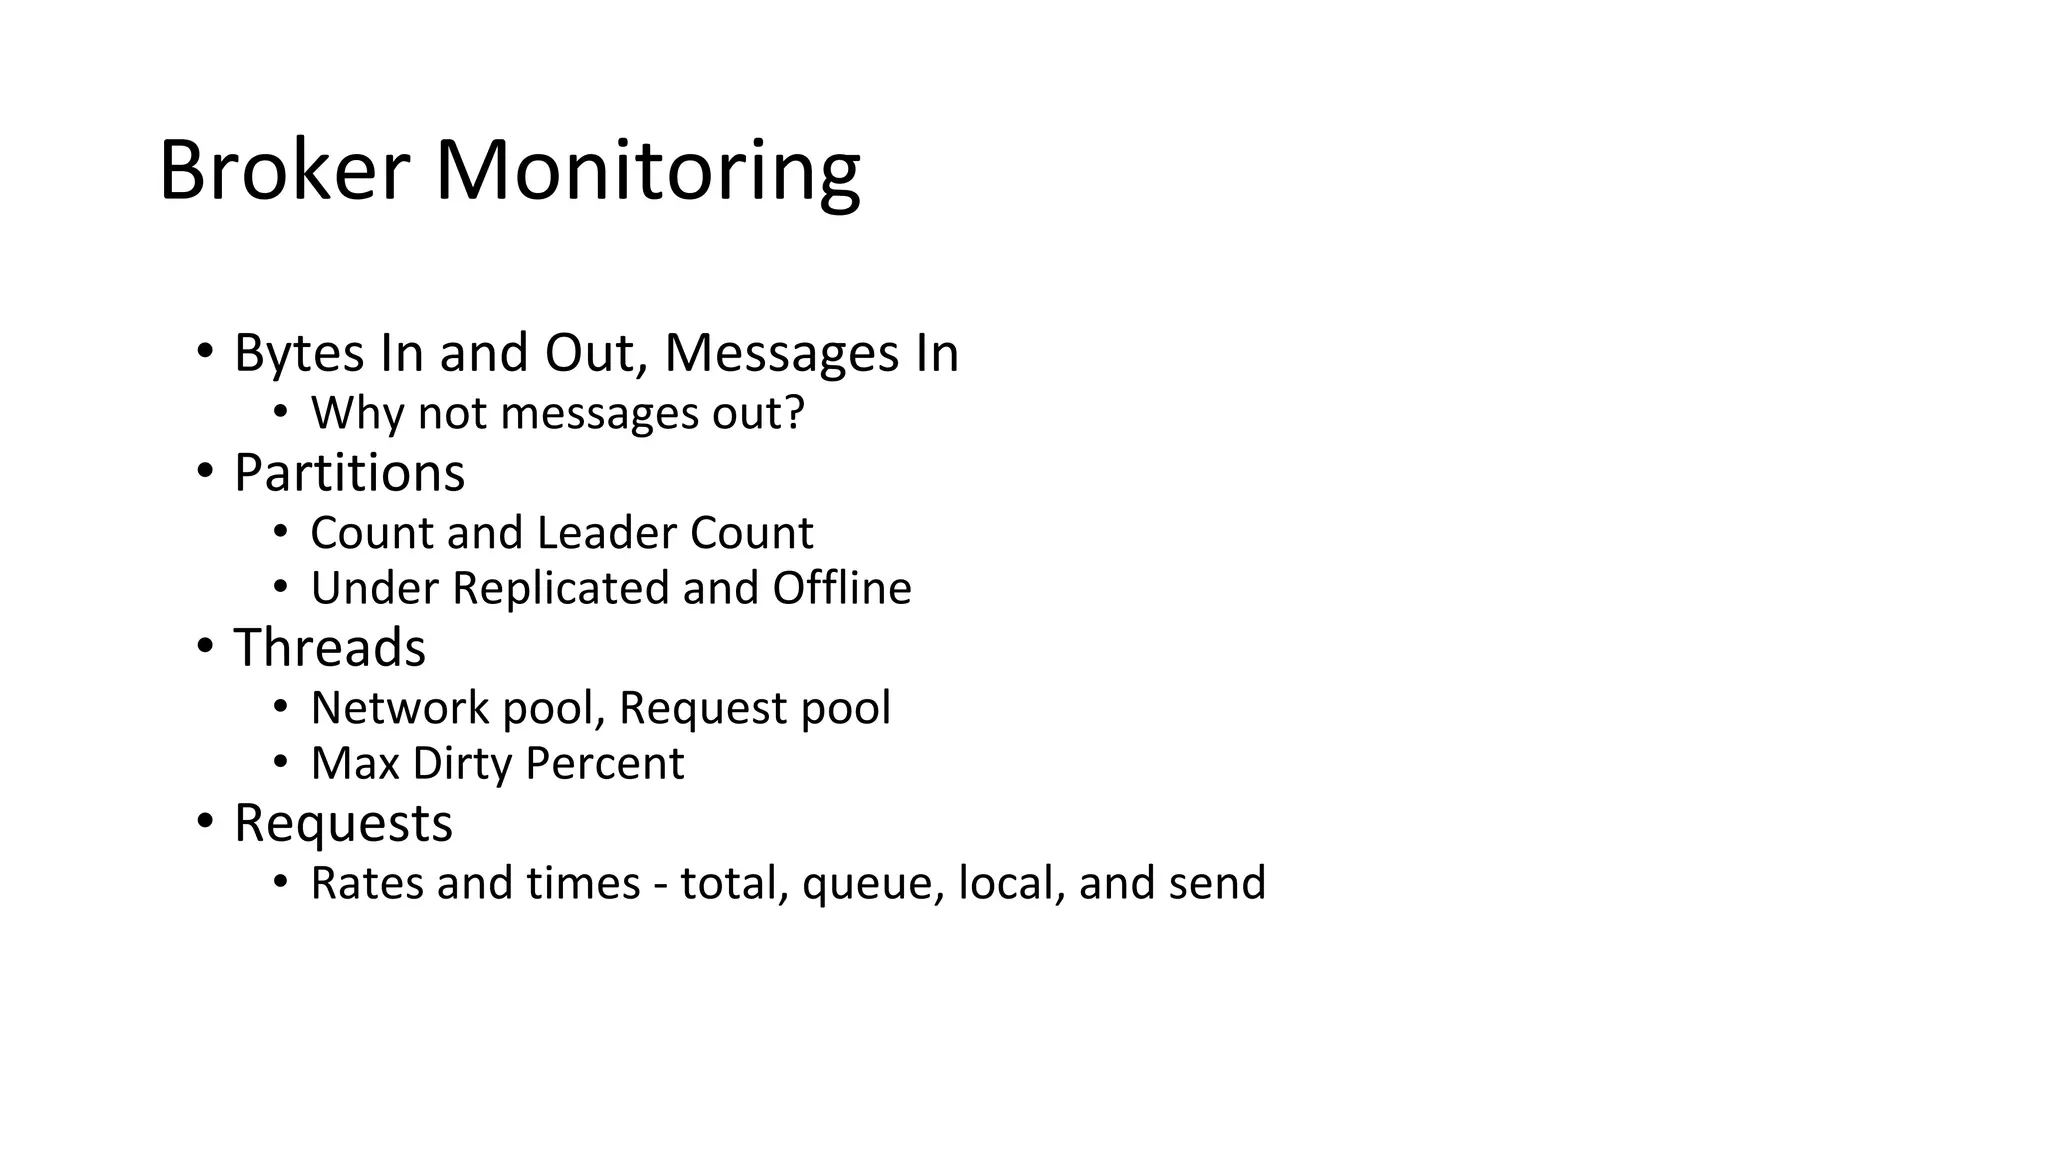
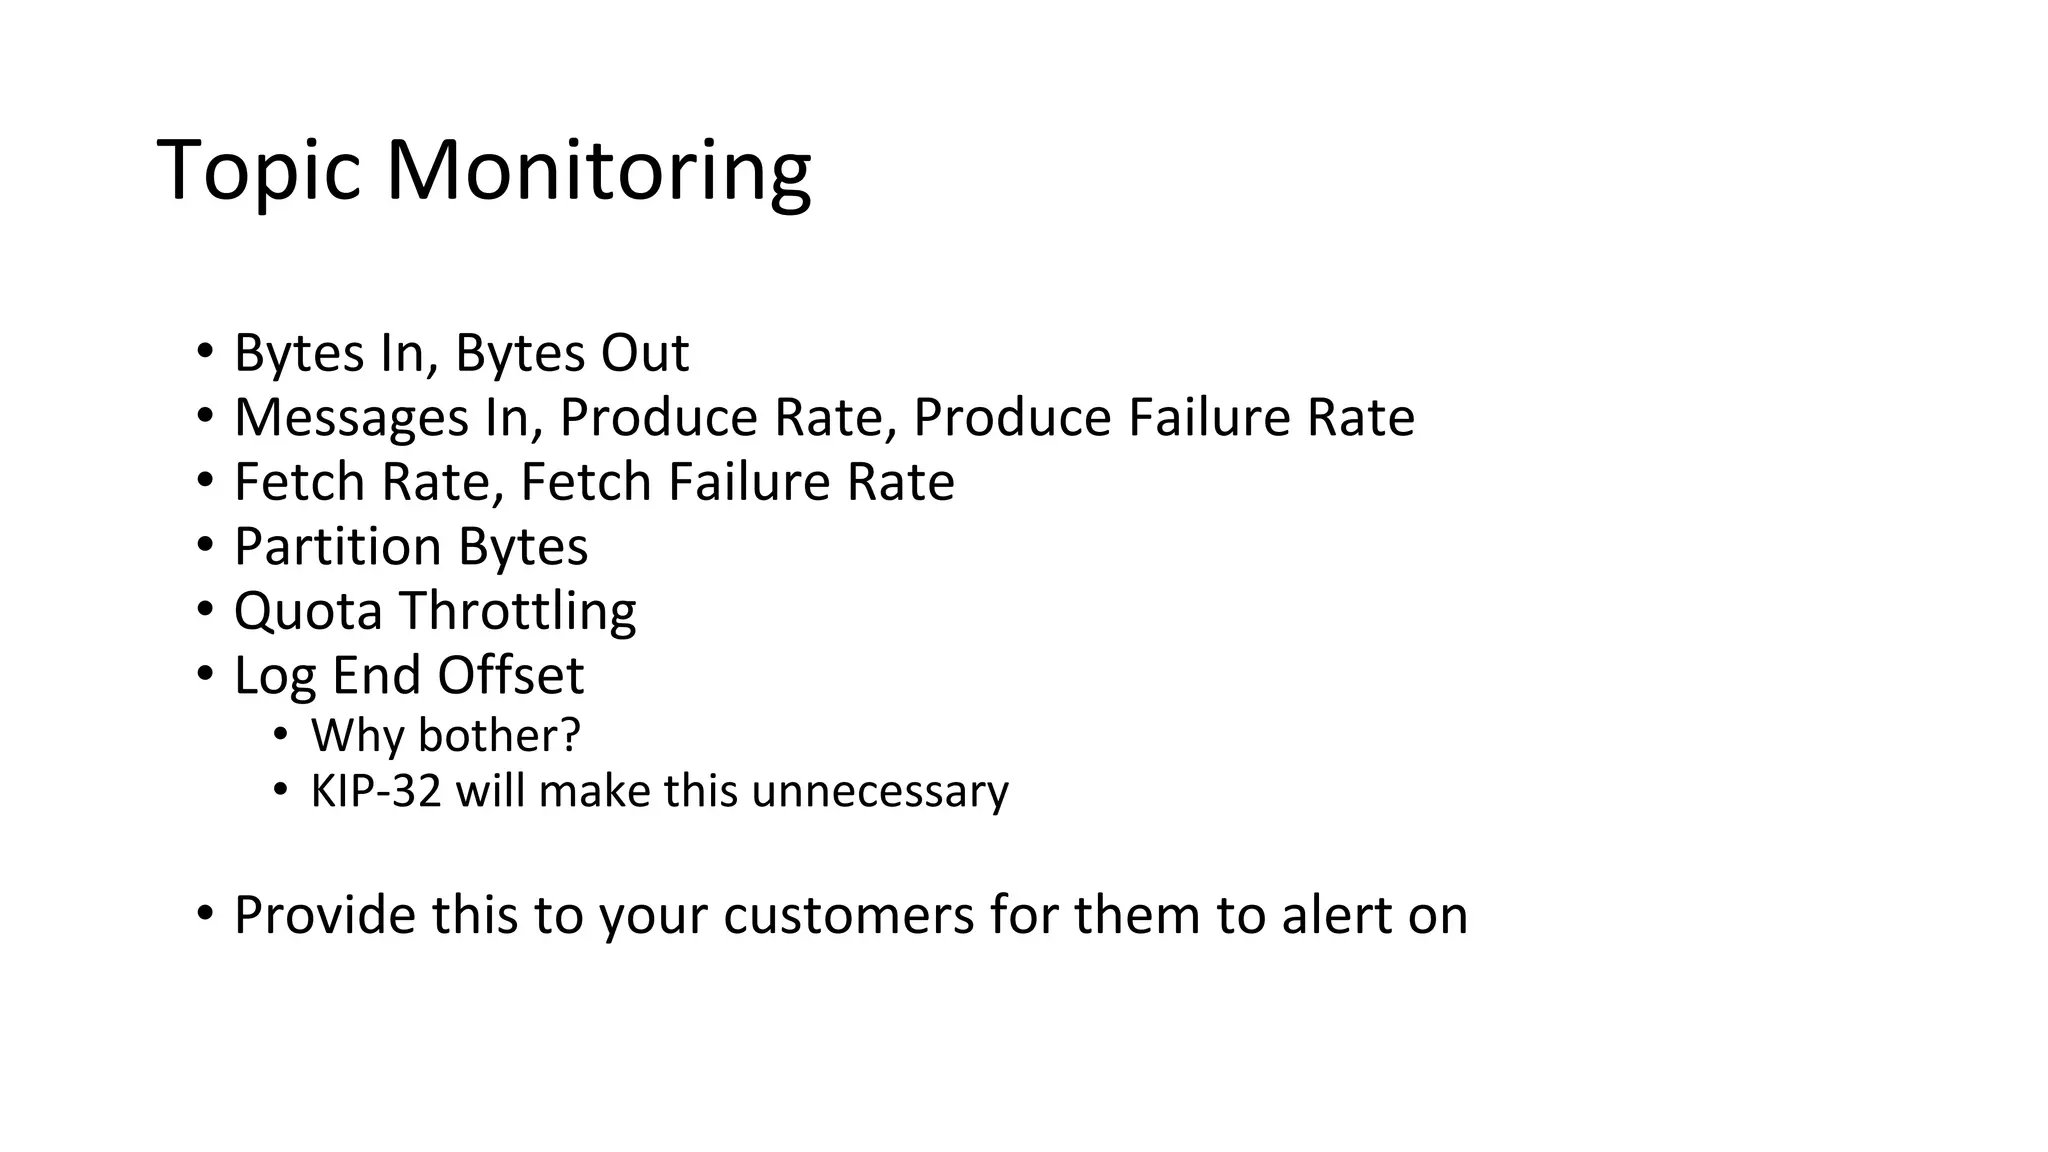
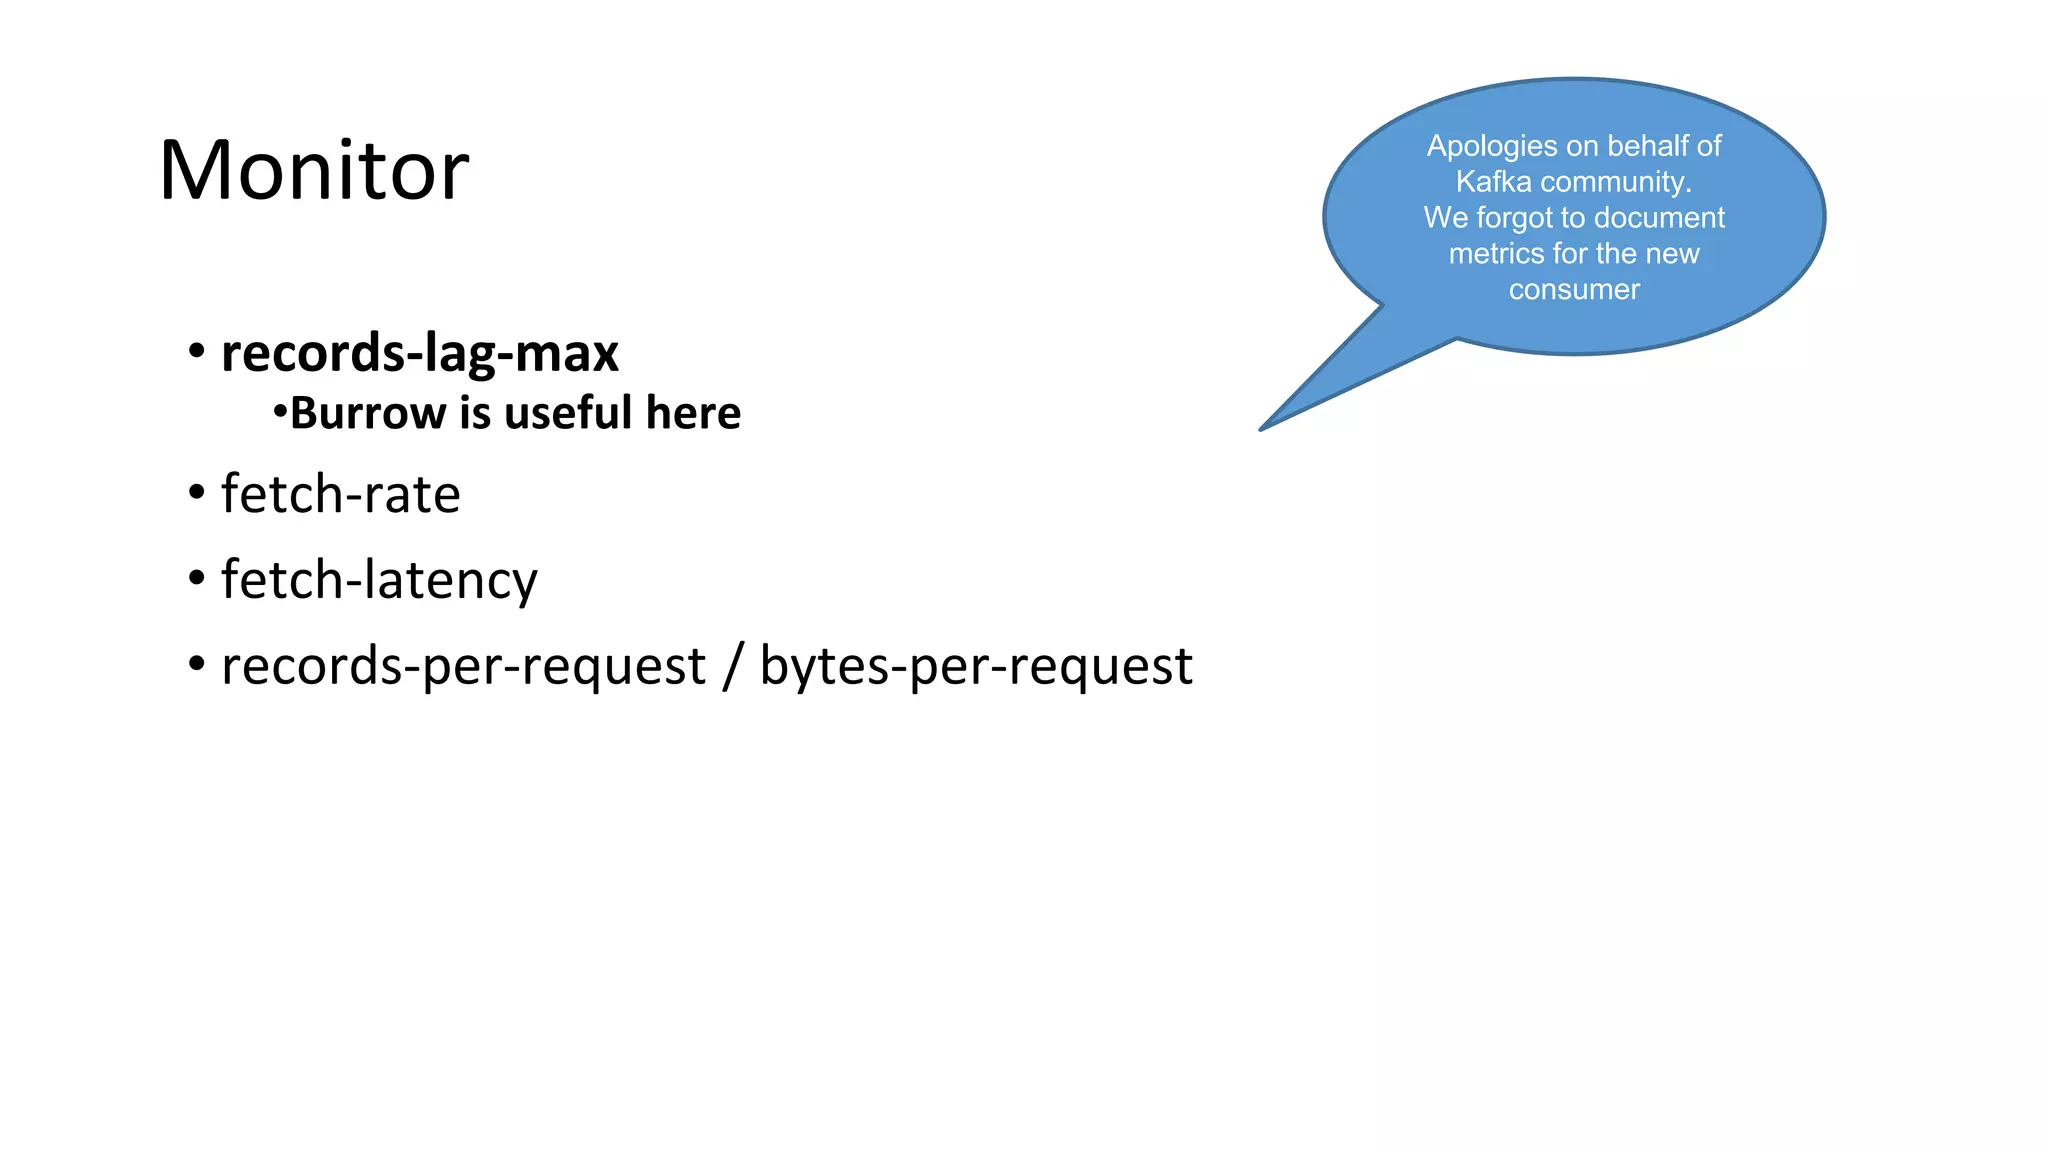
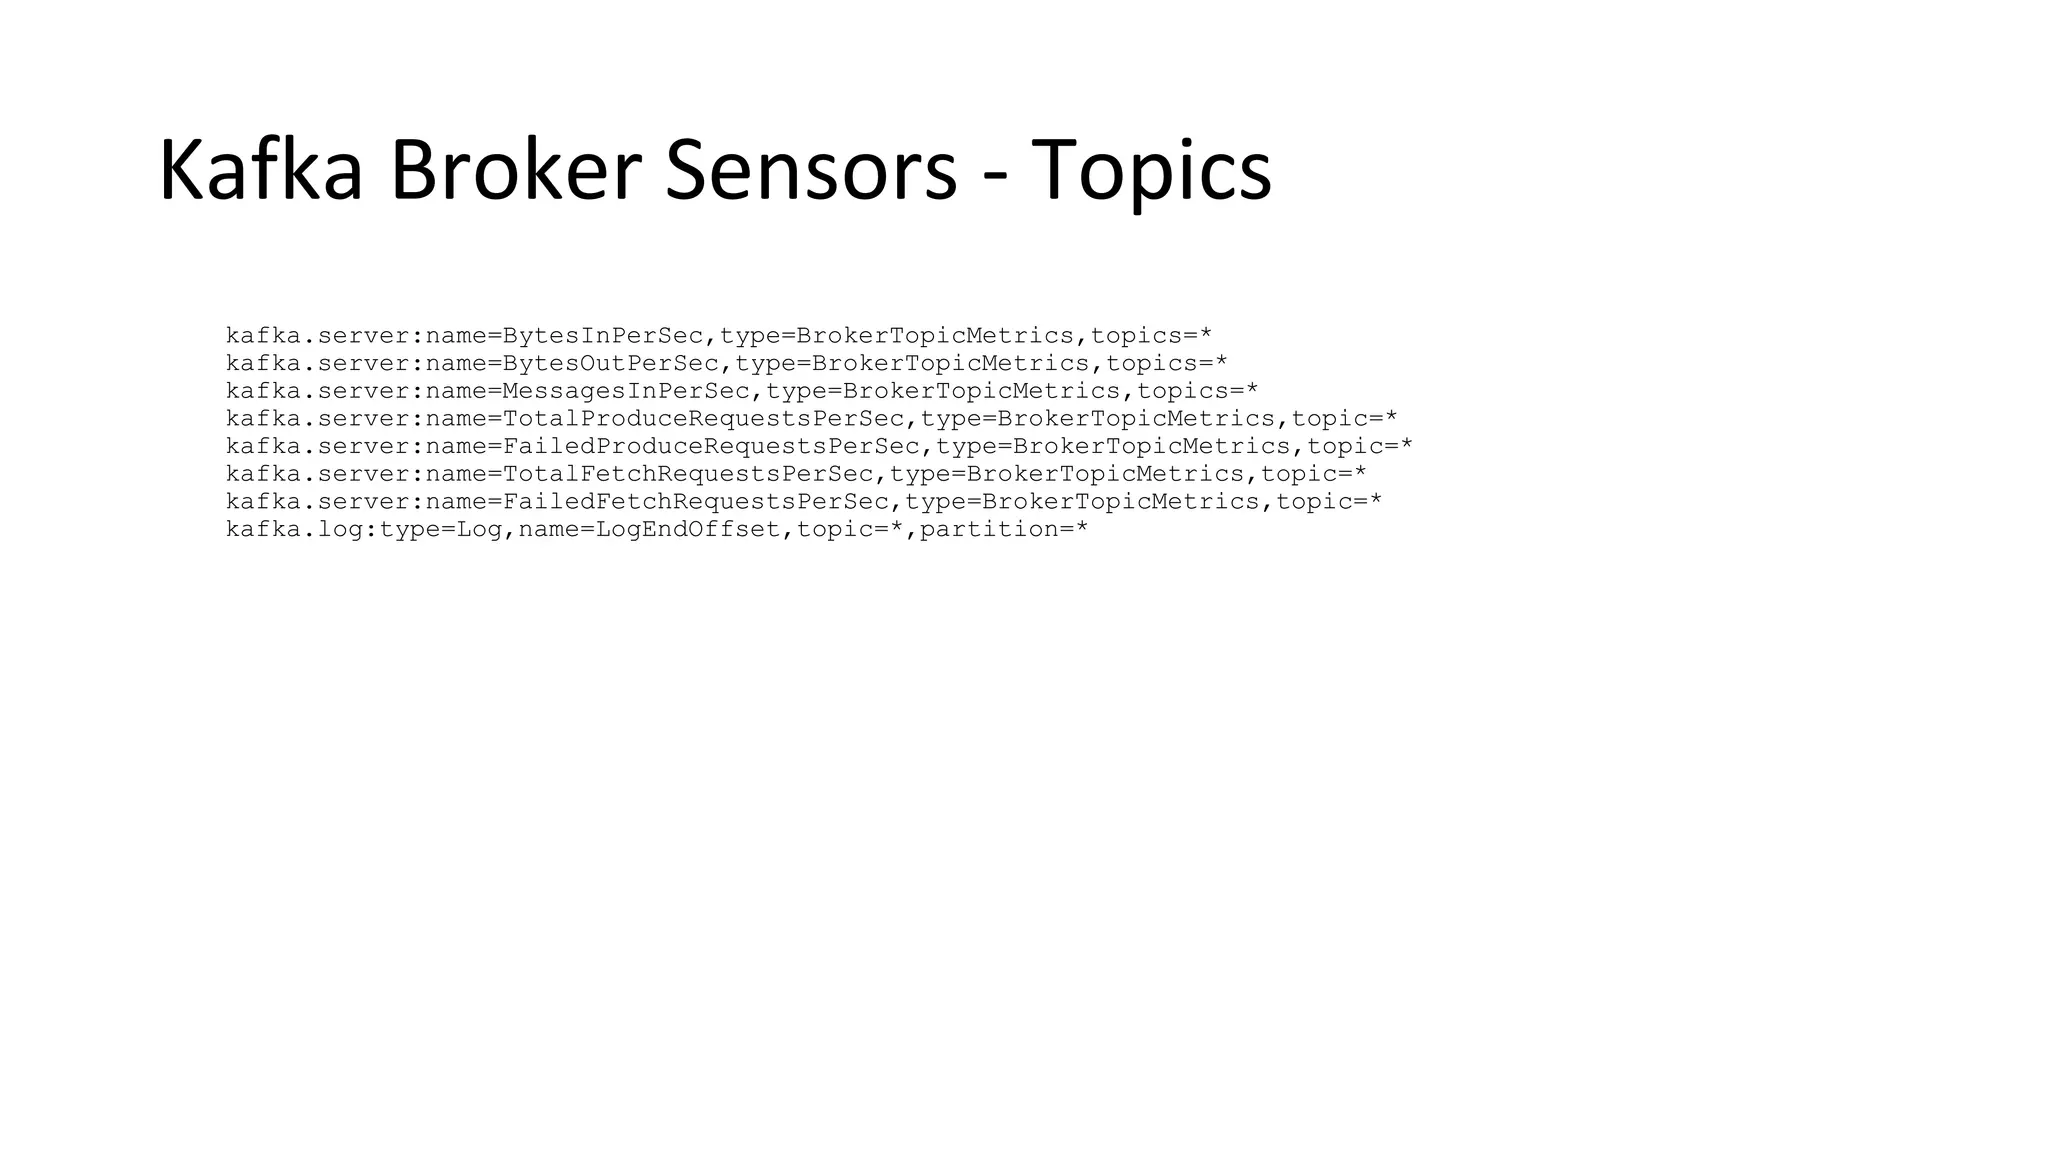
Guidelines for monitoring Kafka brokers and topics, discussing metrics to effectively manage performance.
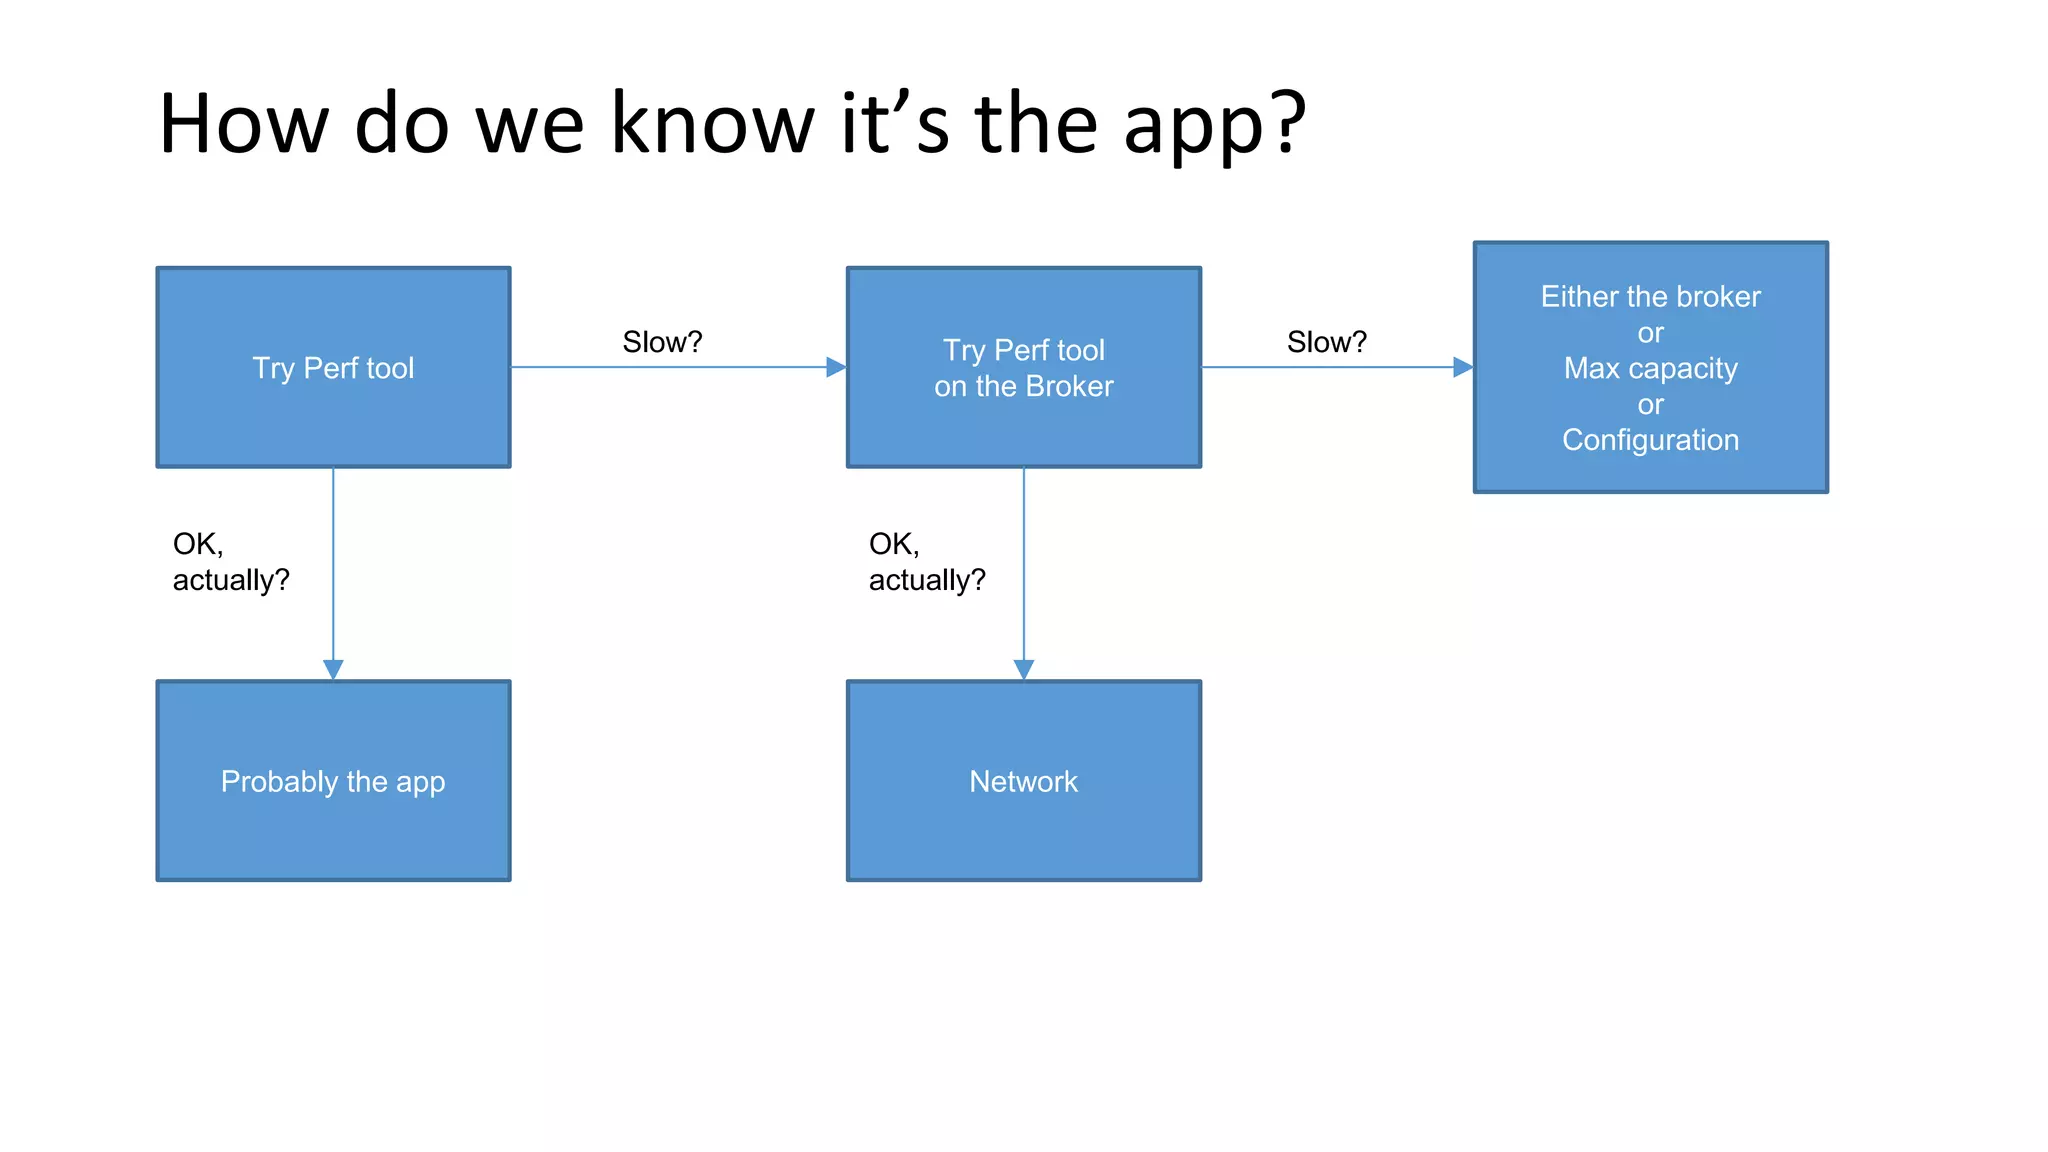
Focuses on operational strategies for anticipating issues in Kafka performance through monitoring and proactive adjustments.
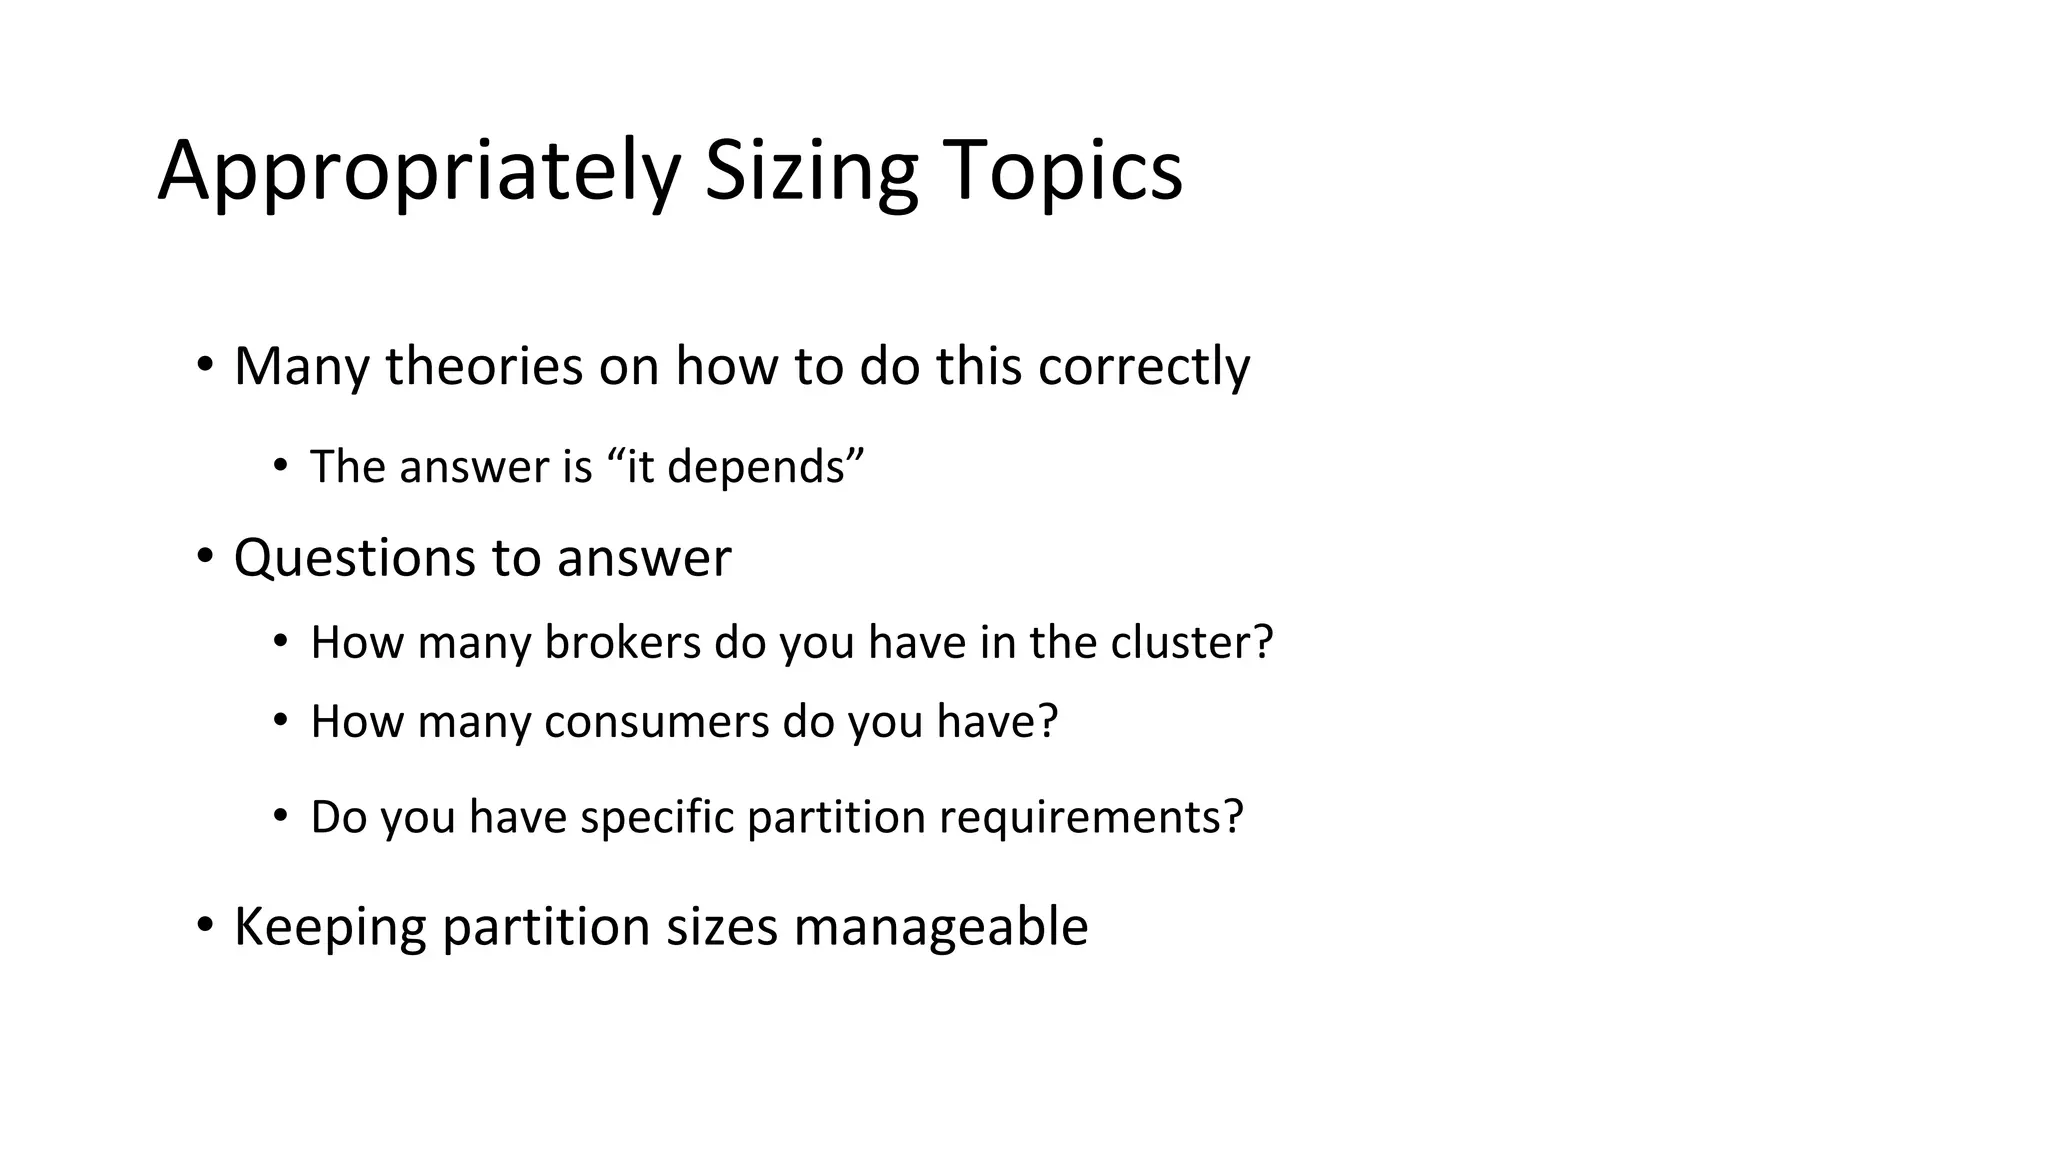
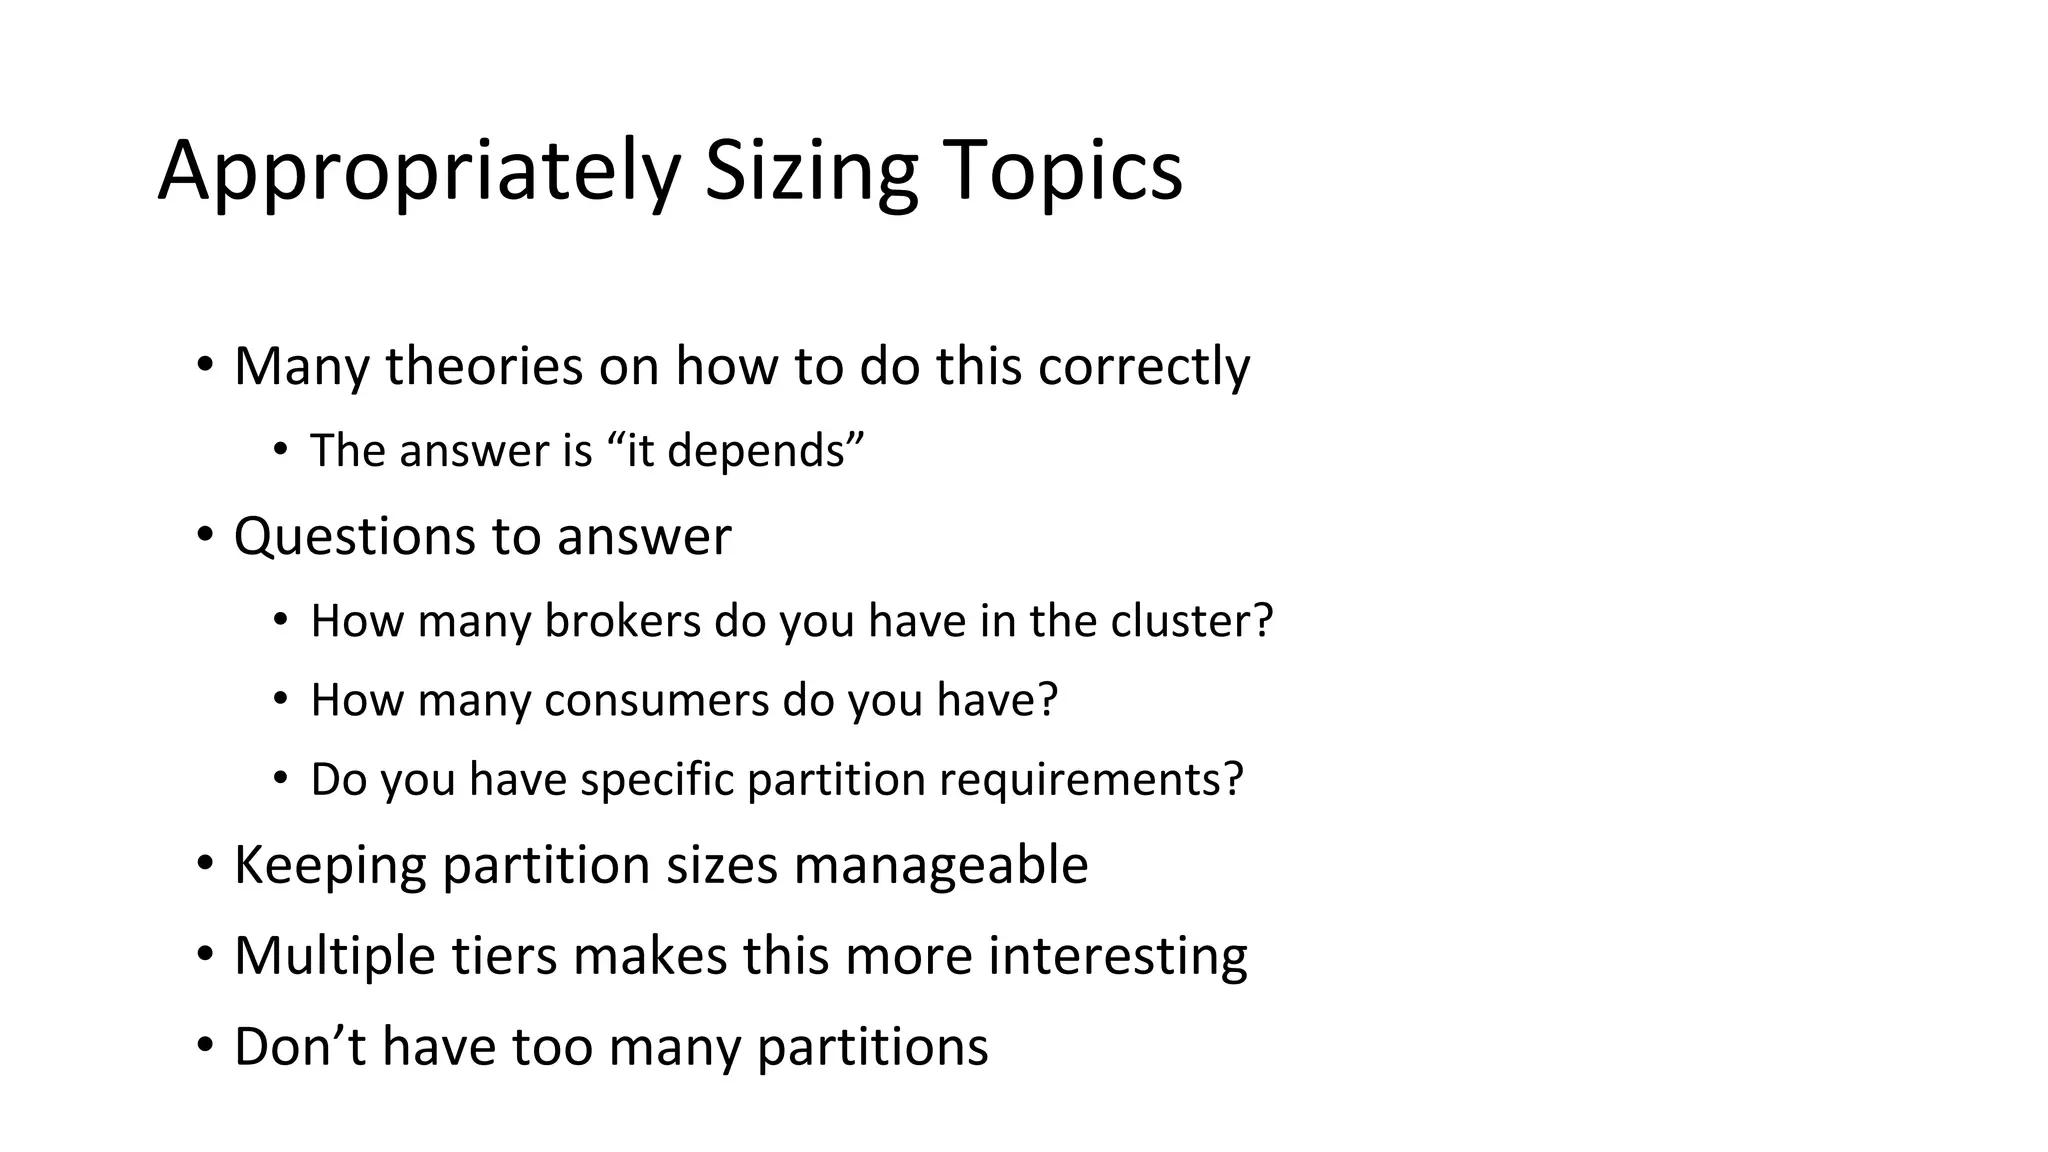
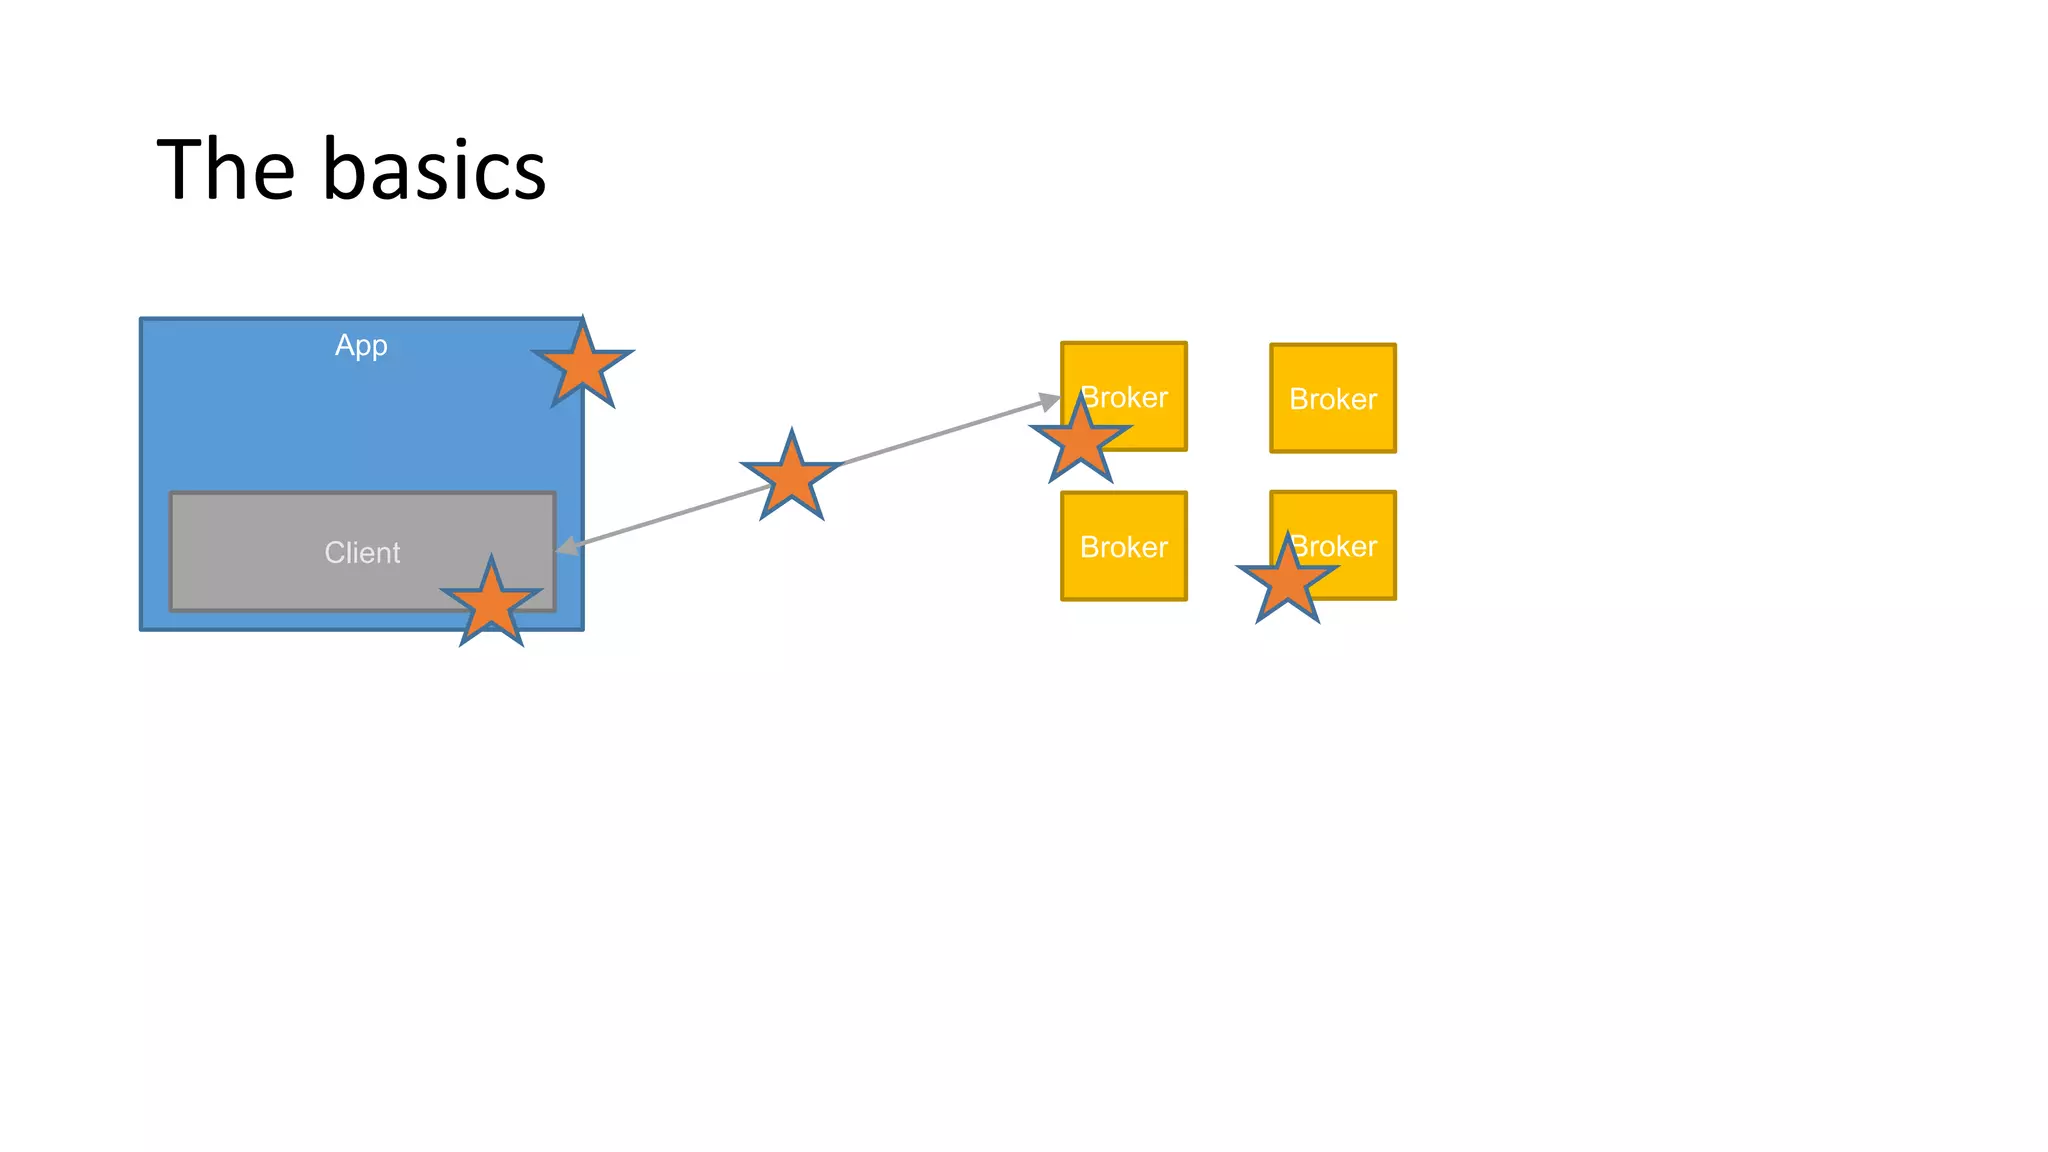
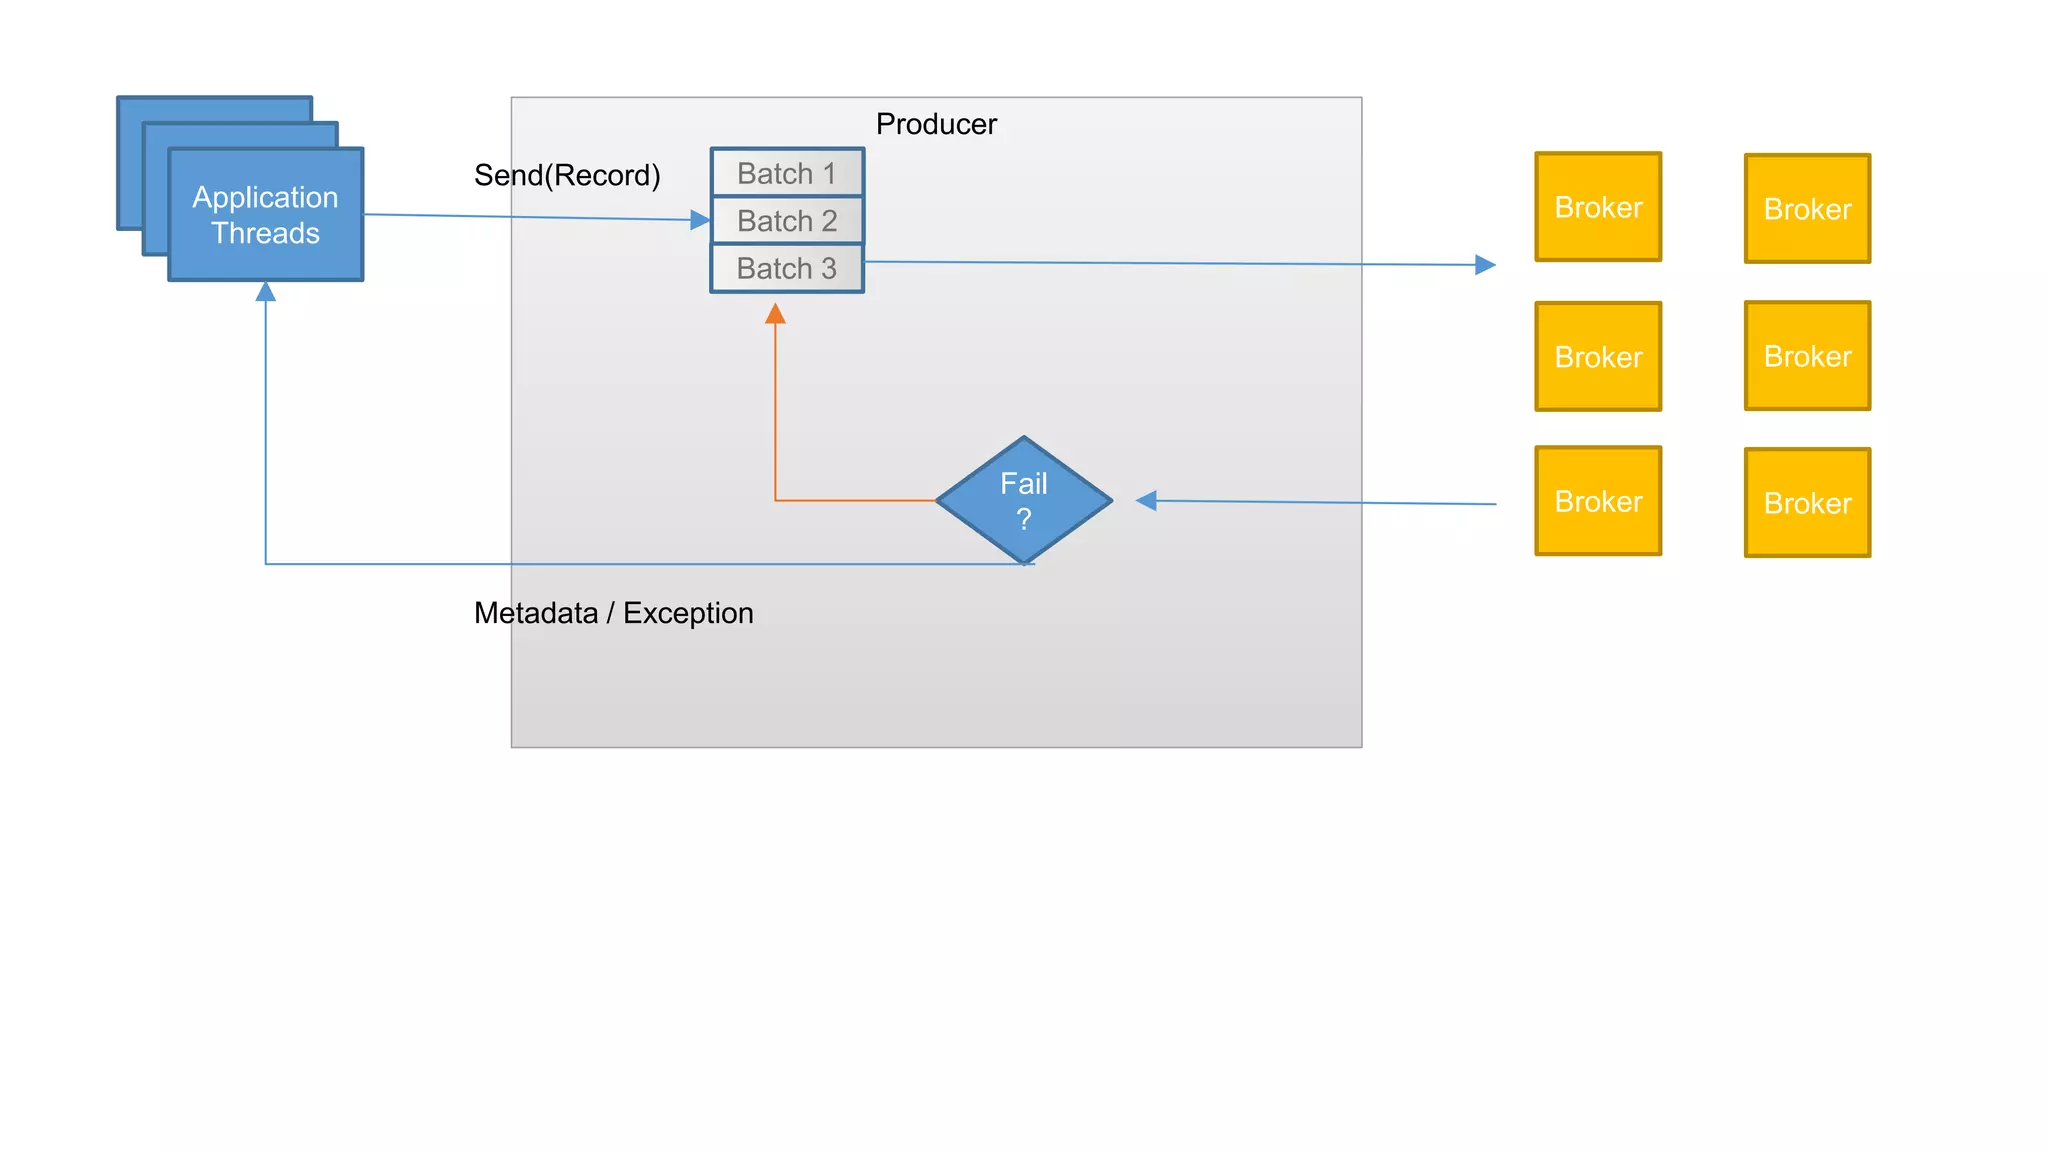
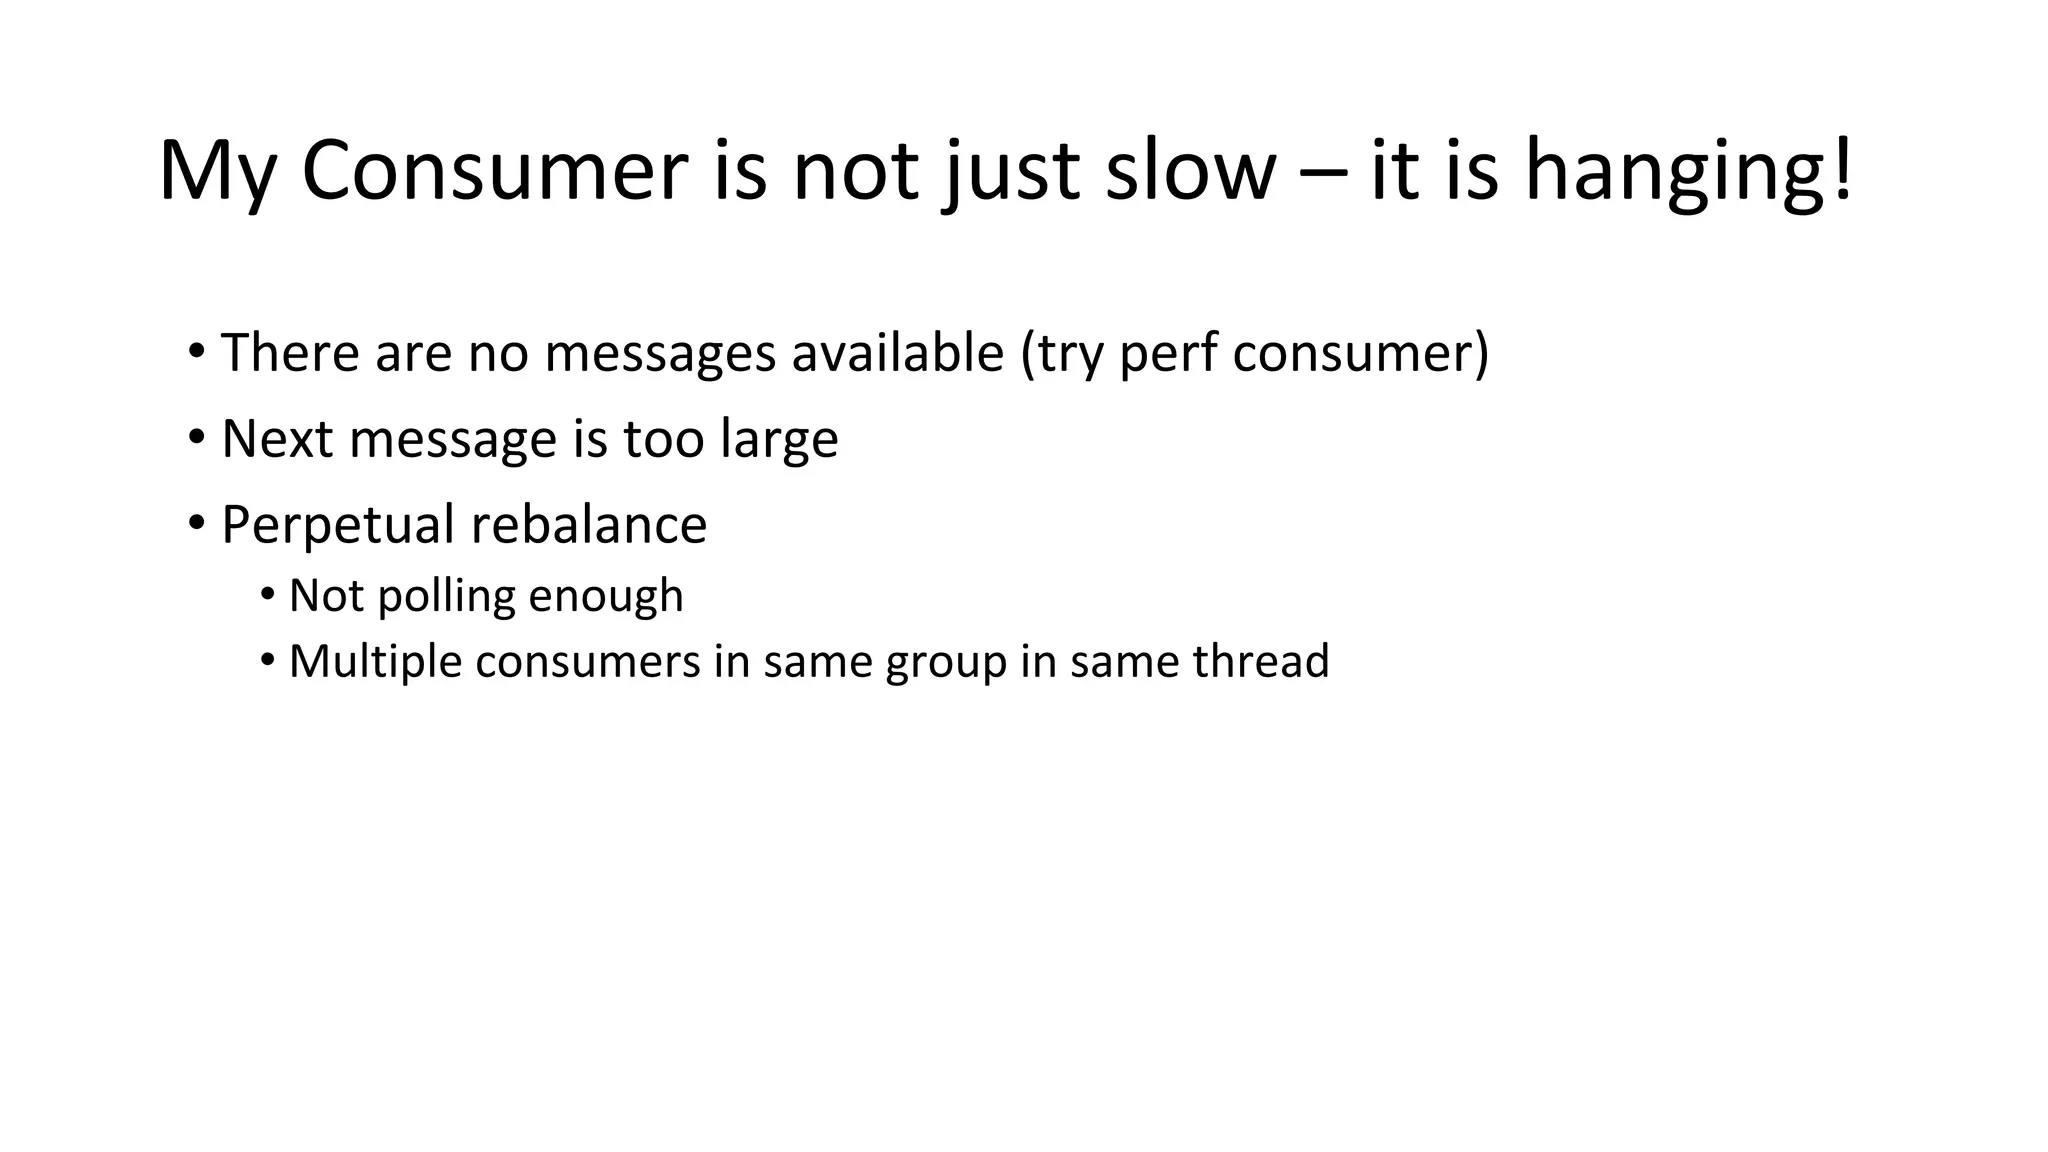
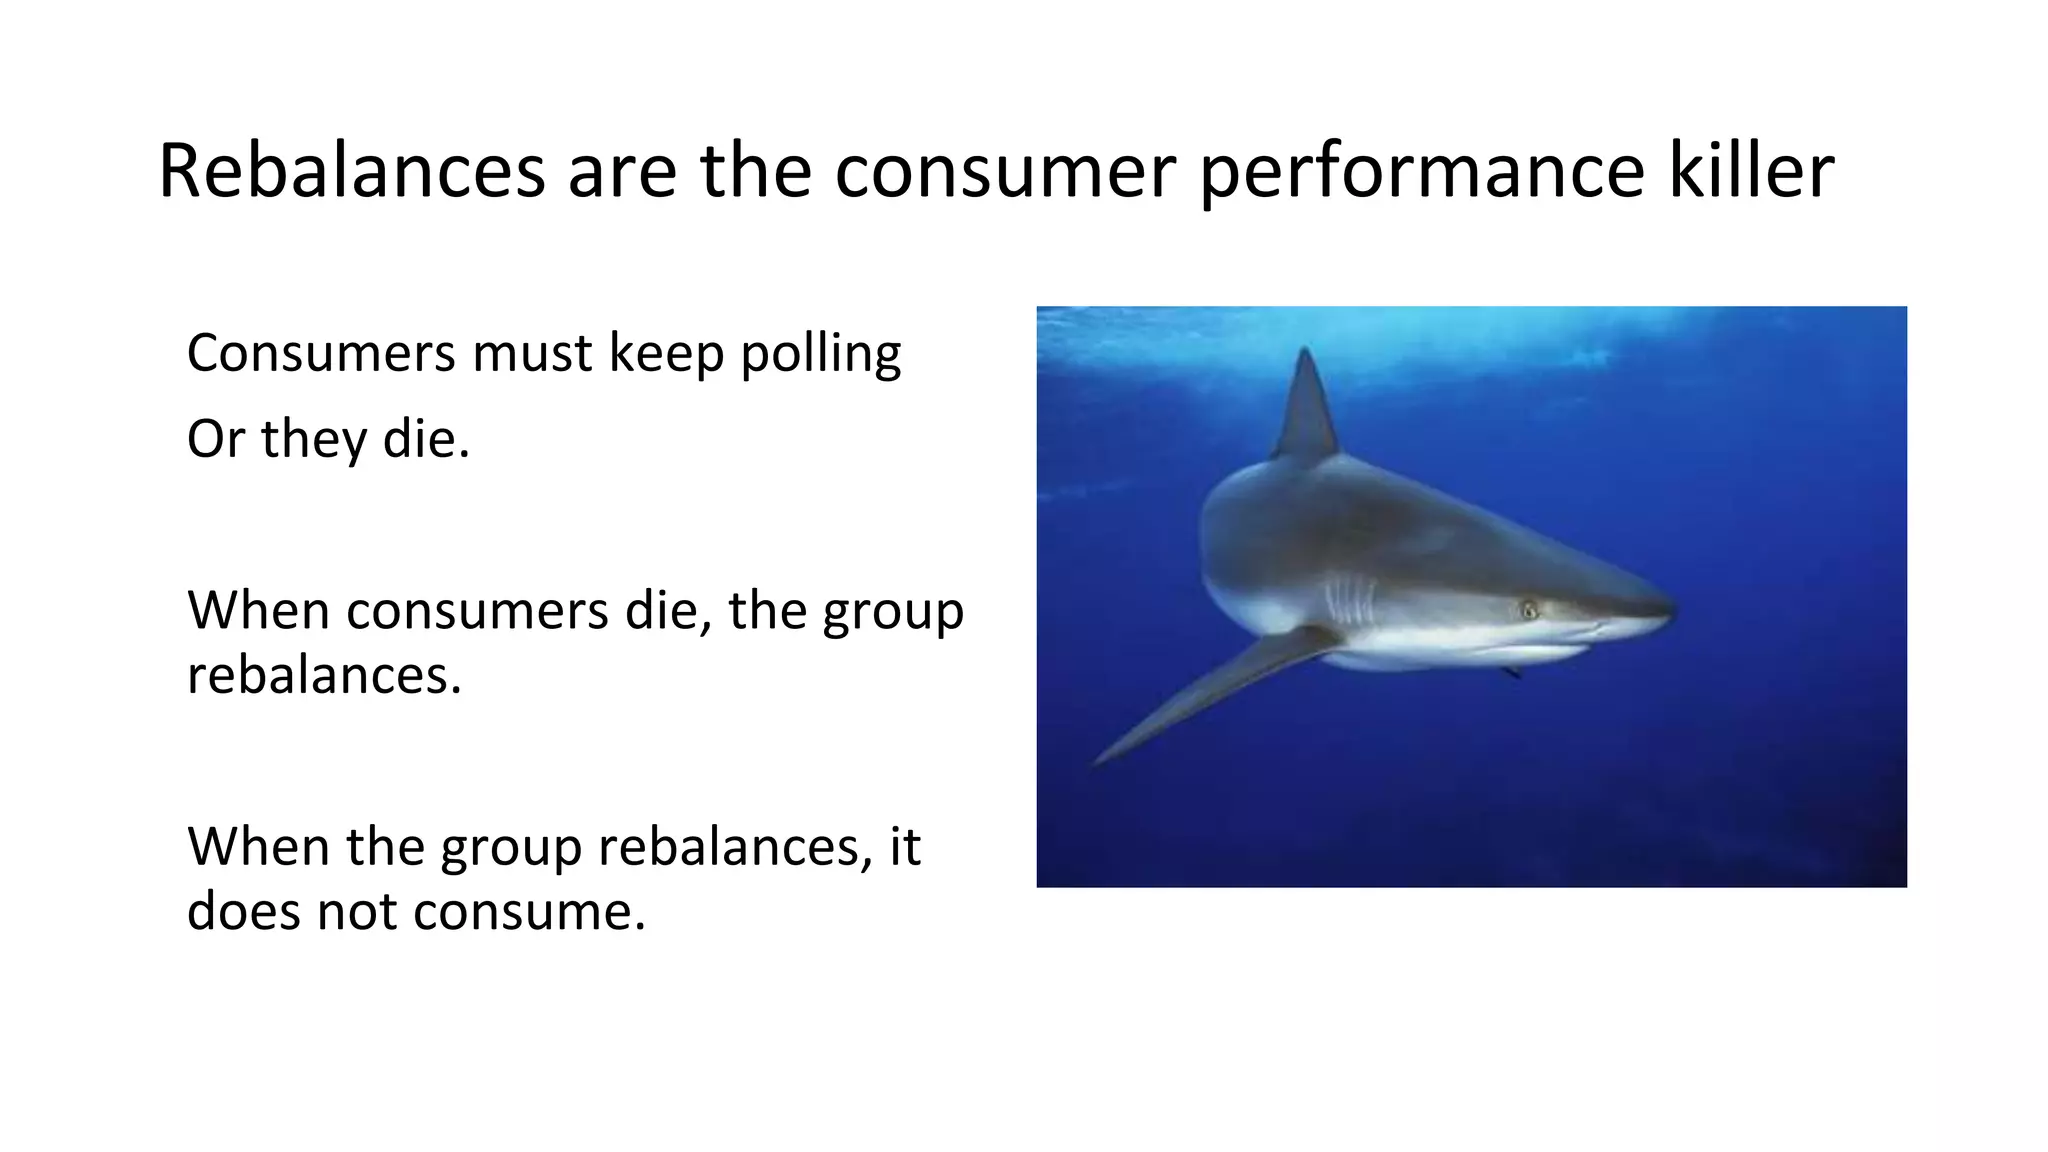
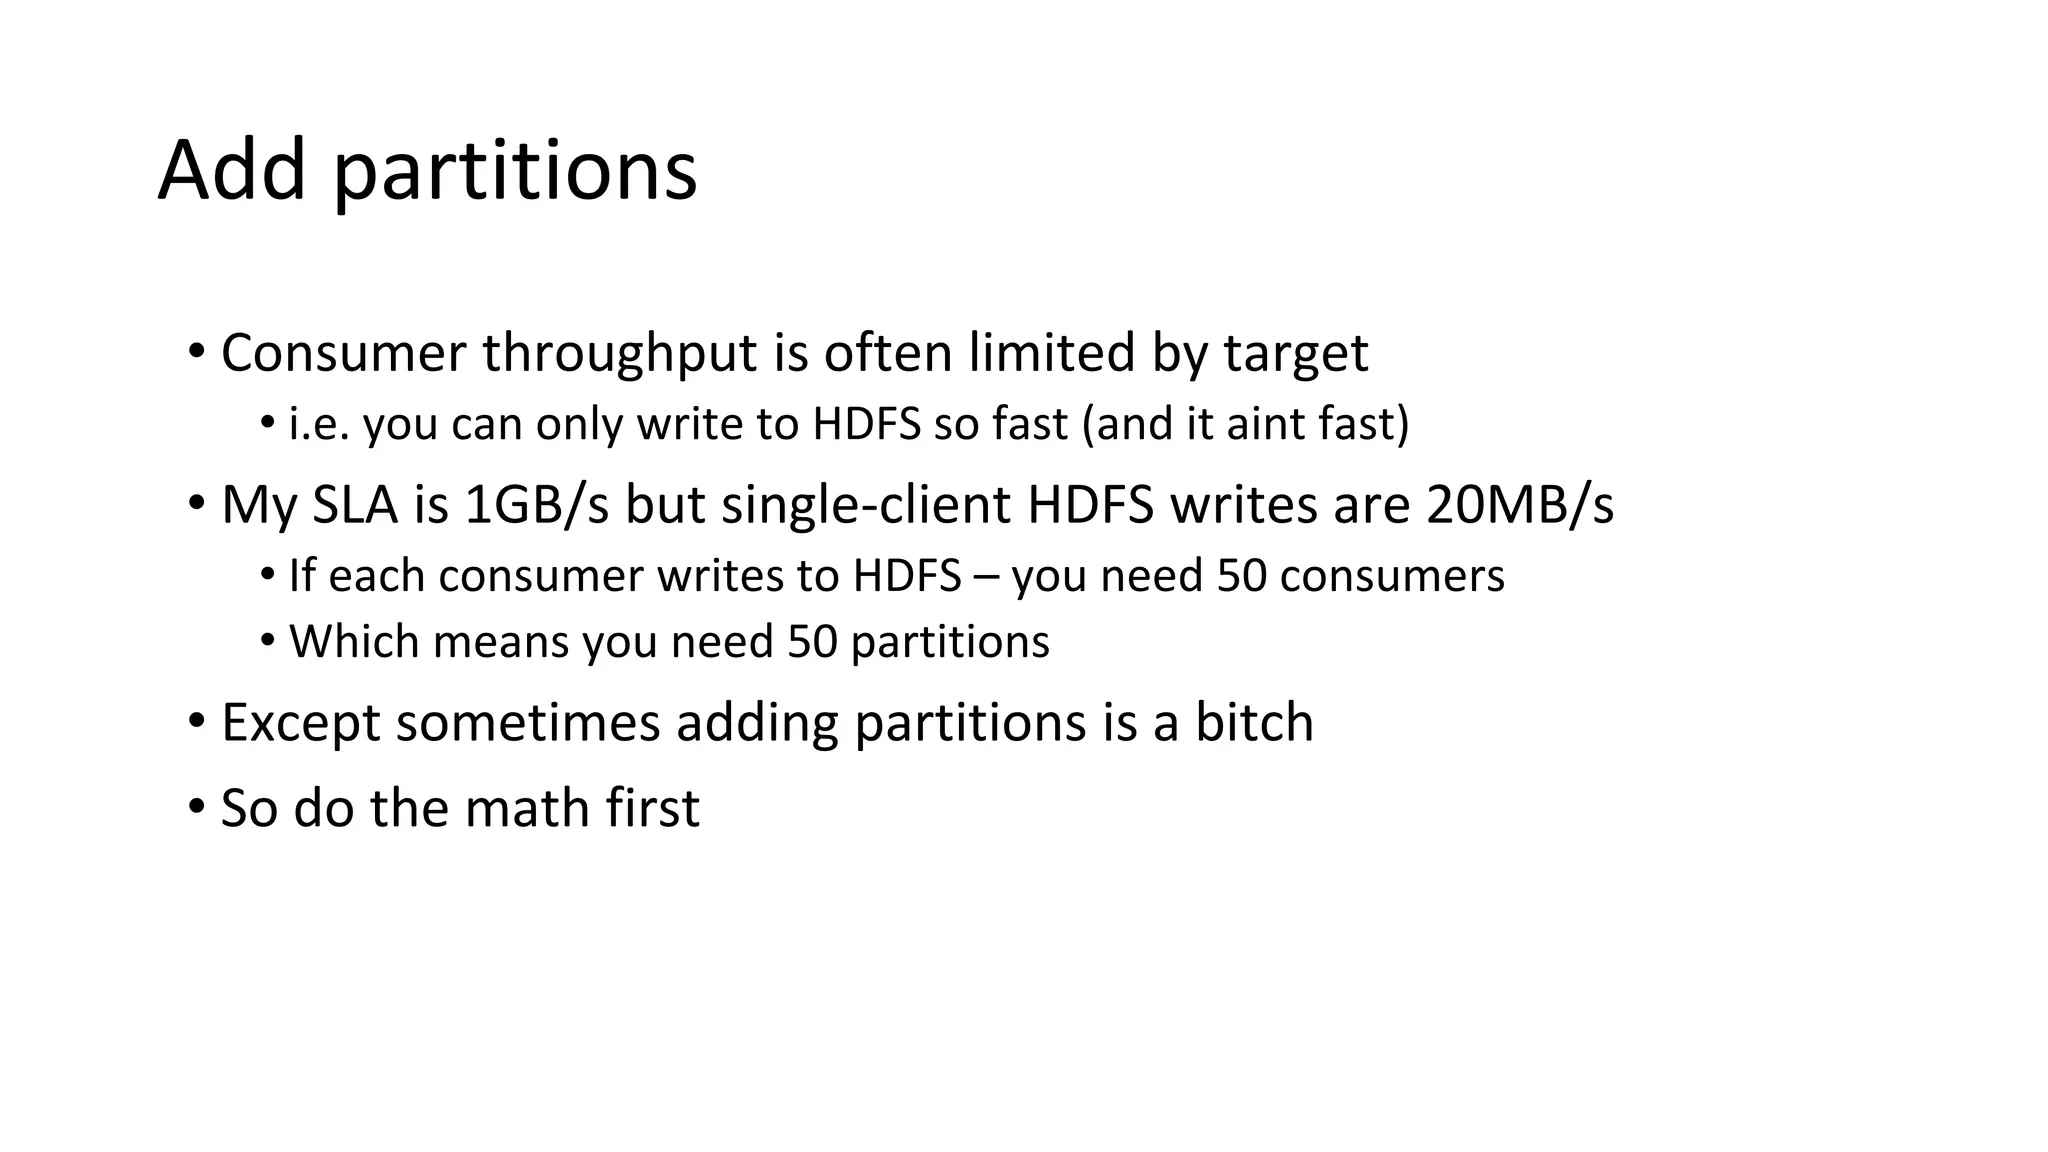
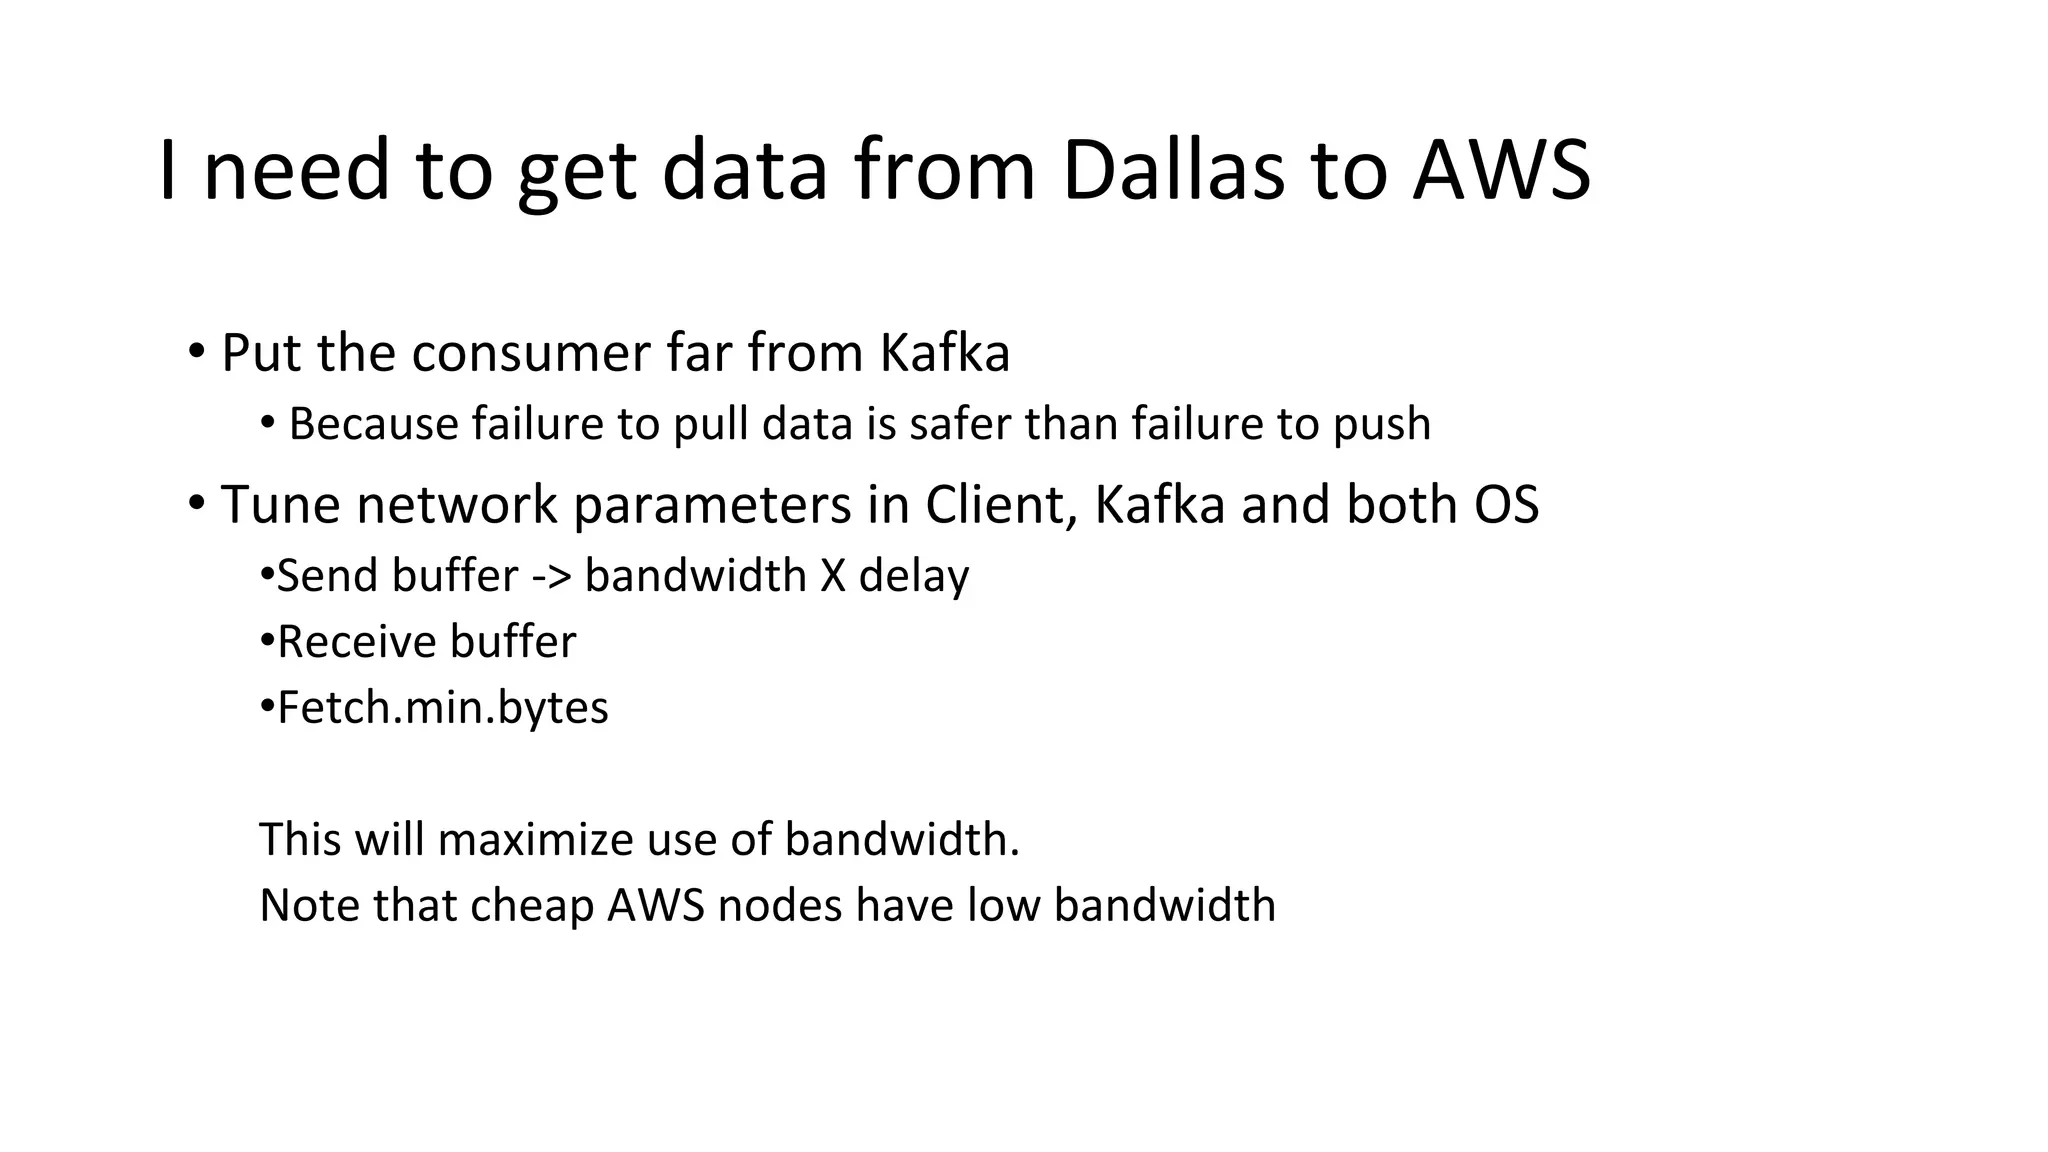
Details on managing partitions and ensuring optimal replication and performance within Kafka.Examines client-side factors affecting Kafka performance and strategies for optimizing consumer and producer performance.
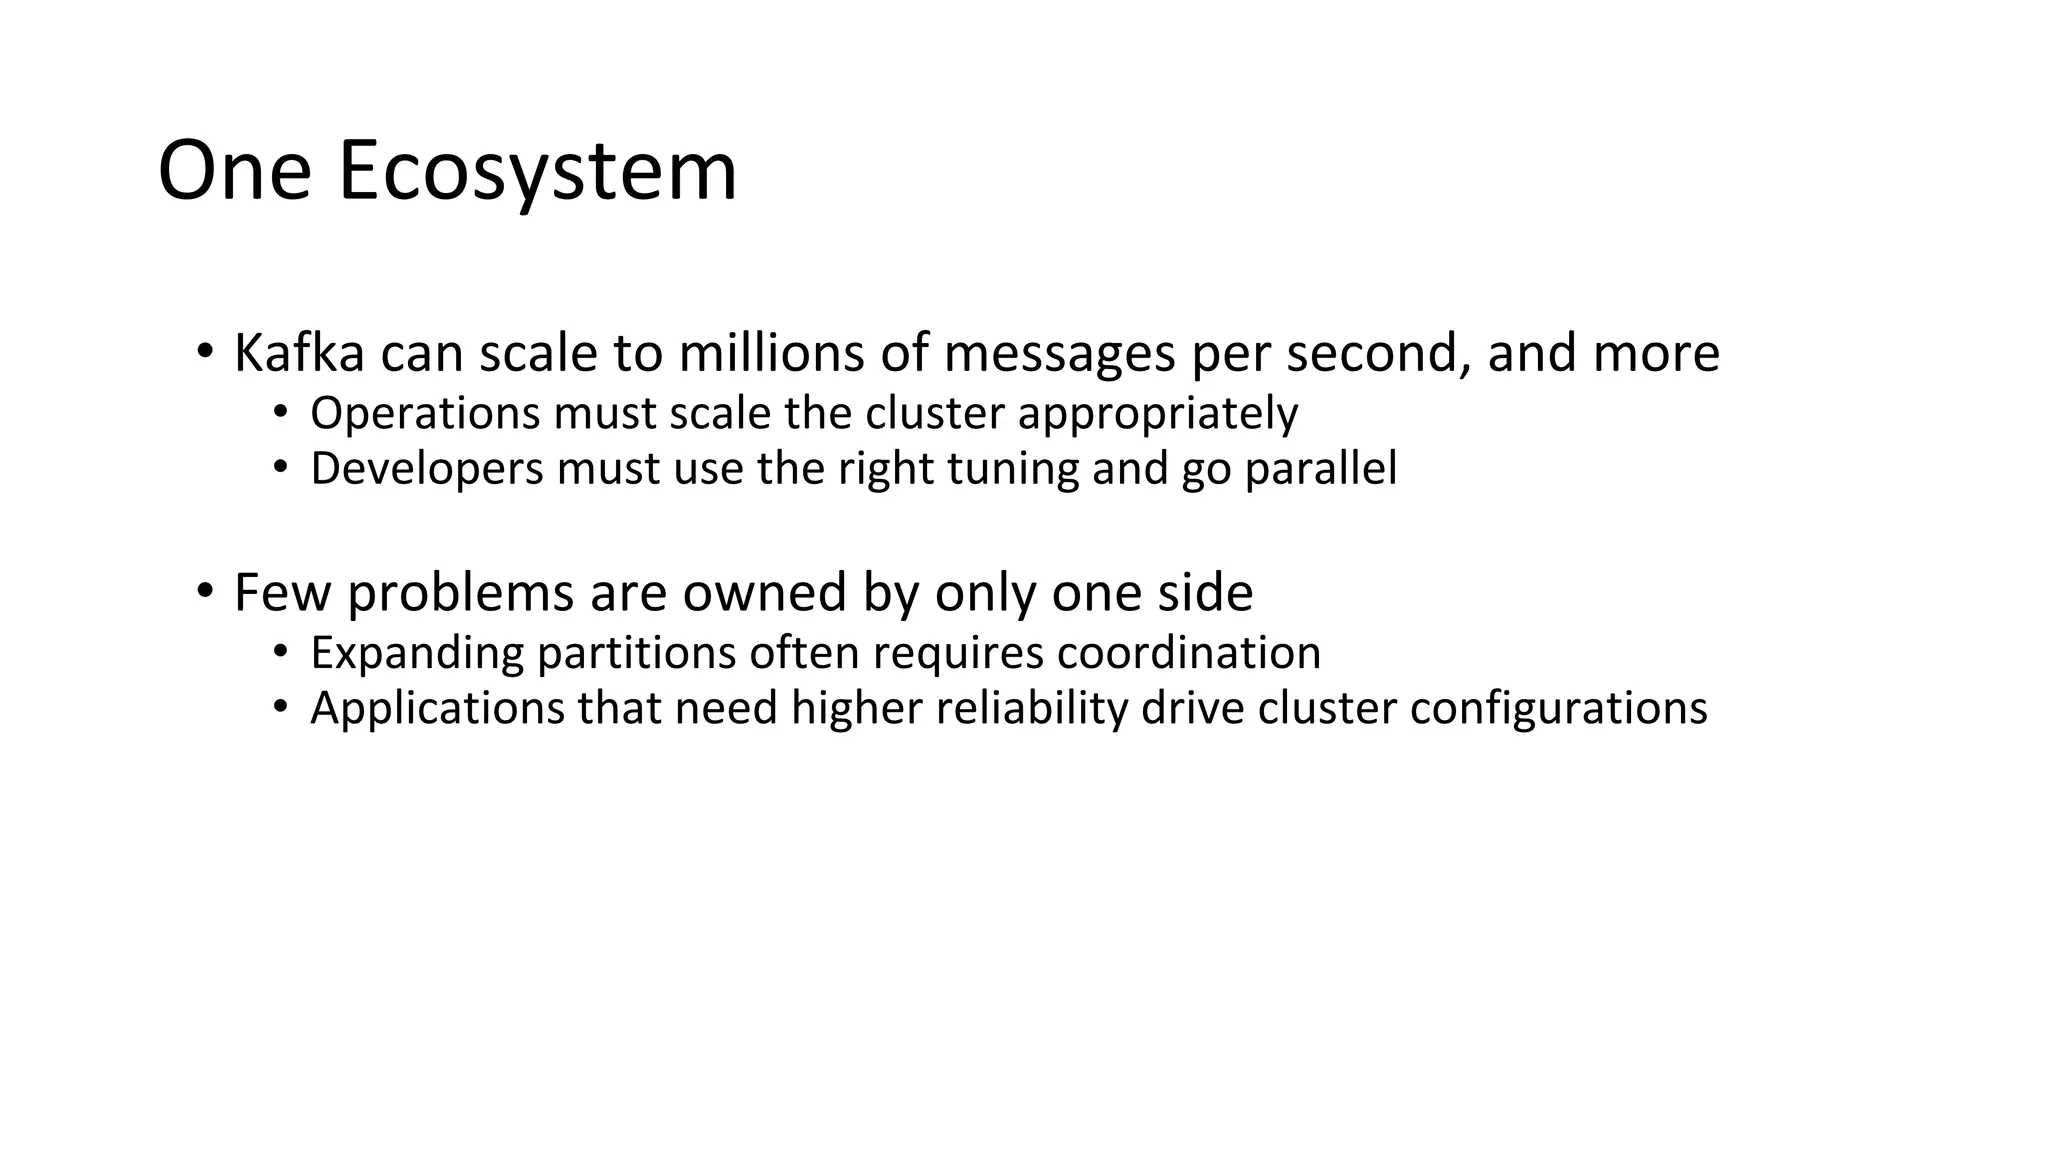
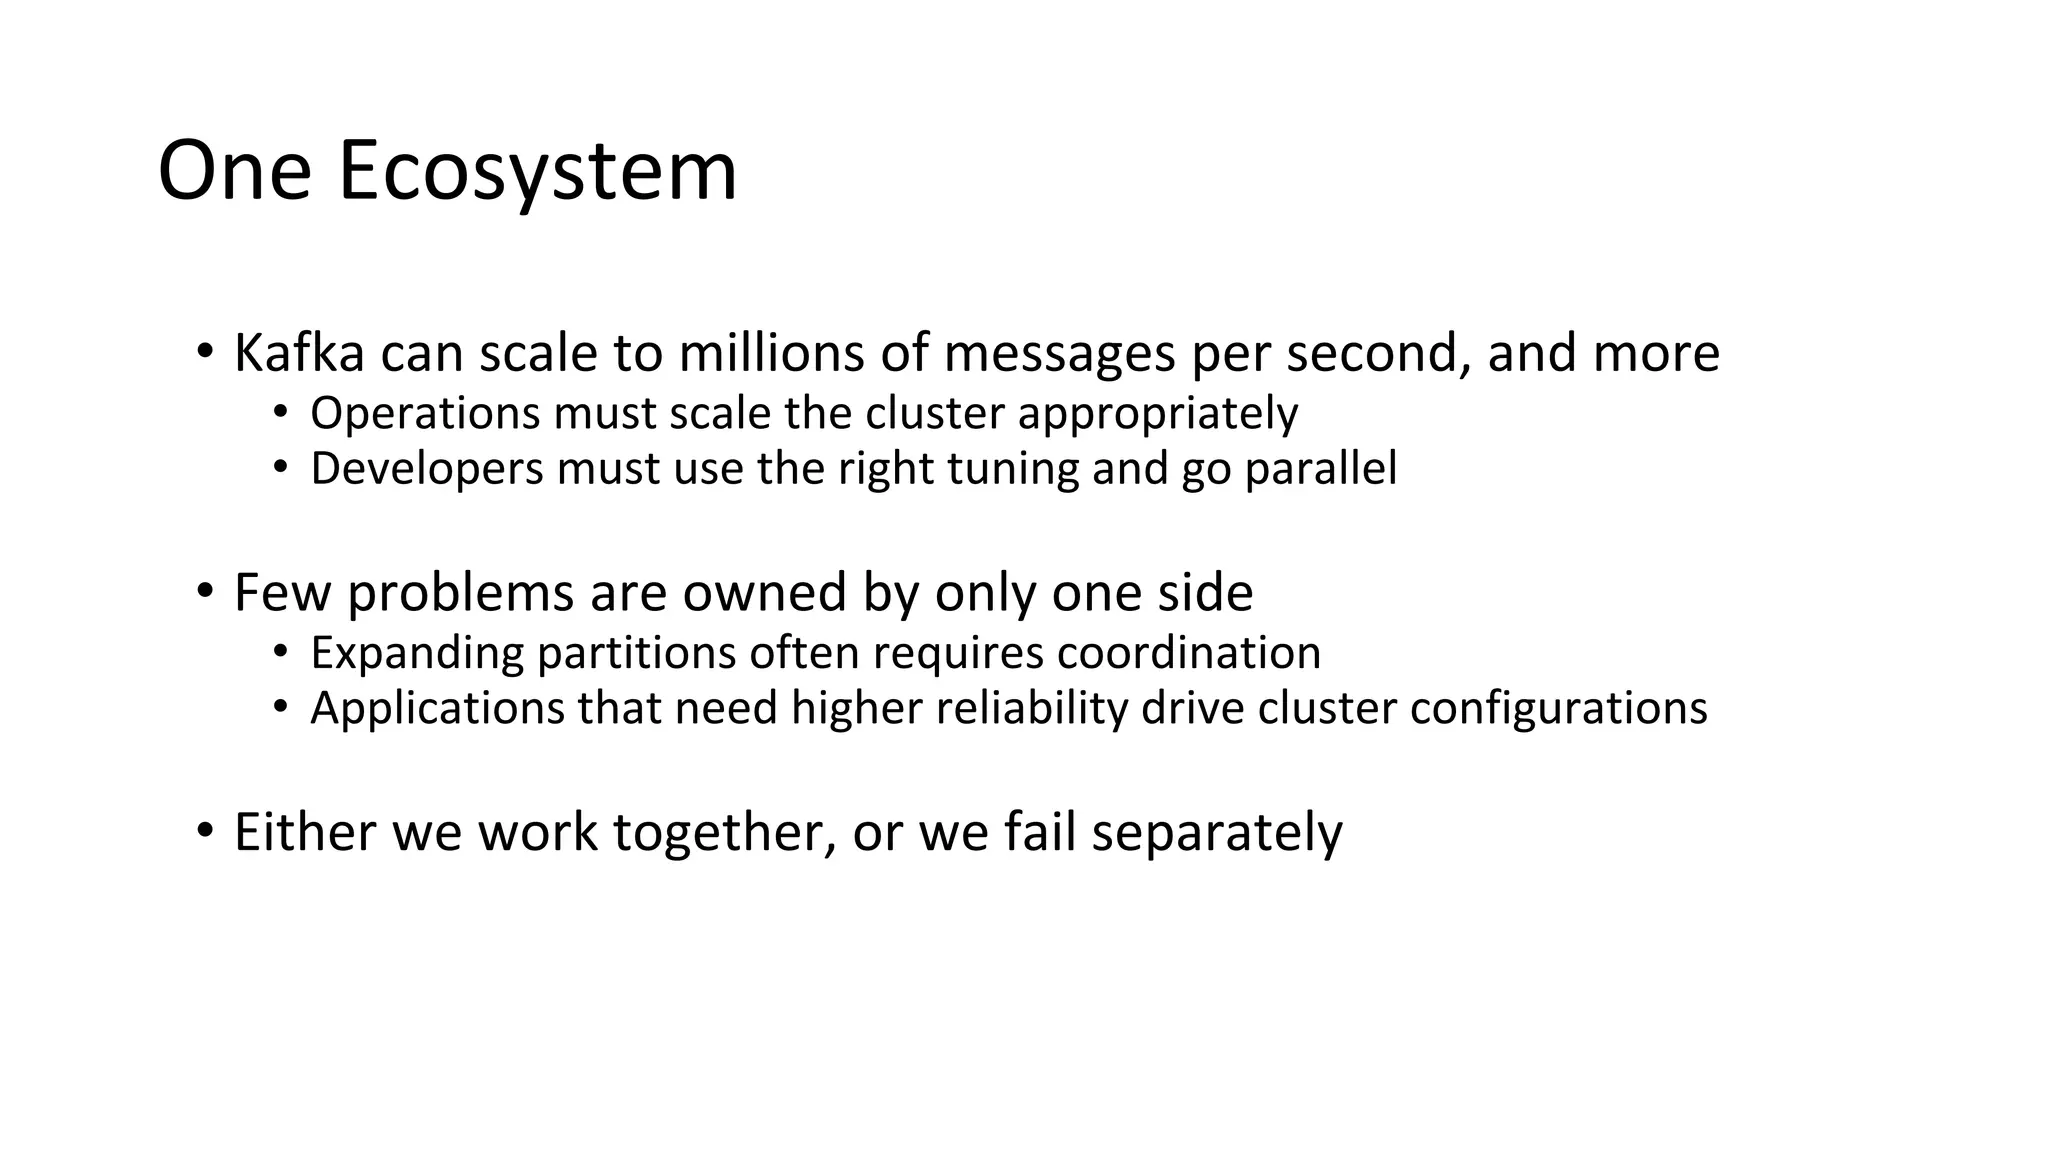
Wraps up the presentation emphasizing collaboration between operations and development for successful Kafka management.
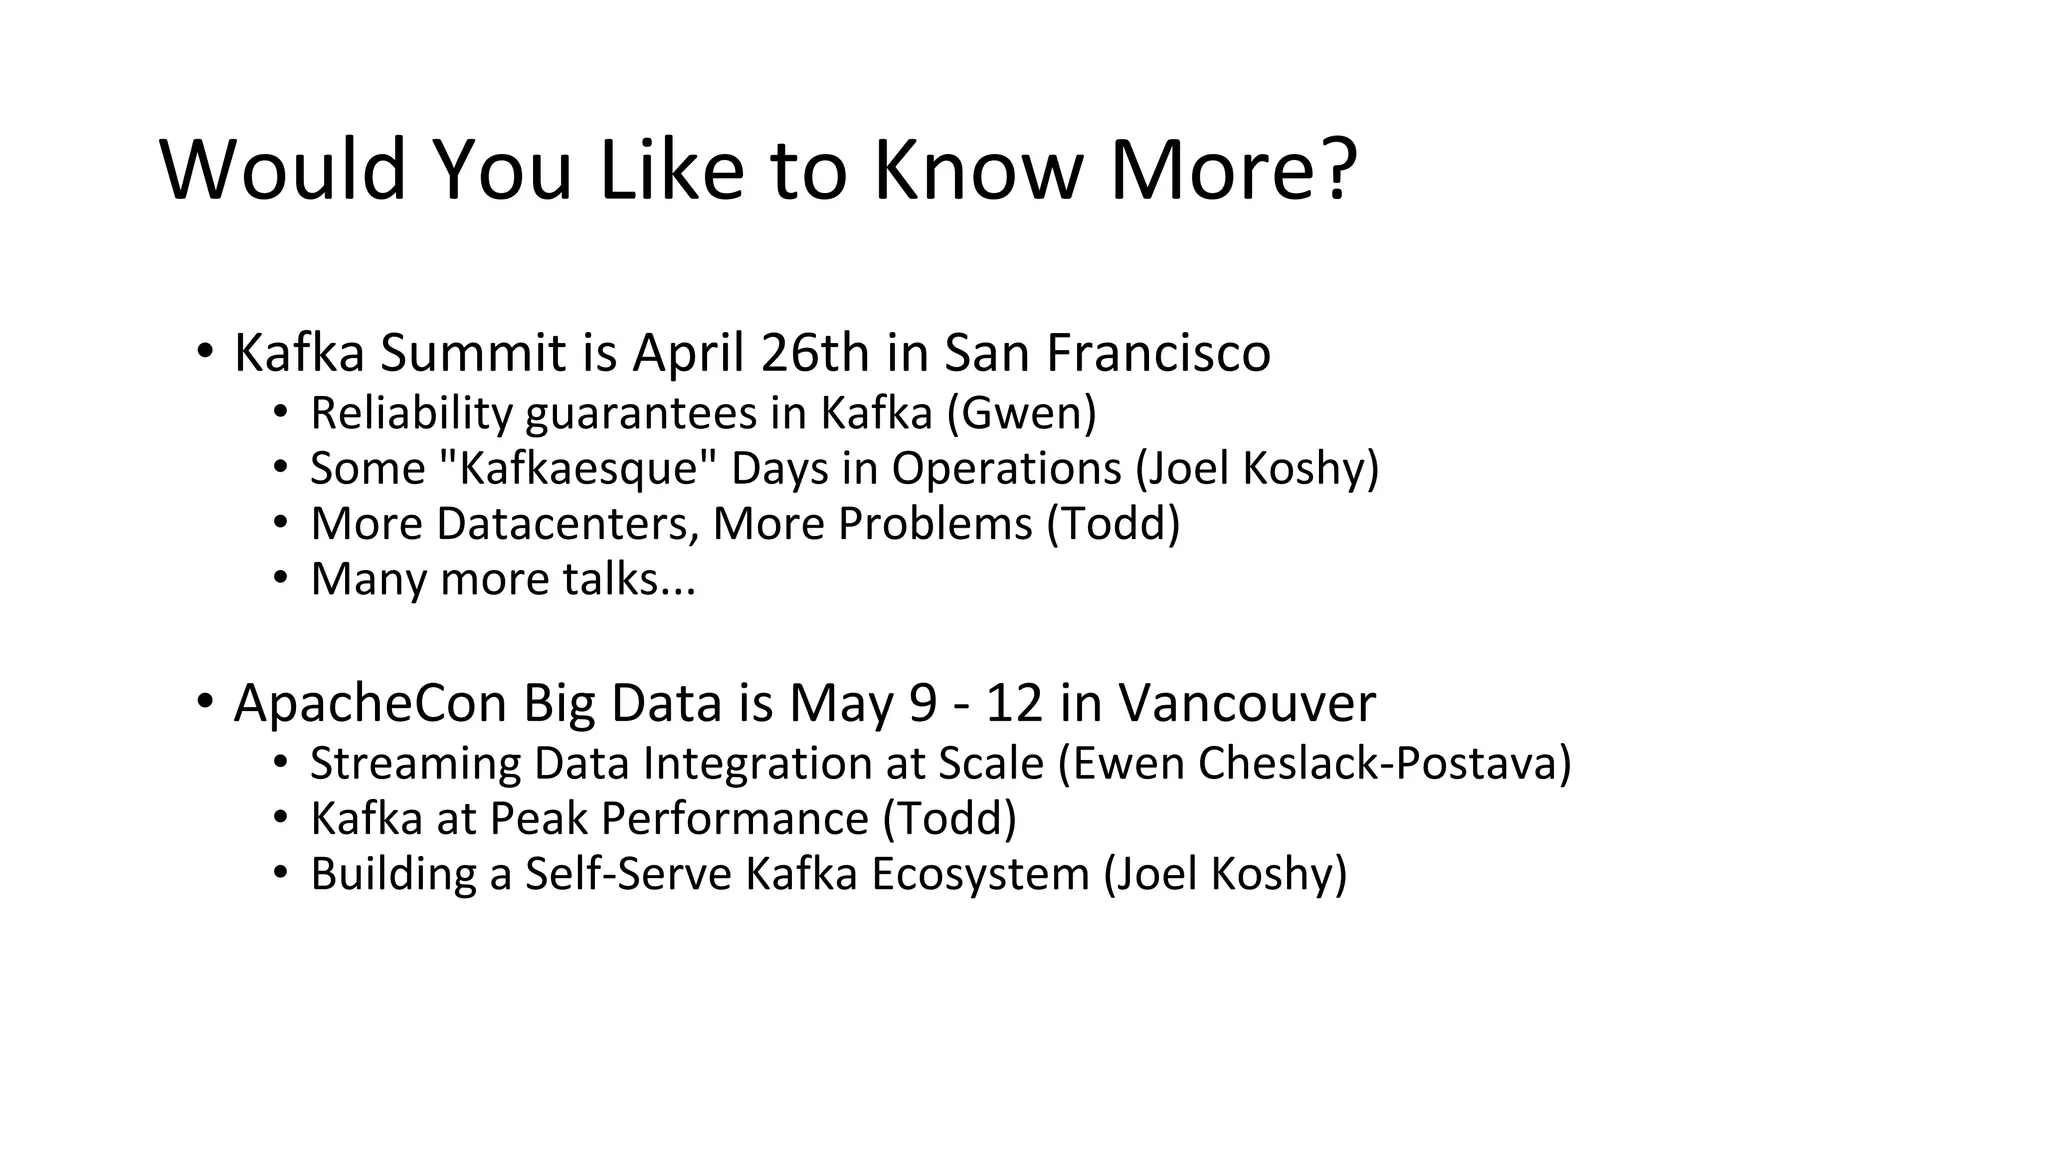
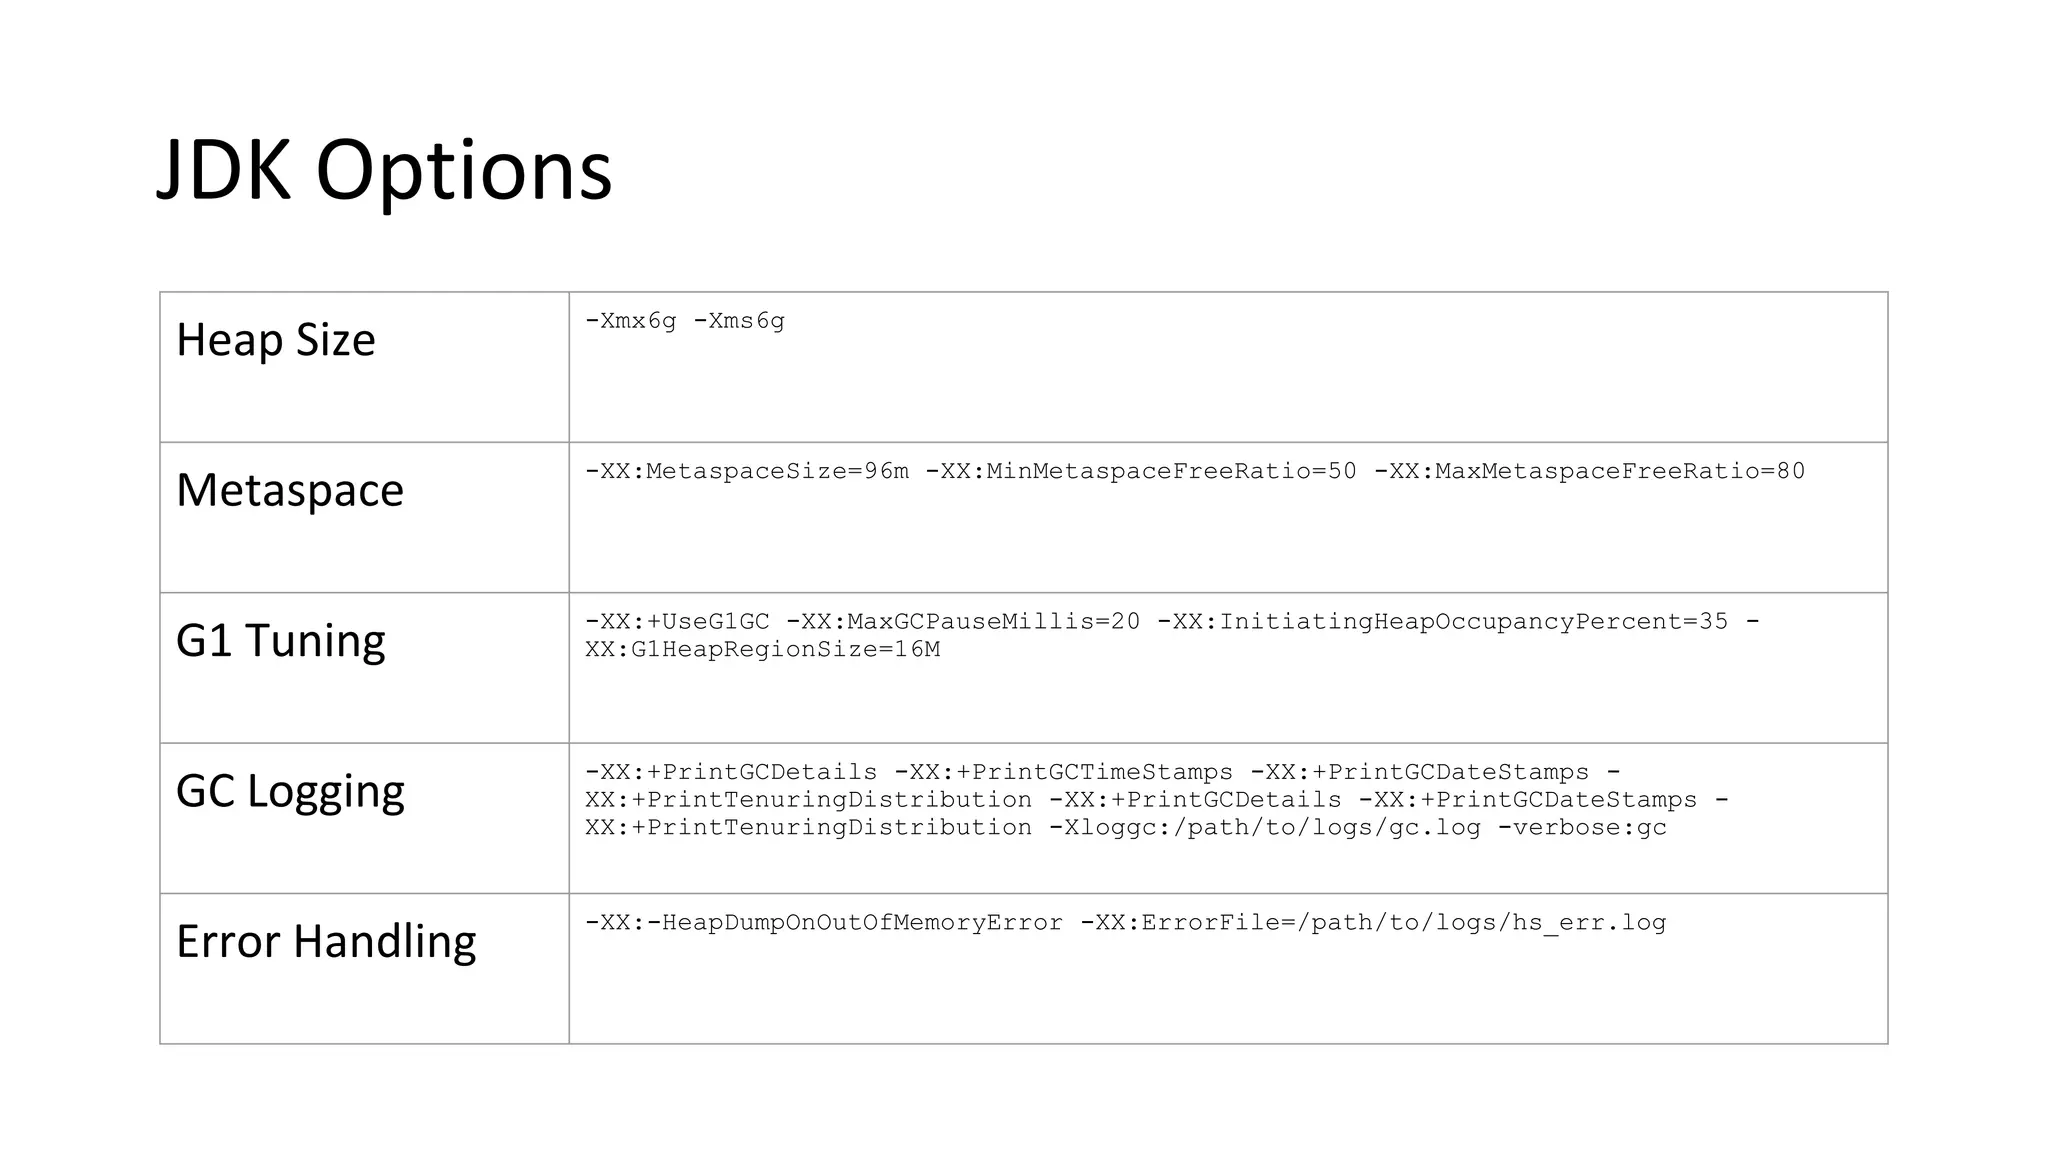
Information on upcoming Kafka-related events and detailed technical configurations for optimizing Kafka performance.


![[DSC Europe 25] Boris Perkovic - Lost in performance.pptx](https://cdn.slidesharecdn.com/ss_thumbnails/uq5hrp7vsuahqkxzifux-1-251204082258-fd2ee09d-thumbnail.jpg?width=640&height=640&fit=bounds)
![[DSC Europe 25] Bogdan Daniel Maruneac - AI - It starts with you.pptx](https://cdn.slidesharecdn.com/ss_thumbnails/odov3snhrcqs9hx5ny2n-4-251205085715-f1daacfe-thumbnail.jpg?width=640&height=640&fit=bounds)

![[DSC Europe 25] Dragan Vucic - Building the Learning Organization - How AI Tr...](https://cdn.slidesharecdn.com/ss_thumbnails/8brigo2sbu6qur6gxrra-7-251205085715-6ae07d24-thumbnail.jpg?width=640&height=640&fit=bounds)
![[DSC Europe 25] Andy Cotgreave - Nothing is new in analytics.pptx](https://cdn.slidesharecdn.com/ss_thumbnails/mba4vzcurvoh5lfrd5zw-6-251205194645-341bbbbe-thumbnail.jpg?width=640&height=640&fit=bounds)


![[DSC Europe 25] Dragana Ilic - AI for Big Data in Astronomy.pptx](https://cdn.slidesharecdn.com/ss_thumbnails/8palya86qaatvjhva1ms-2-dragana-ilic-ai-ilic-251208151906-652b819c-thumbnail.jpg?width=640&height=640&fit=bounds)


![[DSC Europe 25] Petar Zivanov - AI meets documents From chatbots to AI-powere...](https://cdn.slidesharecdn.com/ss_thumbnails/xer2bb6nrdc8pdpev0pc-8-251204082258-7c2fa4a1-thumbnail.jpg?width=640&height=640&fit=bounds)


![[DSC Europe 25] Marija Vlajkovic & Andrea Radonjanin - Integration of AI tool...](https://cdn.slidesharecdn.com/ss_thumbnails/qf1jrglttoc3bm8s3aop-final-integration-of-ai-tools-251208151905-394f3a6a-thumbnail.jpg?width=640&height=640&fit=bounds)