Download to read offline

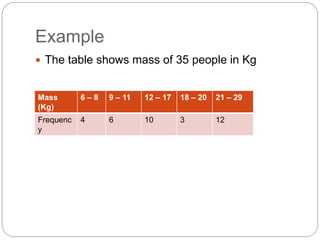
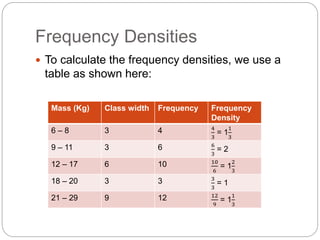
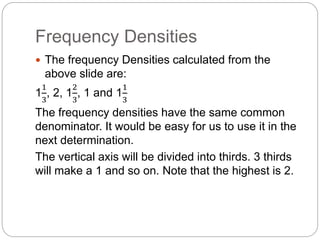


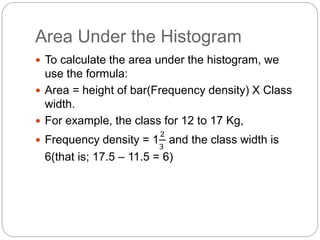
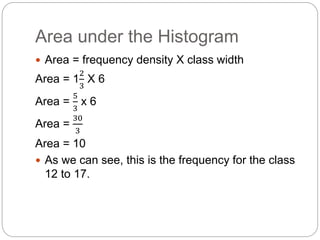


1) Frequency density is calculated by taking the frequency and dividing it by the class width. This allows frequencies to be presented in a more compact way. 2) Using data on the mass of 35 people, the document calculates the frequency densities for different mass ranges. The densities are 1/3, 2/3, 1/2, 1, and 1/3. 3) A histogram is drawn with the mass ranges on the x-axis and the frequency densities on the y-axis. The area under the histogram represents the total frequency, and is calculated by multiplying the frequency density by the class width for each range.


