1. The study analyzed genetic data from over 377,000 UK Biobank participants to investigate the association between the CADM2 gene and physical activity levels.
2. Results showed the CADM2 gene was independently associated with sufficient physical activity, defined as at least 2-3 days per week of strenuous exercise, and this association was not influenced by risk-taking behavior.
3. Further analysis found the influence of CADM2 on physical activity levels differed between sexes, with a greater effect observed in younger women compared to younger men.
1. Discussion
Considerations:
1. Although there were three levels of PA, the SSOE
variable was constructed using the extremes (no
exercise at all and our definition of sufficient PA)
2. While the data supports SSOE being independent
of RiskTaker, more research is necessary prove
independence from each other, indicative of them
being two distinct outcomes of CADM2
Future Direction:
1. Adapt a generalized linear regression to fit three
levels of outcomes for SSOE
2. Other researchers can look into the underlying
biology of genes associated with PA behavior
3. Possible drug treatment to stimulate PA, especially
when needed acutely
4. Utility in precision medicine that could direct
individuals to the best exercise type for them
Implications:
• Better understanding of why some people are more
physically active than others
• Exploration of the biological mechanisms of PA
Physical Activity: Blame Your Genes! – Analysis of CADM2
Tingting Thompson1, Dr. Yann Klimentidis2
1University of Arizona Honors College, 2Department of Epidemiology and Biostatistics, 2Mel and Enid Zuckerman College of Public Health
Methods Results
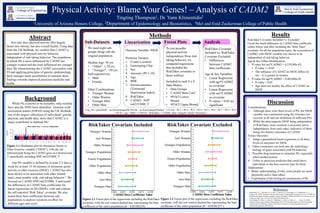
RiskTaker Covariate Included vs. Excluded:
Given the small difference in CADM2 beta coefficient
values before and after including the ‘Risk Taker’
covariate, for all the population types, the association of
CADM2 with SSOE variable was shown to be
independent of risk taking behavior.
Age & Sex Effect Modification:
1. P-value for sex*CADM2 = 6.235269e-03
• P-value << 0.05
• The influence of CADM2 on SSOE differs by
sex – it is greater in women
2. P-value for age*CADM2 = 8.401606e-01
• P-value > 0.05
• Age does not modify the effect of CADM2 on
SSOE
Abstract
Not only does physical activity (PA) largely
factor into obesity, but also overall health. Using data
from the UK Biobank, we confirm that CADM2 is
associated with physical activity behavior
independent of risk taking behavior. The population
in whom PA is most influenced by CADM2 are
younger women and the least influenced are younger
men. By characterizing the CADM2 association with
PA and applying principles of genetic epidemiology,
there emerges many possibilities to translate these
findings towards improved precision medicine and
health.
References
1. Klimentidis, Y. C., Raichlen, D. A., Bea, J., Garcia, D. O., Wineinger, N. E., Mandarino, L. J., . . .
Going, S. B. (2018). Genome-wide association study of habitual physical activity in over 377,000 UK
Biobank participants identifies multiple variants including CADM2 and APOE. International Journal
of Obesity,42(6), 1161-1176. doi:10.1038/s41366-018-0120-3
2. Strawbridge, R., Ward, J., Cullen, B., Tunbridge, E., Hartz, S., Bierut, L., . . . Smith, D. (2018).
Genome-Wide Analysis Of Risk-Taking Behaviour In 116 255 Individuals From The Uk Biobank
Cohort And Cross-Disorder Genetic Correlations. European Neuropsychopharmacology,29.
doi:10.1016/j.euroneuro.2017.08.356
Background
While PA is known to be heritable, only recently
have specific SNPs been identified . Genome-wide
association studies (GWAS) using the UK Biobank,
one of the largest collections of individuals’ genetic,
physical, and health data, show that CADM2 is a
major contributor to habitual PA1.
Our PA variable is defined by at least 2-3 days a
week for at least 15-30 minutes of strenuous sports
activity or other exercise (SSOE). CADM2 has also
been shown to be associated with other related
traits, most notably with risk-taking behavior 2. We
focused on CADM2 SNP rs62253088_T and tested
the differences in CADM2 beta coefficients for
linear regressions on PA (SSOE), with and without
the self-reported ‘Risk Taker’ covariate. We also
tested these beta coefficients between sub-
populations to analyze variation in effect for
different ages and sexes.
RiskTaker Covariate Included RiskTaker Covariate Excluded
*reg_OG<-glm(SSOE ~ as.factor(merged3$f.54.0.0) + as.factor(merged3$chip) + f.31.0.0 + PC1 + PC2 + PC3 + PC4 + PC5 + PC6 + PC7 + PC8 + PC9
+ PC10 + age + BMI + f.189.0.0 + RiskTaker + CADM2, data= merged3, family='binomial' )
Sub-Datasets Linearization Forest Plots Analysis
We used eight sub-
groups along side the
original population.
Median Age: 58 yrs
• “Older”: ≥ 58 yrs
• “Younger”: <58 yrs
Self-reported sex:
• Male
• Female
Other Combinations:
• Younger Women
• Older Women
• Younger Men
• Older Men
Outcome Variable: SSOE
Predictor Variates:
1. Center Location
2. Genotyping Chip
3. Sex
4. Ancestry (PC1-10)
5. Age
6. BMI
7. Socioeconomics
(Townsend
Deprivation Index)
8. RiskTaker
9. CADM2– SNP
rs62253088_T
To test possible
physical-activity
independence from risk-
taking behavior, we
compared regressions
that included the
RiskTaker covariate to
those without.
Included in each 9 x 4
Data Matrix:
• Data Groups
• CADM2 Beta Coef
• 95%CI Lower
Bound
• 95%CI Upper Bound
RiskTaker Covariate
Included vs. RiskTaker
Covariate Excluded:
• Differences
between CADM2
beta coefficients
Age & Sex Variables:
• Linear Regression
with age*CADM2
as covariate
• Linear Regression
with sex*CADM2
as covariate
• P-values < 0.05 are
significant
Figure 1.1 Manhattan plot for Strenuous Sports or
Other Exercise variable (“SSOE”), with the tall
leftward peak being the CADM2 gene on Chromosome
3, specifically including SNP rs62253088_T.
Figure 2.1 Forest plot of the regressions including the RiskTaker
covariate, with the red vertical dashed-line representing the beta
coefficient of the entire population (ß = 0.05186229).
Figure 2.2 Forest plot of the regressions excluding the RiskTaker
covariate, with the red vertical dashed-line representing the beta
coefficient of the entire population (ß = 0.05302237 ).