SlideShare a Scribd company logo
1 of 45
Download to read offline
1
5. Groundwater and Groundwater Measurement Methods – CE/ENVE 320-04
Ground water sample acquisition is a key phase of many environmental investigations in natural
systems. The sample acquisition process for ground water samples has been previously discussed. In
addition to ground water sample collection, an understanding of ground water flow in aquifer systems
is critically important in determining ability of a specific aquifer to meet the needs of a public water
supply or transport or impede the flow of contaminated ground water due to ground water
contamination.
This section will begin with an introduction to groundwater from a hydrological prospective. We will
introduce some of the basic terms in hydrology and aquifer systems as well as the key components to
ground water flow and the important parameters in determining flow rates in ground water systems.
Hydrology is the science of water occurrence, movement and transport. Hydrogeology is the part of
hydrology that deals with the occurrence, movement and quality of water beneath the Earth's surface.
Because hydrogeology deals with water in a complex subsurface environment, it is a complex science.
On the other hand, much of its basic terminology and principles can be understood readily by non-
hydrogeologists.
This section presents basic terms and principles of hydrogeology. The first section introduces many
key terms and concepts in definition form. Subsequent definitions include graphics to aid in
explanation. The following sections introduce principles of a ground water movement, using these
terms. Graphics are included to further define terms and illustrate concepts.
Ground water is water held within the interconnected openings of saturated rock beneath the land
surface.
The hydrologic cycle shows that when rain falls to the ground, some water flows along the land
surface to streams or lakes, some water evaporates into the atmosphere, some is taken up by plants,
2
and some seeps into the ground. As water begins to seep into the ground, it enters a zone that contains
both water and air, referred to as the unsaturated zone or vadose zone. The upper part of this zone,
known as the root zone or soil zone, supports plant growth and is crisscrossed by living roots, holes
left by decayed roots, and animal and worm burrows. Below lies an intermediate zone, followed by a
saturated capillary fringe, which results from the attraction between water and rocks. As a result of this
attraction, water clings as a film on the surface of rock particles.
Water moves through the unsaturated zone into the saturated zone, where all the interconnected
openings between rock particles are filled with water. It is within this saturated zone that the term
"ground water" is correctly applied. Ground water is held in aquifers, which are discussed in the
following sections.
Ground water is often thought of as an underground river or lake. Only in caves or within lava flows
does ground water occur this way.
Instead, ground water is usually held in
porous soil or rock materials, much the
same way water is held in a sponge.
Unconfined Aquifers
In unconfined aquifers, the
ground water only partially
fills the aquifer and the
upper surface of the ground
water (the water table) is
free to rise and decline.
The ground water is at
atmospheric pressure. The
height of the water table
will be the same as the
water level in a well
constructed in that
unconfined aquifer. The
water table typically
mimics, in a subdued way,
the topography of the land surface above, resulting in a water table with hills, valleys, or flat areas. It is
3
important to note that unconfined aquifers, especially those close to the surface, can be vulnerable to
contamination from activities on the land surface.
Confined Aquifers
Confined aquifers may also be referred to as artesian aquifers.
A confined aquifer is sandwiched between confining beds (layers of impermeable materials such as
clay which impede the movement of water into and out of the aquifer). Because of the confining beds,
ground water in these aquifers is under high pressure. Because of the high pressure, the water level in a
well will rise to a level higher than the water level at the top of the aquifer. The water level in the well
is referred to as the potentiometic surface or pressure surface.
Even in a confined aquifer, water seeks its own level. Geological strata are not perfectly horizontal. At
some point the lithological unit that comprises the confined aquifer is exposed to the surface. This is
the aquifer'srecharge zone, and it may be miles away from where one hopes to construct a well. The
"confined" aquifer is actually unconfined at the recharge zone. In order for pressure to build, the water
level in the recharge zone must be at a higher elevation than the base of the confining unit. When a
well is drilled through the confining unit, usually far from the recharge zone, the water in this well will
rise to the level of the water at the recharge zone. In some instances this may be above the surface of
the ground, in which case the well is called aflowing artesian well. This same situation, where the level
of the water at the recharge zone is above the base of the confining unit, leads to the appearance of
springsor seeps where the confining unit is penetrated by a hillside.
It is important to note that confining beds not only serve to hamper the movement of water into and out
of the aquifer, they also serve as a barrier to the flow of contaminants from overlying unconfined
aquifers. For this same reason, however, contaminants that reach a confined aquifer through a poorly
constructed well or through natural seepage, can be extremely difficult and expensive to remove.
This section introduces the basic concepts of ground water and surface-water interactions, the
meaning of water levels in piezometers and wells, and the measurement of water level and discharge.
Surface Expressions of Ground Water
Whether streams, ponds, lakes, or oceans, any surface-water bodies are likely to be surface expressions of
ground water. Some, like puddles after a rainstorm, are ephemeral, or short-lived. Others, like the oceans,
are perennial, or long-lasting. In either case, we may gain valuable information about subsurface
conditions by examining surface-water/ground water interactions.
In some cases and under some conditions, surface water is moving toward ground water. This is the case
with losing streams, and it also may be true for losing ponds, lakes, wetlands, or puddles. The opposite
condition might also exist: Water might be moving from ground water toward the surface "gaining"
stream, pond, wetland, or other water body.
4
To determine the direction of movement, consider water levels in wells or piezometers near the surface-
water body. The wells or piezometers must be open to the same body of rock or sediment that holds the
surface water, and they must be hydraulically connected. A lower level in the wells indicates that the
surface- water body is losing, whereas a higher level in the wells indicates that it is gaining (see figure
below). Temperature may be another indicator. In temperate regions, ground water tends to be colder than
surface water during the summer and warmer than surface water during the winter. Some environments in
which this would not be true would be zones of hydrothermal activity (e.g., hot springs), or areas where
the surface water originates as melt water from glaciers. Differences in water chemistry might indicate
flow directions, as well.
Any time a surface-water body appears to be
losing water to the ground water, c6nsider
the possibility that the surface water may be
perched. In this situation, the rate at which
water is added to the surface water exceeds
the rate at which the underlying rock or
sediment can transmit or "drain" the surface
water. For example, a heavy rain or sudden
snowmelt might cause a temporary pond to
form on clay-rich soil. A clay lens near the
surface in some glacial materials might cause
the formation of a perpetual wetland at the
surface, whereas the regional water table lies
much farther below.
Subsurface Expressions of Ground
Water
Geologists look for outcrops of rock to
provide clues about subsurface geology. But
where no outcrops exist, their information
may come from drillhole data. Likewise,
hydrogeologists can learn a great deal from
"outcrops" of ground water: springs, seeps,
and some other surface-water bodies. But
where no hydrogeologic outcrop exists,
hydrogeologists must rely on data from holes
drilled to puncture the ground water's surface and allow us to examine its nature.
Why Is This the Water Level?
Ask that question any time you encounter a water level, whether surficial or sub-surficial. If surface water,
is it gaining or losing? If subsurface, is the water level from an aquifer or aquitard? If an aquifer, is it
confined, semiconfined, or unconfined? Is the water level the result of flow from fractures? Is it from a
cave, mine, conduit, tunnel, pipeline, or drainage tile? Was the water level measured in a piezometer? A
well? What is the screened or open interval in the well?
5
One fairly unusual subsurface expression of ground water is water in caves or caverns. Some of these hold
subsurface springs, streams, and ponds. Of course, these features occur only where large underground
openings exist, and they are particularly likely to be in karst regions. Other underground conduits might
not be natural. For example, such human-made features as tunnels, underground mines, or buried conduits
or pipes might be affected by ground water. In these cases, consider how permeable the walls of the
opening are, and particularly with mines or pipes, consider whether water is actively being pumped or
drained from the opening.
Perhaps more common than these features are holes we put in the ground to find the water level.
Piezometers and wells are the cornerstones of hydrogeologic data.
Water Levels in Piezometers
A piezometer is a pipe installed in the ground, and it has a very short (less than 1 ft) intake, or
screened or open interval. It may even have no screen at all. A piezometer is installed specifically for
the purpose of determining hydraulic head at a specific point within an aquifer or aquitard. The
bottom opening of the piezometer, or its intake, is the point at which it makes the measurement.
The water level in a piezometer generally does not give
directly the position of the water table or potentiometric
surface. (Potentiometric surface is referred to as "piezometric"
surface in some texts.) A piezometer gives the location of the
water table only if its
intake is positioned such
that it barely penetrates
the water table (see figure
to left). The likelihood
that this will occur
probably is not great. If it
does occur, it probably
will be coincidental, and
so piezometers are most
useful when their screens
are below the water table.
However, hydraulic head
varies vertically. As a
result, if a piezometer is installed with its intake more than a few
feet below the water table, vertical components of flow will prevent
it from giving the water table location directly.
When enough hydraulic head values are available, taken from
multiple piezometers, a flow net may be constructed from the data,
and the location of the water table or potentiometric surface may be
determined from the flow field.
6
Piezometer nests are groups of three or more piezometers installed side by side, but measuring hydraulic
heads at various depths (see figure above). Reading the water levels in nested piezometers allows one to
determine the direction and magnitude of a vertical gradient. Begin by finding the difference in head (H)
between two of the piezometers; usually, this is the difference in elevation (above a datum) of water
levels in the piezometers. Next, find the distance (dl) between the points at which the piezometers are
open to the ground water.
The gradient is M/ dl, and the direction of the gradient is from
the opening in the piezometer with the higher water level to the
opening in the piezometer with the lower level (see figure to
right).
Piezometers may be regarded as small-diameter wells, and as
such, they may not be well-suited for sampling for chemical
analysis, because their intakes usually are too short to allow for
easy flow of water into and out of the piezometer. For the same
reason, piezometers are not appropriate for performing
pumping tests or other tasks requiring pumping large volumes
of fluid from an aquifer, such as contaminant recovery. They
may, however, be suitable for slug or bail tests.
Water Levels in Wells
A well is a pipe installed in the ground, and it has a longer
intake than does a piezometer. The optimal length of a well
intake depends on desired yield and formation characteristics.
Wells are installed for the purpose of extracting ground water, whether for domestic or municipal use, or
irrigation; for pumping tests; for extracting samples for chemical analyses; for product recovery;
dewatering an area for construction or engineering purposes; or for injecting fluids, as in a recharge well
or waste-injection well.
The water level in a well indicates the conditions through the screened or open interval of the well. The
water level in the well might be above, at, or below the ground surface. When the well water level is
above the ground surface, it indicates that the screened or open interval is under confining conditions.
When the well water level is at or below ground surface, it may indicate one of two things. First, it might
indicate that the open or screened interval is not under confining conditions; the aquifer is unconfined.
Or, second, it might indicate that the aquifer is confined, but that the confining pressure does not create
enough head to drive the well water above ground level. Drill hole data, geologic maps and cross-
sections, or hydraulic testing of the well might be used to determine which of these conditions is present.
In unconfined aquifers, when the intake is short (no more than a few meters) and it intersects the water
table, the level of water in the well indicates that of the water table. But if the screened or open interval is
longer, or if the top of that interval is positioned below the water table, the water level in the well does
7
not give the level of the water table. Instead, the water level reflects conditions only for that screened or
open interval (see figure below). To locate the position of the water table, a piezometer nest or a well of
appropriate design must be used.
Finding Wells
To find already-existing wells in the field, the easiest place to start is to ask the property owner where the
wells are. Another source of information is maps of locations given on site plans or in drilling logs.
Government agencies might have logs that indicate location. In the field, look for pipes sticking up out of
the ground, or plates mounted flush with ground surface. Look for stone- or concrete-lined access pits,
possibly covered by wood or metal sheeting. Follow water supply lines leading out of houses or other
buildings. Be aware that wells may be inside buildings. Look for stone or clay tile drainage ways. Look
for windmills or wind- lasses that may have been used to pump water out of the ground; be aware that
windmills also might be used for generating electricity or grinding grain. Look for storage tanks, water
towers, or pumping facilities; any of these might lead you to a well.
Well Depth
The depth of a well is the vertical distance
from the bottom of the well to the surface.
In order to keep measurements consistent,
establish some reference point at the
surface. The reference point might be the
top of the well casing (TOC), or it might be
ground level (grade).
The depth of a well should be recorded on
the well construction diagram or log.
However, each time the water level is
measured, the well depth should be
determined by sounding, if possible. This
should be done because silt may have
settled in the bottom of a well, frost heave
may have damaged it, or well construction
diagrams may be unavailable or inaccurate.
In some wells, however, the presence of
pumps and discharge lines may make depth
sounding impossible.
To sound the bottom of a well, first check
the well construction diagram, if available. This will indicate the approximate depth. Then lower a
weighted cable or tape down the hole until it goes slack, and measure the cable length. It may be
convenient to use a water-level indicator for this purpose.
8
If the well has a pump installed in it, watch out for the pump lines. The line may accidentally become
wrapped around one of them and tangle. Do not play out too much line; it may have caught on
something, and as you continue unreeling it, it will just become more and more tangled.
Water-Level Measurements
Water-level measurements provide a basic piece of information used in hydrogeologic studies. Water
level may be a "static" level or a "pumping" level; a static level is measured when the well is not being
pumped, and has not been pumped for some time. A pumping level is measured when the well is being
pumped or has been pumped recently. The method for making a water-level measurement depends on
whether the well is flowing or nonflowing. This section describes some of these methods.
Measuring Water Level in Flowing Wells
In some wells, called flowing wells, water flows out the top of the well naturally and without any
pumping. The potentiometric surface associated with these wells is above the ground surface. If a well is
flowing, and it is necessary to know the elevation of the potentiometric surface in the aquifer tapped by
the well, the water level must be measured either directly or by taking a pressure measurement.
Direct Measurement. Direct measurement involves allowing the water to rise to the level of the
potentiometric surface and then measuring its height above ground surface. To use this method, a conduit
for the water to rise in must be provided. This method works only if it is physically possible to measure
the height above the ground surface. If it is more than about 8-10 ft above the ground, this will be
difficult.
Attach the conduit, which might be a pipe or piece of tubing, to the top of the well. It is critical that there
be no leaks at the joint or anywhere along the conduit. The pipe or tubing may be of any diameter; it is
perfectly acceptable for the tubing to be the small diameter, clear vinyl tubing commonly found in
laboratories, even if the well has a much larger diameter. Clear tubing has the added advantage of making
it easy to see the water level. Alternatively, a piece of PVC or metal pipe might be attached to the top of
the well; in this case, you will need to use some nonvisual method of finding water level. No matter what
type of conduit is used, it is not important that it be straight. The critical measurement is the elevation of
the water level above the ground, and the path it takes is not significant.
Measure the vertical distance between the ground surface and the water level in the conduit. Record the
water level as the distance in feet or meters above the ground surface. Based on survey data, this may be
referenced to a known datum, for example, mean sea level.
Equipment List
-Conduit and tools and materials for attaching it to the wellhead
-Tape measure
-Keys and tools to open well and locked gates
-Water-level indicator, if conduit is not transparent
-Well construction diagram and boring log
-Field notebook, pens, pencils, calculator
9
-Air monitoring devices, as needed
-Personal protective equipment, as needed
Pressure Measurement. To measure water
level in a flowing well by pressure
measurement, attach a pressure gauge to the
top of the well casing. Stop the flow of water
by capping the well; ensure that there are no
leaks. Because the well is capped off,
pressure or head measurements made in this
way are sometimes referred to as "shut-in
pressures" or "shut-in heads."
Read water pressure in units of length (feet or meters). Record this value as height of the water level
above the elevation of the pressure gauge. Note that the pressure gauge is not at ground level; measure
and record its elevation relative to ground level. If the gauge reads in units of pressure, such as psi
(pounds per square inch), this pressure measurement can be converted easily to a head measurement.
To do this, use the specific weight of water, 62.4 pounds per cubic foot (pcf). An example follows:
Head above measuring point gauge =
waterofweightspecific
readinggauge
...
.
Be sure to account for differences in units. For example, if the pressure gauge reads 10 psi, the head
can be calculated as follows:
Head = ==
ft
in
x
ft
in
x
lb
ft
x
in
lb
pcf
psi
1
.12
1
.12
4.62
1
.
10
4.62
10 3
2
23 ft
Equipment List
-Well cap with fitting to attach pressure gauge
-Pressure gauge
-Wrenches to attach well cap
-Keys and tools to open well and locked gates
-Well construction diagram and boring log
-Field notebook, pens, pencils, calculator
-Air-monitoring devices, as needed
-Personal protective equipment, as needed
Measuring Water Level in Nonflowing
Wells
In a nonflowing well, it usually is necessary to
lower a probe into the well to find the water level. Probes range from very simple to complex in their
construction.
10
Calibrated Lines. A weighted line is a simple means of finding depth to water. If chemical
composition or contamination of the well water is of no concern, the line may be coated with chalk at
its lower end. Ordinary classroom chalk works well for this purpose. Lower the line into the well until
it has reached the water. Mark the place on the line where it touches the reference point of your choice.
The top of casing (TOC) and the ground surface are two common choices; record which point is used,
and use the same point every time. Measure the length of the line from that point to the top of the
wetted portion, which is shown by the washed-off or wet chalk (see picture above). That measurement
is the depth to water from the reference point.
When using this method, it is helpful to use a line that has been calibrated to the nearest foot or meter
or less. Lower the line until the end is wetted and a whole number of feet or meters touches the
measuring point. Then simply subtract the length of the wetted portion.
Using a measuring tape as a chalk line eliminates the need for calibrating the line. A steel or fiberglass
tape with raised markings may be used, and the end may be chalked or the wetted portion may be
measured, without chalking. If using a fiberglass tape, be aware that the tape will stretch somewhat it
hangs down in the well. The tape manufacturer should be able to tell how m1tch stretch to expect; in
some cases, this information is printed right on the tape or housing. Be aware that wet fiberglass tape
can stick to the side of a well, making measurements difficult. Also, the weight on the end of the line
will displace water, thus raising the water level. This is particularly significant in small-diameter wells.
To avoid using chalk, it is simpler, cleaner, and more
efficient to use a "popper" at the end of the line to indicate
water surface. Poppers are cheap and easy to construct; see
the picture to the right for an example. Attach the popper to
the end of a calibrated line or measuring tape. Lower it until
you hear the "pop" it makes when it reaches the water
surface. It may be difficult to hear this noise if a pump is
running, so this method may not be appropriate in all
situations. Don't forget to add the length of the popper to the
depth measurement.
Electric cable water-level indicators work on the principle
that an electrical cur- rent will pass through water fairly
easily. These indicators consist of a current source; two
wires attached to the source at one end and weighted at the
other; and an indicator of current, commonly a light, buzzer,
or ammeter. The weighted ends of the wires are dropped
down the well, and the current source is activated. When the
wire ends touch the water surface, it completes the circuit, and the current indicator reflects that fact
(see diagram below).
An inexpensive indicator of this type may be built fairly easily by using light gauge two-strand wire
with the ends exposed and a weight taped to one end. The other ends of the wire strands should be
connected individually to the leads of a continuity tester, or multitester or ammeter wired to a battery.
11
The disadvantage to this type of homemade instrument is that the line is not calibrated, which will
make measurements inconvenient. But especially for shallow water levels, it will work adequately for
studies not requiring a high degree of precision.
This type of indicator will not work if a
free organic liquid (e.g., gasoline or oil) is
floating on top of the water in the well,
because organic liquids usually are not
good conductors of electricity. The same
may be true of water with a very low
dissolved-salt content. This type of
indicator may give a false reading if the
wire ends touch water that has condensed
on the inside of the well casing, above the
true water surface. If the well is
constructed with metal casing, and if the
wires contact the casing, it may conduct the
current and give a false reading. Finally, in
using an electric cable water-level
indicator, it is better to rely on the depth-to- water reading obtained while lowering the cable rather
than that obtained while raising it. As the probe is raised, water may temporarily adhere to it, giving
the impression that it is still submerged, when in fact, it may not be.
In using any of these methods, be certain when reading
depth to water on a calibrated line that you are reading
up from below the reference point, and not down from
above it (see diagram to the right). In addition, be aware
that some measuring tapes are calibrated in tenths of feet
rather than inches.
Acoustic Indicators. Acoustic water-level probes direct
sound waves toward the bottom of the well. The sound
bounces off the water and returns to the surface, where a
detector determines how long it took the sound to "make
the trip." A long time interval indicates a deeper water
level. These probes are more expensive than electric
cable indicators, and they require periodic calibration.
Interface Probes. Interface probes are particularly
useful in ground water contamination studies. These
probes detect the level at which there is an interface
between water and oil, gasoline, or solvent. They may
have varying designs.
Perhaps the least complex design is simply two electric cable indicators in one probe, with a tiny
12
difference between the height of indicators on the probe. The interface is the level at which the upper
indicator is situated within floating "product," or organic liquid, while the lower indicator is in water.
At this level, no current will pass through the upper indicator, but current will pass through the lower
(see figure below).
When using an interface probe, remember that the water level in the well will be depressed somewhat
because of the presence of the overlying product. The corrected depth to water may be found by using
the following formula.
Corrected Measurement of Depth to Water
= Field Measurement of Depth to Water
- (Thickness of LNAPL Layer X
WaterofDensity
LNAPLofDensity
..
..
Note that the fluid densities may be strongly
temperature-dependent.
Float Recorders. When continuous measurements
must be recorded, a float recorder may be used for
convenience. Design of a float recorder for a well is
the same as that of a float recorder for a stream gage.
A float attached to a cable floats at the water surface.
The cable is wrapped around a pulley, with a
counterweight at the other end. As water level rises
and falls, the float and pulley adjust, and the change is
recorded either digitally or by a chart-and-pen system.
The major difference between this setup and that of a
stream gage is that the float, cable, and counterweight
must fit within the diameter of the well, and so are
smaller than those used for a stream gage.
Pressure Transducers. Pressure transducers measure a
particular kind of water level. They do not measure
depth to water in a well. Rather, these instruments
measure height of the column of water situated above
the probe (see figure to left). This makes them useful for
13
applications such as pumping tests, slug tests, or other situations in which water level changes with
time. They are particularly useful in tests in which water level changes rapidly. Pumping and slug tests
are described in the following section.
The design principle of pressure transducers is that the pressure on the tip of the probe is related to the
height of the water column covering the probe, an electrical current passes through the tip of the probe,
and the current is proportional to the pressure. A digital readout device attached to the transducer cable
translates the current into head measurements. These may read out directly or may be stored digitally
(in "dataloggers") for later retrieval or downloading.
Because the pressure reading must be corrected for barometric pressure, the transducer cable carries a
tiny air line that allows the device to compensate for air pressure. Some may require temperature
corrections as well.
Equipment List
Tape measure or ruler
Keys and tools to open well and locked gates
Well construction diagram and boring log
Field notebook, calculator, pens, pencils,
Air-monitoring devices, as needed
Personal protective equipment, as needed
Decontamination equipment, as needed
Water-level indicator (one or more of these)
1. Calibrated line
Tape measure (steel preferred)
Carpenter's chalk or popper and materials to affix it to the tape measure
2. Electric cable water-level indicator
Water-level indicator
Spare batteries
3. Interface probe
Interface probe
Spare batteries
Other probes as needed (e.g., acoustic probe, pressure transducer)
14
Aquifer and Aquitard Testing
Section Overview
Hydrogeologic parameters of aquifers and aquitards are best determined in situ. Although hydraulic
conductivity, transmissivity, and storativity may be estimated from charts of common values or from
laboratory testing, field tests are much more likely to give results that more closely predict the aquifer
or aquitard's actual behavior.
This section describes principles and procedures for planning and carrying out slug tests and pumping
tests, and describes the rudiments of data analysis for these tests as well. Additionally it offers a few
considerations on tracer tests.
Slug Tests
What Is a Slug Test?
The purpose of a slug test is to obtain a preliminary estimate of the hydraulic conductivity of aquifer or
aquitard material in situ. In some situations, storativity may also be obtained from slug test data.
In a slug test, an instantaneous change in water level is caused in a well, and then the rate at which
water level returns to the initial level is measured (see below). A faster return to initial head correlates
with a higher value of hydraulic conductivity.
Slug tests are of two types:
falling-head tests and rising-
head tests. When a slug test is
performed on a well, one of
each type of test may be
conducted in sequence. A
falling-head test involves
causing an instantaneous rise
in water level, then observing
the head as it falls back to the
initial level. A rising-head test
involves causing an
instantaneous drop in water
level, then observing the head
as it rises back to the initial
level.
Slug tests may be relatively
inexpensive, require little
equipment, are frequently
rapid, and can be used to test
the characteristics of either
15
aquifers or aquitards. In addition, slug testing involves extracting little or no water from a well; this is
particularly important if the water is contaminated and its disposal is regulated. The major
disadvantage of slug testing is that it gives a measure of hydraulic conductivity only for the zone
immediately adjacent to the well. As a result, measurements from slug tests cannot incorporate or
account for the effects of large-scale heterogeneities or fractures which occur more than a short
distance from the well intake. When fractures intersect or occur close to the well intake, however, the
results of the slug test may be controlled by the fractures, and may not reveal the nature of the matrix
permeability.
Slug test field and analytical procedures are described in numerous other sources, among them Freeze
and Cherry (1979), Domenico and Schwartz (1998), Kruseman and de Ridder (1990), Dawson and
Istok (1991), and Watson and Burnett (1995). The ASTM has developed several standard methods
pertaining to slug tests. ASTM Standard Test Method D4044 gives the field procedures, while a half-
dozen others describe analytical procedures.
Slug Test Procedures
This section covers slug test planning, field procedures, data processing, and data analysis.
Planning a Slug Test
The first step in a slug test is to assemble the necessary tools and instruments. An equipment list is
given at the end of this section. As that list shows, in addition to
the normal equipment for opening a well and measuring depth to water, a few special items are
required. These are described in more detail here.
An instrument for measuring water level in the well is needed. More specifically, the instrument
should be suited to measuring changes in water level. For materials of low to medium hydraulic
conductivity, such as clays, silts, silty sands, and most rocks, any water-level indicator may work. For
materials of high hydraulic conductivity, such as clean sands, gravels, and fractured rocks, using a
pressure transducer in addition to a water-level indicator is recommended, and may be absolutely
necessary, because measurements must be taken very rapidly. A data logger will simplify the job,
because it can take literally hundreds of measurements per second and store them in digital form for
later downloading and processing by computer. These instruments are described in the previous
section.
A means of instantaneously raising and lowering water in the well is needed. This "slug" gives the test
its name. Possibilities are a solid slug, a bailer, a slug of water, and simple air pressure or vacuum.
A solid slug is a cylindrical object, metal or plastic, with a loop or hole at its end where a line can be
attached. Slugs may be 2-3 feet long or longer. In higher- conductivity materials, longer slugs are
better, because they cause a greater change in water level, which in turn takes longer to recover to the
original level. Because the test is longer, readings are more manageable, as they need not be taken as
rapidly. In low-hydraulic-conductivity materials, however, tests may take hours or days, so shorter
slugs are more convenient. The advantages of using a slug are that, if clean, it does not introduce
16
contaminants into the well, and that the rise and fall of water levels are virtually instantaneous. If a
slug is to be homemade, the critical factors are that it should have a sturdy loop for attaching a line, it
should be narrow enough to fit down the well and still admit a transducer cable or other water-level
measuring device, and it must be heavy or dense enough to sink once it hits the water.
A bailer is similar to a slug except that it is hollow and can be filled with water. It also has a valve at
the bottom into which water flows as the bailer is lowered into a well. To cause a rise in water level,
fill the bailer with water at the ground surface, and rapidly lower it into the well, below the water
surface. Do not do this if the well is to be sampled soon after for chemical analysis. To cause a drop in
water level, rapidly withdraw the bailer. Use care in this portion of the test, as the bailer may leak
water out the bottom, which would cause the subsequently measured rising head data to be inaccurate.
A slug of clean water-a volume of water poured quickly down the well may be introduced into the well
to cause a rise in head. The advantage of this method is that it costs nothing. However, it has three
drawbacks. First, because of the time it takes to pour the water, the change in water level is not
instantaneous. Second, only a falling-head test can be performed this way, not a rising-head test. For a
rising-head test, which is more accurate in certain situations, some means of with- drawing water still
will be needed. And, third: using this method will alter water chemistry within the well, so this method
should not be used if the well is to be sampled for chemical analysis.
Air pressure or suction may be used to conduct a "pneumatic" slug test. These tests have the advantage
of not introducing any materials into the well at all, which minimizes the risk of contamination. In
addition, the change in water level is virtually instantaneous, making it possible to use slug tests even
in wells screened in aquifers of very high hydraulic conductivity. For more information, see Leap
(1984) and the report by Orient and colleagues (1987).
Other requirements of a slug test deal more with the test well than the equipment. For a slug test to be
successful, the column of water in the well must be long enough to accommodate the transducer (if one
is to be used) as well as the slug. Information on length of the water column may be available from the
boring log or well completion diagram, or from previous data-collection efforts. The diameter of the
well must be large enough to accommodate the slug and the water-level measuring device
simultaneously. The entire well screen should be submerged below water level in the well throughout
the test. For reasons explained under the subsection "Interpret the Results," which follows, if the
screen is not submerged through the whole test, the falling-head test will not be reliable. In this
situation, only the rising-head test results should be considered credible. For most test conditions, it
still will be necessary to insert a slug and allow the water level to fall to the original elevation before
conducting the rising-head test; thus, data on the rate of fall of water may still be kept. However, this
may not constitute a tenable slug test. Finally, for the slug test to be successful, inserting or
withdrawing the slug must cause a significant change in water level. The amount of change will
depend on the diameter of the well and the length and diameter of the slug. A short narrow-diameter
slug may cause little change in a large-diameter well. For example, a 3-foot-long, l-inch-diameter slug
will cause only a 2.25-inch rise in water level in a 4-inch-diameter well. This small change in water
level will not lead to precise measurements during the test; a larger or longer slug should be used.
17
Equipment List
• Watch (with second hand), or stop watch, or timer
• Tools and keys to gain access to the well
• Slug (solid, bailer, or water) or device to apply air pressure or vacuum Water
• level indicator and spare batteries
• Field notebook, pencils, and pens
• Calculator
• Pressure transducer, as needed, with spare batteries
• Data logger with cables to attach to the transducer, as needed
• Air-monitoring equipment, as needed
• Personal protective equipment, as needed
Field Procedures
Prepare to Run the Test. Before beginning the test, measure the depth-to-water level in the well. The
water level must be constant and steady for the test to be valid. Also measure depth to the bottom of
the well to be sure that the well can accommodate the slug and water-level measuring device.
If using a transducer, lower it into the water to the appropriate depth. If using a slug or bailer, set the
transducer deep enough in the well to avoid damage from the submerged slug or bailer. However, keep
the transducer sufficiently far enough above the bottom of the well to avoid damaging it or clogging it
with silt.
Check the water level, and wait for it to return to normal. Introducing the transducer and cable into the
well will displace some water, and the water level must recover before the test begins. If the well is in
a layer of low hydraulic conductivity, this may take a long time. If it takes an hour or more, then
expect a very long slug test, perhaps lasting days or more. Under these conditions, it is wise to use a
small slug. In addition, using a transducer may not be wise, unless it can be "dedicated" to the well
(left undisturbed in the well for the duration of the test, which in such cases may be a period of days or
weeks). Measurements will not need to be taken rapidly in a situation like this, and because the
transducer measurements must be checked against depth-to-water measurements anyway, the
transducer offers no real advantage.
Just before starting the test, measure and record the water level. If using a transducer, the proper level
to record is the height of the column of water above the transducer. If using any other instrument, the
proper level to record is depth-to- water level from some reference point. Be sure to note what
instrument is used, as well as the reference point.
Conduct a Falling-Head Test
Introduce the Slug into the Well. Begin the test by introducing the slug into the water in the well.
This should be virtually instantaneous, but it is important to avoid creating splashes or turbulence in
18
the well. If using a solid slug, it might be wise to lower the slug into the well before the test such that it
is just above the water surface. Then, when the test begins, you can lower it quickly into the water. Be
careful not to damage the transducer, if you are using one, by dropping the slug onto it.
If using a bailer, consider using the same procedure as for a solid slug. However, be careful that water
does not leak out of the bailer before the test begins, causing a premature rise in water level.
If pouring a slug of water into the well, pour quickly. This is particularly important when the formation
has high hydraulic conductivity, because water level will change rapidly.
No matter what type of slug is used, once it is introduced into the water, it should not be moved for the
duration of the test.
Take Measurements of Water Level Begin measuring the water level immediately after introducing
the slug into the well. The first objective is to measure the highest water level. This level will occur
within the first second or so after the slug is lowered, and the level will begin to drop immediately. Be
prepared for this before lowering the slug. Record both the measurement and the time of measurement,
to the nearest fraction of a second, if possible.
The next objective is to read and record the water level as it returns to normal, and also to record the
time each water-level measurement is
made. The sample data form (right) shows
readings that should be made in the field.
Continue making and recording
measurements of the water level and time,
according to a schedule. The schedule
will depend on how fast the water level
falls, which depends on the hydraulic
conductivity (K) of the formation.
For materials of moderate hydraulic
conductivity, measure the water level
every second for the first 10 seconds, then
every 10 seconds for the first minute,
every minute for the first 5 minutes, and
every 5 minutes until the water level
returns to the static pretest level. In
materials of lower hydraulic conductivity,
begin on the same schedule, but after
three constant readings in a row, skip to
the next higher time interval. Because a
well in materials of low hydraulic
conductivity may take days or even
months to recover, it may be appropriate
to make readings at intervals of 1 to 6
19
hours or longer, even weeks. Do not disturb the slug or transducer during the test, as this will change
the water level and compromise the results.
If the well must be capped while the water level recovers, be sure to use a vented cap so that air
pressure does not build up in the well, potentially affecting water level.
In materials of high hydraulic conductivity, measurements must be taken very rapidly. As a result,
using a transducer may be a virtual necessity. Using a data- logger in this situation simplifies the test
considerably. But if neither of these is available, it still may be possible to take the rapid measurements
that are required by using the following method. This method requires two people to take
measurements, a china marker (grease pencil), and a water level indicator. An electric cable water-
level indicator with an audible signal such as a beeper or buzzer works best in this situation. When the
test begins, one person uses a stopwatch and calls out "Read" at 5-second intervals. The other person
uses the water-level indicator to find the
depth to water. This person should not
actually determine the depth, but should
simply lower the probe to the water surface,
then use the china marker to mark the
position on the cable. The timer should
indicate intervals of 30 seconds, and the
cable marker should make a different mark
(perhaps thicker, or doubled, or of a
different color) to indicate the 30-second
reading. As long as water level keeps
changing rapidly, continue taking the
measurements at 5-second intervals. Later,
change to 10- or 30-second intervals. When
the test is over, marks on the cable should
be reviewed and translated into actual depth
measurements. This method is not easy, and
it requires advance practice.
Decide When to End the Test. How long
should the test continue? If a rising-head
test will be conducted after the falling-head
test, then wait until the water level has
completely recovered before starting the
rising-head test. Meanwhile, continue
recording the time and water level until the
water level has recovered at least 80% of
the way. Depending on which analytical
method will be used to process the data, the
values between about 60% and 80% of
recovery mayor may not be needed, but it
will not hurt to have recorded them. If the well must be capped while the water level recovers, be sure
to use a vented cap so that pressure conditions in the well are atmospheric. An example of a completed
20
slug test data form is given in (see above).
Conduct a Rising-Head Test
Prepare to Start the Rising-Head Test. Wait until the water level has fully recovered from the
falling-head test. Just before starting the test, measure and record the water level and time.
Begin the Rising-Head Test. Begin the test by instantaneously removing the slug from the well water.
If using a solid slug, withdraw it quickly. Depending on the depth of the well, either pull it to the
surface or simply leave it suspended in the well. In pulling it to the surface, there is a risk of bumping
the transducer cable or tangling other downhole probes. If using a bailer, it might leak and empty itself
if left suspended in the well; this will cause the water level in the well to rise too quickly and yield an
erroneous test result. Weigh this risk against the risk of disturbing the transducer or other downhole
probes.
Begin measuring and recording the water level immediately after withdrawing the slug. The first object
is to measure the lowest water level, which will occur within the first second after the slug is removed.
Record both the measurement and the time of measurement, to the nearest fraction of a second, if
possible. The next objective is to read and record the water level as it returns to normal, along with
time of the measurements. Continue making measurements of water level and time, according to the
appropriate schedule, as for the falling-head test.
If the well must be capped before the test is complete, use a vented cap. In the rising-head test, this is
particularly important if hydraulic conductivity in the tested formation is high and if the water level in
the well is above the screened interval. When this is the case, the water level can rise quickly enough
to compress the air in the casing, which can blow the cap off with explosive force.
End the Test. Stop the test after 60% to 80% of the initial head has been recovered.
Processing the Data
Before the data can be analyzed, they must be processed to yield the appropriate values for analysis.
The following steps for processing apply to both falling- and rising-head tests, but the data from each
test should be processed separately.
First, find 0H . 0H is the maximum level above (or below) the pretest level to which the water level
rises (or falls) immediately after the slug is inserted (or removed). Find 0H by subtracting the depth to
water before the test from the depth to water immediately after the slug is inserted or removed.
The choice of 0H is somewhat arbitrary, but is critical to the success of the method. As the slug drops
into the water, a great deal splashing and turbulence tends to occur. The result is that water levels in
the first second or two may vary widely. When anything but a transducer and datalogger are used to
make water- level measurements, the choice may be simple, because usually by the time the first
measurement is made, the water has stopped splashing.
21
However, the choice of 0H is particularly
confusing when a transducer and datalogger
are used, because the datalogger may record a
hundred or more readings in the first second of
the test. How can one choose an Ho value from
such an alarmingly large and widely diverging
set of points? The answer is to use
commonsense. Remember that the maximum
change in water level (Ho) cannot exceed what
is physically possible, given a slug of a certain
volume in a well of a certain diameter-even
though the transducer readings might indicate
so. It is a good idea to calculate the highest
water level that might possibly be reached, and
not to select an 0H value which exceeds this.
Knowing the volume of the slug, calculate the
maximum change it could possibly have
caused in the water level by using the
following formula:
Maximum possible change in water level =
Volume of slug
well radius) 2
Don't forget to use the radius of the well, not
its diameter, and to convert all measurements to consistent units.
Once the maximum possible change in water level is known, eliminate from consideration all data
points that are greater than that value. Choose the recorded value that is closest to, but does not exceed,
the maximum possible value. Why not just use the calculated value? The calculated value is a
theoretical value that might not ever be achieved, because water instantaneously moves into or out of
the well screen as the slug is inserted or withdrawn.
Once the value of 0H has been chosen, make a table or use a computer spread- sheet program to
record and process the water level and time data. If a depth-to- water indicator was used to measure
water level, the columns should be as given in (See above figure (a)).
If a transducer was used to measure water level, the transducer measurements will give the height of
the water column above the transducer. In this case, Ho is the highest value recorded immediately after
the slug is inserted (or the lowest value recorded immediately after it is removed) minus the height
before the slug was inserted or withdrawn. The data table will look slightly different, too, as is shown
in (See above figure (b)).
22
Analyzing the Data
The analysis given here follows the Hvorslev (1951) method.
This method is applicable in a wide variety of field settings,
and graphing and calculations are relatively simple. The
Hvorslev method only gives hydraulic conductivity of the
formation, not transmissivity or storativity. Other methods of
interpreting the data are available; see Freeze and Cherry
(1979), ASTM Standards 4044 and 4104, Dawson and Istok
(1991), Fetter (1994), or other texts for details.
Graph the Data. Plot elapsed time versus head ratio (H/ 0H )
on a one-cycle semilogarithmic graph with the head ratio on
the logarithmic axis and time on the arithmetic axis. Ignoring
the first few data points, which are likely to be spurious, draw
a straight line through the points (see left).
Perform the Necessary Calculations. Read the value of 0T ,
the basic time lag, from the graph. 0T is the time at which the
head ratio equals 0.37. To find it, find 0.37 on the scale of the
head ratio, draw a horizontal line from this point to the line
connecting the data points, and then drop a vertical line down to the time axis. Read the value; this is
0T .
Calculate K. Calculate hydraulic conductivity (K) of the formation using the following formula. This
formula applies only if the length of the well or piezometer casing is more than 8 times the radius of
the screen (or L/R > 8):
K=
( )
0
2
2
1
LT
RLnr
where r = radius of the well or piezometer casing
L = length of the saturated portion of the screen or filter pack
(see what follows)
R = radius of the screen or screen plus filter pack (see what follows)
0T = basic time lag, which is read from the graph, as described earlier
K = hydraulic conductivity of the formation
If the well or piezometer taps an aquitard, then R is the radius of the screen plus the filter pack (gravel
pack), and L is the length of the filter pack (gravel pack).
Interpret the Results. Check the results with a table of common values of hydraulic conductivity for
the rock or sediment type. Check the results of the falling- and rising-head tests against each other.
(Both types of test should be performed whenever possible.) They should give results that are fairly
close to each other, so one can be used to check the other. However, occasionally the two tests will not
23
agree. This is most likely to occur in a well installed in an unconfined aquifer, with a screen that
extends above the water table. During a falling-head test in such a well, water might leak out of the
screen above the water table into the unsaturated zone. The test result will then give an erroneously
high value for K. If this is suspected, the rising-head test should be considered more reliable.
In both the falling- and rising-head tests, the line may be curved at either end. These portions should be
ignored during curve fitting.
Finally, recall that the volume of water entering or leaving the formation during the test is very small.
If results seem too high or too low, it may be that only the sand or gravel pack surrounding the screen
actually was tested, and not the formation itself. To determine if this is likely, use information from the
boring log and well construction diagram, along with geological judgment and common sense.
Pumping Tests
What Is a Pumping Test?
In a pumping test, water is pumped out of a well at a known rate over a period of several hours or days.
As pumping is going on, water level is monitored in one or more observation wells some distance from
the pumping well, and in the pumping well, too. There is a relationship between the test parameters
(water levels during the test, pumping rate, time since pumping began, and distance between pumping
and observation ,wells) and the aquifer parameters (transmissivity, T, and storativity, S). For best
results, a pumping test should be followed by a recovery test, in which water level is monitored after
the pump has been shut off. Data recorded during both phases of the test are used to calculate values of
T and S.
Pumping tests have both advantages and disadvantages when compared with slug tests. Because
pumping tests involve extracting more water from the aquifer than do slug tests, they do a better job of
estimating aquifer characteristics close to and at some distance from the well. Pumping tests can
measure characteristics of large-scale heterogeneities and anisotropy. They give a more realistic
estimate of how the aquifer and any confining layer actually respond to pumping. However, pumping
tests take longer, require the use of a pump, may require the presence of an observation well in
addition to the pumping (test) well, and are therefore considerably more expensive than slug tests. In
addition, the problem of disposing of the pumped water must be addressed. Finally, pumping tests are
less well-suited than slug tests for estimating the characteristics of aquitards.
This section describes how to plan a pumping test, carry it out, and analyze the results. Pumping test
field and analytical procedures are described in numerous other sources, among them Freeze and
Cherry (1979), Kruseman and de Ridder (1990), Dawson and Istok (1991), Fetter (1994), Watson and
Burnett (1995), and Domenico and Schwartz (1998). The ASTM has developed several standard
methods pertaining to pumping tests. ASTM Standard Test Method D4050 gives the field procedures,
while a few others describe analytical procedures.
24
Planning a Pumping Test
Planning a pumping test begins with studying the geology of the site. Then, an analytical method is
considered, an equipment list is put together, and the pumping and observation wells are designed and
installed. Finally, the test parameters must be chosen, including pumping rate and length of the test.
The steps are described in more detail in what follows.
Study the Geology
An understanding of subsurface geology is essential to planning a successful test. Answering the
following questions will provide a good beginning. When the test is to be performed in an unexplored
area, answers to these questions may not be known, in which case informed guesses should be made.
These guesses should be based on the study of regional geology, by utilizing existing geologic maps
and reports, field observations of outcrop patterns, and topography.
What aquifers, partial aquifers, and aquitards are present, and what are their depths, orientations, and
thicknesses? What is the degree and nature of heterogeneity of the geologic materials and/or
formations in the area? What is the degree and nature of anisotropy of the geologic materials and/or
formations in the area? What are the static water levels in the area? Consider water table and
potentiometric surfaces. Where are the recharge areas for the aquifers? What is the general direction of
ground water flow in each layer or formation? What surface-water bodies exist in the area? How are
they likely to interact with ground water? Into what range are values of hydraulic conductivity (K)
likely to fall? Consider aquifers as well as aquitards. To what extent will fracturing influence the test?
Is fracture permeability the primary source of water? How important is it? What hydrologic boundaries
are present? Consider both contributing boundaries (e.g., surface-water bodies, facies changes to
higher-K formations, fracture permeability) and noncontributing boundaries (e.g., pinched-out
formations, buried valley walls, facies changes to lower-K formations, or sealed fault zones). What
other wells are present that might influence or be affected by the test?
Nonpumping wells should be considered as possible observation wells. Pumping wells should be
considered as possible interferences, and their pumping rates and times should be monitored. Likewise,
pumping the test well might cause a drop in water level in a private well; potential effects should be
estimated, and the owners should be consulted.
Consider the Analytical Method
Consider the methods that might be used to analyze the data. Choice of analytical method determines
the number and placement of wells, frequency of measurement, and pumping pattern. A variety of
analytical methods are described in Walton (1987), Kruseman and de Ridder (1990), and Dawson and
Istok (1991). Four methods are described here: the Theis, Jacob time-drawdown, distance- drawdown,
and step-drawdown methods. Considerations about these and a few other tests are described in what
follows.
Methods for Ideal Aquifers. The Theis, Jacob time-drawdown, distance-draw- down, and step-
drawdown methods apply when the formation being tested fits ideal assumptions. These assumptions
25
are that the aquifer is isotropic and homogeneous, horizontal, fully confined, of constant thickness, and
infinite in lateral extent; that it has no hydrologic boundaries and no interference from other pumping
wells; that the well intake extends through the full saturated thickness of the aquifer; and that flow in
the aquifer is laminar and horizontal.
When a pumping test is performed in nonideal conditions, the test's results do not conform to the ideal
curves. The ways in which they deviate should guide the choice of analytical method. As a result, it
helps to plot the data as for ideal conditions, and then to evaluate the nature of the deviation from the
ideal.
Theis Method. The Theis method involves plotting a curve of time versus draw- down data and
matching the curve to type curve of the Well Function. Advantages of the Theis method are that the
method is simple and well-known, and that deviations from the ideal are easily seen on the Theis plot.
One disadvantage is that at least one observation (nonpumping) well is required if a value of S is to be
calculated. Another is that the method involves curve matching, which invites interpretive error,
although several computer software packages are available to match the curves numerically and obtain
an optimal solution.
Jacob Time-Drawdown Method. The Jacob time-drawdown method involves plotting data on a
graph of time versus drawdown and fitting a straight line to the points. This method assumes the same
ideal conditions as does the Theis method. In addition, it applies only to data for which the Jacob
approximation is valid, that is, for which the parameter u, as defined in what follows, is less than or
equal to about 0.01 (Lee and Fetter, 1994). This condition generally occurs when pumping times are
long.
Advantages of the Jacob time-drawdown method are that the graphical technique is simpler than that
of the Theis method, and that the effects of hydrologic boundaries may show clearly on the graph. In
addition, the Jacob time-drawdown method may be used (0 interpret data from the pumping well,
eliminating the need for an observation well. However, if no observation well is used, only
transmissivity, and not storativity, can be determined. As with the Theis method, a disadvantage of the
Jacob time-drawdown method is that it involves curve fitting, which invites interpretive error, although
computer software for curve-matching may be used to obtain a statistically optimal solution.
Distance-Drawdown Method. The distance-drawdown method involves plotting drawdown versus
distance from the pumping well. To use this method, at least three observation wells are needed, at
specific intervals of distance from the pumping well.
An advantage of the distance-drawdown method is that only a few water-level measurements must be
made. The major disadvantage is the need for several observation wells. In addition, this method
involves curve fitting, which invites interpretive error, although as with the methods already described,
some computer software packages may be used to minimize this error.
Step-Drawdown Test. The step-drawdown test involves pumping at several successively higher rates
and observing the effects on drawdown. It is used specifically to determine well yield and optimum
pumping rate for a particular well. Often, a step-drawdown test is conducted as a trial test to select an
26
appropriate pumping rate for a subsequent pumping test. Calculating transmissivity and storativity
from a step-drawdown test may be difficult or impossible. More information is included in the section
titled "Determine the Pumping Rate," which follows.
Methods for NonIdeal Aquifers. When data from a pumping test are plotted using standard methods,
and are found not to match idealized curves, it is an indication that one or more of the assumptions of
idealized methods do not apply. This most commonly occurs because the aquifer is semiconfined or
unconfined, the aquifer is not laterally extensive, the well does not fully penetrate the aquifer, or there
is interference during the test by another pumping well.
Methods exist that offer ways to estimate the transmissivity and storativity of an aquifer even when
ideal conditions are not met. Methods have been developed for semiconfined aquifers, with and
without storage in the confining layer, as well as for unconfined aquifers. Some methods attempt to
account for the effects of hydrologic boundaries or interference from other pumping wells. These
methods should be considered when it becomes obvious that the data do not fit the type curve. Further
information is available in Freeze and Cherry (1979), Walton (1987), Kruseman and de Ridder (1990),
Dawson and Istok (1991), Fetter (1994), and Domenico and Schwartz (1998).
Determine What Is Needed To Do the Test. No matter what analytical method will be used, in order
to conduct any pumping test, a pumping well must be available. For most analytical methods, and
especially if storativity is to be estimated, there also must be at least one observation well. A means of
measuring water level in all wells is needed. Although it might initially seem like a good plan to use
the same water-level indicator for both the pumping and observation wells, in practice this may be
impossible because of the physical distance between them and the rapid measurements needed early in
the test. A means of disposing of the pumped water is needed; in some situations, regulations may
specify that it be contained for later disposal by an approved method. A means of measuring discharge
rate from the pumped well is needed. And, finally, a timepiece or stopwatch, and a notebook and/or
recording forms are needed.
Design the Pumping Well
If no well exists in the study area, design and install one based on the considerations discussed in what
follows. If an existing well is to be used as the pumping well, determine if it is suitable for the
pumping test. In many cases, the construction details and location of an existing well make it
inappropriate for the test, and another well must be designed and installed. If no information is
available on the existing well, the well should not be used. Installing a new well provides the
hydrogeologist with good subsurface geological data. In addition, it has the benefit of allowing the
hydrogeologist to design a well that will provide good-quality pumping test data.
Diameter. Consider cost, the diameter of the pump, the discharge rate necessary to stress the aquifer
and affect water levels in the observation wells, and what the well will be used for after the tests.
Depth and Placement of Intake. Design the well such that the screened or open portion is open only
to the aquifer that is to be tested. Ideally, it should fully penetrate the aquifer.
27
Location. Frequently, choice of location is limited. But within the constraints of the site, try to choose
a location that maximizes easy access, minimizes interference from other pumping wells, and
optimizes data-analysis options.
Post-test Use of Well. If a well is to be abandoned after the test, it may be constructed of reusable
materials. But if it is to be used for water supply or monitoring, the design may depend more on the
final use than on its usefulness for the test.
Design the Observation Wells
If existing wells are to be used as observation wells, their construction details and locations must be
reviewed. If new wells are to be installed for the purpose of the test, several factors must be
considered, including well design, the number of wells, and locations.
Observation Well Design. Diameter and construction depend on what the well is to be used for after
the test. If it is to be used only for the test, and will be abandoned thereafter, it may be constructed of
reusable materials and may be of relatively small diameter. The diameter only need be big enough to
accommodate a water-level indicator, so a l- or 2-in. diameter might suffice.
Depth of the observation well(s) should be determined by geology: The intake portion of the well must
be open to the same aquifer as is the pumping well. However, the intake need not fully penetrate the
aquifer, assuming ideal conditions are met (horizontal, laminar flow). If conditions are not ideal, the
observation wells should be open to the same portion of the aquifer as is the pumping well.
Number of Observation Wells. To characterize fully the hydraulic characteristics of a formation,
several observation wells open to the aquifer are needed. In the case of a semiconfined aquifer,
observation wells also should be installed in the overlying aquifer. However, cost is a major limiting
factor in determining the number of observation wells. In some cases, the value of information gained
from installing a well does not justify the expense.
No Observation Wells. A pumping test can be run with no observation wells. However, it will yield a
limited amount of information. With no observation well, water levels must be measured in the
pumping well, and turbulence within the well will affect quality of the data. Because of this, the
recovery test becomes even more important. Neither storativity nor radius of pumping influence can be
determined from a test with no observation wells. If the budget for the test is so limited that no
observation wells can be installed, it may be more useful or cost- effective to abandon plans for a
pumping test, install a few small-diameter wells, and use slug tests to estimate hydraulic conductivity.
One Observation Well. Use of one observation well may yield acceptable results in ideal conditions.
However, if aquifer conditions are heterogeneous, a test with one observation well will be limited in its
value, because conditions near the well may not represent conditions elsewhere in the aquifer. In
addition, the distance- drawdown method cannot be used to interpret data from such a test, because
three or more observation wells are needed to perform that analysis.
28
Two or More Observation Wells.
Two or more wells should be used
if conditions are laterally
heterogenous and an assessment of
the degree of heterogeneity is
required. In this case, the wells
ideally should be situated such that
they are the same distance from the
pumping well, but in positions
where they will reveal the different
conductivities (see right).
If conditions are laterally
homogeneous, wells should be
situated at different distances from
the pumping well. For maximum
benefit, their distances from the
pumping well should be in different
orders of magnitude (e.g., 10, 100,
1000 meters). The distance-
drawdown method then will
provide more precise and accurate
information. A minimum of three
wells is required for this analysis.
Obviously, a limit exists beyond
which a well will not provide useful
information because it will not be
affected by pumping. This "radius
of influence" can be estimated
before the test by using the equations for the distance-drawdown method.
Locations of Observation Wells. The wells must be close enough to the pumping well to register
easily measured changes in water level within the first few hours of the test. (If the water level drops
only a tiny amount throughout the entire duration of the test, then measurements are not likely to be
precise enough to yield good results.) Observation wells must be appropriately placed to generate the
curved portion on a Theis plot. The farther they are from the pumping well, the greater the portion of
the aquifer that they test, but the longer in duration- and more expensive-the test must be. Of course,
the observation wells must fall within the radius of influence of pumping. In addition, location of the
observation well often is constrained by practical considerations such as property boundaries and
drilling rig accessibility.
If multiple observation wells are used, they should conform to the spacing considerations described
under the earlier "Number of Observation Wells."
With these competing demands, how can optimum distance of observation wells be determined? For
29
some tests, it may be possible to estimate the optimum distance for a single-observation well. For this
estimate to be most successful, the hydraulic conductivity of the aquifer must be already fairly well-
established, and the pumping rate should be known. Optimum pumping rate should be established by
performing a step-drawdown test, described later in this chapter.
If hydraulic conductivity and the pumping rate are known, to estimate the optimum distance to an
observation well, follow these steps.
1. Multiply the hydraulic conductivity of the aquifer by the aquifer thickness (if the well intake fully
penetrates the aquifer) or by the intake length (if it does not). This yields an estimate of transmissivity
(T).
2. Estimate the order of magnitude of the storativity (S). Aquifer storativity ranges from about 10-7
to
10-1
. If the aquifer is perfectly confined, then as a preliminary estimate, use S = 10-5
. (This estimate
will help during the design phase. But remember, one of the reasons for doing the pumping test is to
determine the actual value of S, so the estimate is just a preliminary approximation, and very well may
be proven to be inaccurate after the test.) If the aquifer is "leaky" (semiconfined), use S = 10-3
. If it is
unconfined, use S =10-1
(or estimate a range of values for specific yield, Sy from a table of common
values such as Table 6.2, and use S = Sy).
3. Assume that drawdown (h0 - h) in the observation wells should be at least 1 to 3 meters after about
12 hours of pumping. If it were any less than this, it would be difficult to measure the small changes in
water level. This time period is the variable t in the equation in Step 5, which follows.
4. Now, use the Theis equation and the values estimated in Steps 1 to 3 to calculate values of the well
function, W(u), for the various pumping rates:
W(u)=
( )04 h h T
Q
π −
5. Use Appendix 3 to find corresponding values of u for the W(u) values calculated in Step 4.
6. Use the following equation to calculate distances to the observation wells (r) for the values of u
found in Step 5.
R2
=
4Tut
S
7. Now compare these r values with the field situation. What is practical, given the constraints of the
site? Property lines, obstructions, buildings, and locations of existing wells all will influence the final
decision.
Sample Calculation of the Optimum Distance to the Observation Well. A 24- hour-long pumping
test is to be conducted in a well that is screened through the full thickness of a 20-m thick fully
confined aquifer. The aquifer is composed of well-sorted medium sand, which from previous studies
has been shown to have a hydraulic conductivity of 10-2 cm/sec. Water is to be pumped from the well
by a submersible pump at the rate of 100 gpm. Because the aquifer is fully confined, a preliminary
estimate of storativity is 10-5. The results of the test, of course, will yield a more accurate estimation.
30
A drawdown of 2 meters after 12 hours of pumping is desired. What is the optimum distance from the
pumping well to the observation well?
To solve this problem, first, the value of transmissivity (T) is calculated, where
b is the saturated thickness of the aquifer:
2
2
10 20 100 20
sec sec
cm cm cm
T Kb X mX
m
−
= = =
Then the value of the well function W(u) is calculated:
W(u) =
( )04 h h T
Q
π −
=
( )( )
2 2
3 2 2
20 60sec 264
4 2
sec min 100
100
min
cm gal m
m
m cm
gal
π
     
     
     
= 8
When W(u) = 8.0, the value of u is about 2 x 10⁻⁴
. Substituting
this value into the equation for the radius,
2 4Tut
r
S
=
=
( ) ( )
2 2
4
2 2
2
5
20 3600sec 1
4 2 10 12
sec 100
6912
10
cm m
x hr
hr cm
m
−
−
    
Χ    
     =
Therefore, r = 83 meters.
Ideally, then, the observation well should be located about 80 m from the pumping well. In
practicality, however, the site boundaries, the lateral extent of the aquifer, and access for the drilling
rig all must be considered before the location of the observation well can be finalized.
Determine the Length of the Test
For a confined aquifer, the typical duration of a test would include a pumping phase 12-24 hours long,
and a recovery phase which runs as long as the pumping phase. For an unconfined aquifer, a typical
test may run 3-7 days in the pumping phase and the same duration in the recovery phase. Longer
durations might be needed, e.g., if the test is intended to reveal the effects of a distant hydrogeologic
boundary. In any case, each phase of the test ideally should be continued until equilibrium is reached.
31
In planning the test, consider the data-interpretation method. Note that when drawdown values are
plotted versus time on a logarithmic axis, points plotted after about 8 hours into the test are very close
together (see beloww). Thus, if a test must be terminated early, it makes more sense to do so at the end
of a work shift of 8 hours than at the end of two work shifts, or 16 hours. If terminated at the end of 16
hours, the final 8 hours of the test very likely will have yielded little additional useful information.
Consider the personnel who are to be onsite during the test. The greatest number of measurements are
needed at the beginning of the pumping phase and again at the beginning of the recovery phase, so the
greatest number of workers will be needed at these times. They will be needed to make simultaneous
measurements at several different wells.
Finally, consider that longer tests give more information about hydrogeologic boundaries and
secondary permeability than do shorter tests. Thus, the length of the test must take into account the
objectives of the test.
Choose a Pump
The pump used for the pumping test must meet several criteria. Its intake must fit in the well, so
diameter is critical. Consider what else will be downhole during the test, including the water-level
indicator.
32
The equipment must provide the needed "lift." How far down is the water level? How far below that
will the pump intake be positioned?
The pump also must deliver the required pumping rate (which is discussed in what follows). Pumps
generally are designed with a specific purpose in mind, for example, sampling, purging, well
development, or water supply. Their capacity depends on their design, the lift, the head of water above
the intake, and the diameter, among other things. The pump's manufacturer can supply the needed
information on pump capacity. Keep in mind that no vacuum pump will be able to lift water more than
about 25 feet.
Ideally, the pump should deliver discharge at a steady rate. As a result, suction pumps, positive-
displacement pumps, and submersible pumps may be suitable, but bladder pumps may not be. Bladder
pumps operate by alternately filling, then discharging water from a bladder. The time between the fill
and discharge cycles may be as long as several minutes. As a result, the discharge is not steady. Data
from the recovery phase of the test will be more reliable than data from the pumping phase in such a
situation.
The power source for the pump must be considered. Some pumps run off of a car or truck battery, but
this is not likely to be a reliable source for a long pumping test. Others must be plugged into a
household-voltage circuit. Is a power supply reliable and readily available? Will it remain so
throughout the duration of the test? If not, a generator may be used; be sure to have plenty of fuel on
hand to power the generator. Some pumps are gasoline or diesel-fueled. Ensure that supplies are
ample.
In some cases, and if a low level of sophistication and precision is acceptable, a pump may not be
required at all. In these cases, the well must be able to be bailed by hand quickly enough to yield the
required discharge. This is most practical if the wells are shallow and if the aquifer is of low
conductivity. In deep wells, the time required to haul the bailer out of the well, empty it, and then
lower it again is too long. If bailing is used, each time water-level measurements are made, they should
be made at the same point in the bailing cycle. Bailing must be done at a constant rate throughout the
test. It helps to have several field personnel performing this task, so that some may rest while another
bails. Volume of water and time must be measured constantly throughout this type of test, as the bailer
may collect different volumes of water each time. Obviously, bailing is not practical for tests more
than a few hours long or for tests of very deep wells. Care must be taken during bailing tests that the
cable for the water-level indicator is not disturbed as the bailer is raised and lowered. This type of test
will yield very crude data, at best.
Determine the Pumping Rate
To choose the pumping rate, consider what the pump can handle as well as what rate will give the
desired drawdown. As just indicated, the maximum capacity of the pump is determined by its design,
size, the lift required, and the head of water above the pump's intake. Do not design the test such that
the pump must run at its maximum capacity from the beginning of the test. The reason for this is
simple: The yield of the pump will decline throughout the test, as the water level in the well drops. If
the pump is already running at maximum capacity, its performance cannot be improved to increase the
33
yield to its initial level.
How far below the water level will the pump intake be positioned? It must be far enough below
the water level so that the pump won't run dry. In addition, if a pressure transducer is used, the pump
intake should be separated from the transducer by a few feet to minimize turbulent interference.
What head of water will be above the pump intake? As the test goes on, this will decrease, which may
decrease the yield.
Consider what the well is capable of yielding. Pumping at 200 gallons per minute (gpm) will
immediately dry out a well that is only capable of producing 2 gpm. Estimate the transmissivity (T) of
the aquifer; do this by estimating the hydraulic conductivity (K) and multiplying by the aquifer
thickness. If the aquifer is much thicker than the portion penetrated by the well, then instead of
thickness, use the length of the well intake. Also estimate storativity (S), as described in Step 2 under
"Locations of Observation Wells." With the estimates of T and S, and with an estimate of the distance
between pumping and observation wells, use the Theis equation to estimate the pumping rate that
would yield an easily measured draw down in the observation well at some time (t) after pumping
begins.
Also consider how much water must be pumped out of the well before the Theis age solution begins to
be applicable. It is not enough to simply empty out the water that is standing in the well; new water
must be drawn into the well and pumped out during the test. Calculate the volume of water standing in
the well as volume = 2
rπ x (height of water column), and then ensure that the pumping rate is
sufficient to pump out all of this water and more during the first portion of the test.
Finally, it might be wise and ultimately cost-effective to conduct a pilot test to determine the optimum
pumping rate. Do this by performing a step-drawdown test: guidelines for doing this are described
under "Pretest," which follows.
Determine How to Measure Discharge
Measurements of discharge should be made at various time intervals throughout the test. At the
beginning of the test, they should be made frequently; once flow stabilizes, they may be made less
often. In the case of a bailing test, they must be made continuously. Therefore, a reliable method for
measuring discharge must be employed.
The bucket-and-timer method works well if flow is relatively low (up to about 10 gpm, if using a 5-
gallon bucket). A flow meter may be used by installing it in the discharge line; ensure that the
expected discharge falls within the operating range of the meter. Orifice weirs may be used, but care
should be taken that the discharging water is contained if necessary or routed away from the pumping
well. For more information, see the section on measuring discharge from wells in Chapter 4, "Soil
Water and Ground Water.
34
Disposing of Pumped Water
Water pumped out of the well during the test must not be permitted to recharge the pumped aquifer.
This is of particular concern for unconfined aquifers. However, it is not necessarily an issue for certain
confined aquifers, especially if there is no chance that water discharged onto the surface will change
hydraulic head within the confined aquifer. Convey the discharged water away from the site through
pipes or hoses. Be sure that the piping system is capable of carrying water at the proposed pumping
rate. In some areas, it may be necessary to check beforehand to determine if any permits are required
before releasing water into a stream or drainage way.
At some sites, particularly if the water is known to be contaminated, it may be necessary to contain the
pumped water. If this is the case, depending on the pumping rate and duration of the test, it may be
possible to contain the water in several 55-gallon drums. Alternatively, tank trucks may be used to haul
the water away for appropriate disposal. Depending on test design, if tankers are used, it still may be
necessary to temporarily contain the water in stock tanks or drums. In addition, consider having a
backup truck on hand so that there is no delay in the test if one should fill up; consider the pumping
rate and the truck's capacity to determine if this is necessary.
Depending on the water chemistry and the volume that is to be pumped, in some situations, it may be
advantageous to obtain a permit to discharge the water to a local sewer or waterway. This might
require obtaining a National Pollutant Discharge Elimination System (NPDES) permit. The
appropriate environmental agency should be consulted for more information.
Determine How to Measure Water Levels
How often should measurements be taken? The early portion of the time- drawdown curve is critical in
curve matching. As a result, it is important to make frequent measurements at the beginning of the
pumping phase of the test, and then again at the beginning of the recovery phase. As the test proceeds,
measurements may be made less frequently. Kruseman and de Ridder (1990) suggested the following
schedule of measurements:
In addition, consider that the analytical method influences the frequency of measurements needed. If
the data will be analyzed by the distance-drawdown method, for example, only a few measurements
are necessary, and these may be taken quite some time after pumping begins. For a step-drawdown
test, a rapid series of measurements should be taken every time the pumping rate increases, but
frequency may decline thereafter.
Use a water-level indicator to make the measurements. These were described previously.
Considerations for choosing instruments appropriate for a pumping test are discussed here.
35
Measurements in the pumping well must be taken quickly, especially at the beginning of the test,
because water level changes rapidly. Electric cable water- level indicators or pressure transducers are
well suited to this task. However, a chalk line or steel tape may be difficult to use with much accuracy,
because making one measurement typically takes more than a minute. In addition, turbulence in the
well caused by the pump will degrade the quality of these measurements. Noise from the pump may
render a popper useless. Measurements in the observation well(s) involve different considerations. Can
the same water-level indicator be used in the pumping well and observation well(s)? How close
together are the wells? How easy is it to carry the instrument between them? Is it physically possible to
make measurements in all wells with the same device, given that some measurements must be made
simultaneously in all the wells? Some data loggers can accommodate several transducer inputs. If these
will be used, is the transducer cable long enough to run between the wells and down the holes? For
further reading on planning the field aspects of a pumping test, consult Walton (1987), Kruseman and
de Ridder (1990), or Dawson and Istok (1991).
Performing the Test
Once the test and observation wells have been drilled, constructed, and developed, consider the record-
keeping system. Determine who will keep the records during the test. Use standard forms (an example
appears in below) or set up tables in a field notebook before the test. Several columns will be needed,
with these headings as a minimum:
Pumping Well: Time, depth to water (or
transducer reading), pumping rate, comments.
Observation Well: Time, depth to water (or
transducer reading), comments.
Don't forget to include units of measurement in
each column where appropriate.
The test should be conducted in several stages.
Some hydrogeologists conduct a step-drawdown
test before every pumping test. This pretest
provides the information needed to determine
the equipment, personnel, and time that will be
required for the actual pumping test. This
practice can save money and time and yield
better results.
The pumping test itself consists of two stages:
Stage 1, Pumping; and Stage 2, Recovery. The
pumping stage involves pumping the well and
recording the time and water level in the
pumping and observation well(s). The recovery
stage simply involves recording the water level
36
in the pumping and observation well(s). This section gives the step by step method for performing the
complete test.
Pretest: Step-Drawdown Test
A step-drawdown test (or "step test") is conducted for the purpose of determining the optimum
pumping rate for a well. This type of test may be conducted before a standard pumping test, or it may
be conducted in any production well when data on optimum pumping rates are needed.
A step-drawdown test is performed by pumping at several successively higher rates and observing the
effects on drawdown. To do this, follow the field procedures for Stage 1 of a standard pumping test, as
described in what follows. However, in a step-drawdown test, the pumping rate is varied stepwise
through the test. This is done by beginning the test at a low pumping rate. Pumping at this rate
continues for a period of 1-2 hours, or until drawdown has stabilized to some degree. Then, pumping
rate is increased, and pumping at the new rate continues for the same length of time. Then, the
pumping rate is increased again, ideally by the same factor as it was increased in the previous step. The
test continues in this fashion for several "steps," or pumping rates. Walton (1987) suggested at least
three steps, whereas Driscoll (1986) suggested five to eight steps.
To analyze the data, begin by plotting drawdown versus time on an arithmetic graph with, time
on the horizontal axis and drawdown on the vertical axis; (see figure above. 5.9 (a)). In addition, plot
discharge versus drawdown on an arithmetic graph, with drawdown on the horizontal axis and
discharge on the vertical axis; (see figure above (b)). This second plot shows specific capacity, which
is the well's yield per unit drawdown. On both graphs, connect the points with a smooth curve.
Conduct the pumping test at a pumping rate chosen from the straight (early) portion of the specific-
capacity curve. The point at which the specific-capacity curve flattens out is the maximum safe yield.
It is not wise to operate the well at the maximum safe yield.
37
Stage 1: Pumping
Measure and record water levels in all wells.
Ensure that nearby wells will not be pumping during the test. Any wells in the expected zone of
pumping influence of the test well should be shut down for the duration of the test.
Set up equipment.
Pump and power supply. Note that installing the pump raises the water level. Allow it to return
to original before the test begins.
Water-level measuring devices. If using transducers, allow enough time after installing the
probes in the wells for the water level to return to the original before the test begins.
Discharge-measuring system.
Discharge-disposal system.
Check with all field personnel to ensure that all duties, including record keeping, are clearly
understood. Rehearse if necessary.
Synchronize watches. Determine which watch will be considered official time,
and which will be backup.
Check and record time and water levels in all wells.
Start the pump and begin making measurements. The first several measurements must be made
rapidly, so it is essential that field personnel know their jobs and be prepared to perform them
immediately. In addition, the use of automatic recorders is strongly recommended for any wells near
the pumping well, so there is no delay in taking measurements. Throughout Stage I (Pumping),
monitor pump operation, discharge, and water levels. Try to anticipate problems before they occur.
Stage 2: Recovery
Near the end of Stage 1 (Pumping), prepare for Stage 2 (Recovery). Once again, measurements will
have to be made rapidly at the beginning of the recovery period, so several workers should be on hand
and well-rehearsed.
Before shutting down the pump, once again review duties.
If any of the observation wells are remote from the pumping well, and if a field worker is at
that well and will begin making measurements there once the pump is shut off, ensure that the worker
is aware of the timing of the shut off. Walkie- talkies may be useful for this, or hand or light signals.
Make and record a final discharge measurement and a final water-level measurement in all
wells; these values are important because they will be used in analyzing the results. Then shut off the
pump. Begin taking water-level measurements on the same schedule as the original measurements in
Stage 1 (Pumping).While recording the data, use the same column headings as during the pumping
portion, except that no column is needed for discharge.
38
After it is stopped, the pump should be left in the well, as pulling it out will change water level
in the well, and the time it takes to haul it out may interfere with the valuable early time measurements.
In addition, pulling it out is likely to disturb the transducer, if one is being used. One problem with
leaving the pump in the well is that water in the discharge line may drain back into the well. This
should be avoided, because it changes the water level in the well. If necessary, a check valve may be
installed near the bottom of the discharge line to prevent this from occurring. This must be done before
the test begins.
Stop the test after the requisite time has elapsed.
Processing the Data
The field data must be processed to put them in
a form that is useful for the analysis. Prepare to
do this by constructing a table or computer
spreadsheet with headings as shown in the
figure below.
Convert the time data to "Elapsed Time" data.
These values should give the elapsed time after
pumping began, for Stage 1 (Pumping), and the
elapsed time after pumping ended, for Stage 2
(Recovery) data. Use units such as seconds or
minutes. Any time unit may be used, as long as
it is used consistently.
Convert the water-level measurements to
drawdown measurements. Use units such as
feet or meters, and be consistent. This
conversion is done slightly differently for
pumping data than for recovery data, as
described in what follows.
For Stage 1 (Pumping), if depth-to-water
measurements (e.g., depth from the top of
casing to the water level) were taken, find
drawdown by subtracting depth to water before
pumping from depth to water during pumping.
39
If a transducer was used, calculate drawdown by subtracting height of water during pumping from
height of water before pumping (see right). Some transducers or data loggers can be set to do this
during the test, so that later conversion is not necessary, and this significantly simplifies the work.
For Stage 2 (Recovery) measurements, the quantity plotted is not drawdown, but recovery. Recovery is
the distance that the water level rises after the pump is shut off. If depth-to-water measurements were
taken, then calculate recovery as the depth to water before the pump was shut off minus the depth to
water after the pump was shut off. If a transducer was used, then calculate recovery as the height of
water above the transducer after the
pump was shut off minus the height of
water above the transducer before the
pump was shut off (see right).
Analyzing the Data
Detailed discussions of data analysis
may be found in several texts (e.g.
Freeze and Cherry, 1979; Driscoll,
1986; Walton, 1987; Kruseman &
Ridder, 1990; Dawson and Istok, 1991;
and Fetter, 1994). As a first approach,
however, make Theis and
Jacob time-drawdown plots. If
conditions are ideal, these plots will
allow easy data analysis. If conditions
deviate from the ideal, these plots will
indicate the degree and nature of the
deviation.
Theis Method
A Theis plot may be constructed if at
least one observation well
was used. First, a type
curve (or reverse-type
curve) must be obtained.
A reverse-type curve
printed on acetate may be
purchased from the
National Ground Water
Association. One may be
photo-enlarged from the
figure to the right;
however, doing so will
distort the axes
somewhat. A computer-
generated plot may be
40
created by plotting values of W(u) vs. l/u; however, printing the graph may distort the axes (depending
on the soft- ware used). This problem sometimes may be solved by using the same software to plot
both type curves and data curves. However, even so, it is important to check the plots to ensure that the
axes match. It may be simplest to construct a hand- drawn curve. Although it is tedious, once this is
done, it need never be done again (unless differently scaled graph paper is used).
To construct a hand-drawn curve, use a table of values of W(u) and u, such as found in Appendix 3.
Calculate l/u for each value of u. Plot W(u) vs. l/u on 3 x 5-cycle log-log graph paper, with W(u) on
the y axis (three log cycles), and l/u on the x axis (five log cycles). Several sheets may be cut and
pasted together to cover the entire table of values. However, it is possible to fit the most critical I.
portions of the curve on one sheet by plotting only those values for u = 10-4
to 101
(1/u = 10-1
to 104
)
and W(u) = 10-2
to 101
. Connect the points with a smooth curve, and darken it by going over it in black
ink. Make a dot at the point W(u) = 1, 1/u = 1 (this will be a convenient choice for a match point later
on).
Once the reverse-type curve is available, set it aside. Use a clean sheet of 3 x 5-cycle log-log paper to
plot field data curves. If only one observation well was used, plot drawdown on the y axis (three
cycles) vs. time on the x axis (five cycles) (see below). If more than one observation well was used,
and conditions are laterally homogeneous, calculate time/(radius)2
for all wells. Then plot the draw-
down on the y axis vs. time/(radius)2
on the x axis.
If the points do not fall
along a fairly smooth
curve with the same
general shape as the
reverse-type curve, the
assumption of lateral
homogeneity is likely to
be false. However, given
the natural variation in
geologic data and in
measurements of this
nature, some deviation
from assumed conditions
may always be expected.
This does not necessarily
invalidate the test results.
If more than one observation well was used, and conditions may not be assumed to be laterally
homogeneous, then plot drawdown on the y axis and either time or time/(radius)2
on the x axis. It does
not matter which quantity is chosen for the x axis, as long as it is clearly labeled, but using
time/(radius)2
and plotting the data from each well as a separate line may show the nature of the
heterogeneities.
Plot a curve (or curves) for the pumping stage and a curve (or curves) for the recovery stage.
Ground water facts
Ground water facts
Ground water facts
Ground water facts
Ground water facts

More Related Content

What's hot

Groundwater Hydrogeology
Groundwater Hydrogeology Groundwater Hydrogeology
Groundwater Hydrogeology Jyoti Khatiwada
 
GROUNDWATER LEVEL FLUCTUATION
GROUNDWATER LEVEL FLUCTUATIONGROUNDWATER LEVEL FLUCTUATION
GROUNDWATER LEVEL FLUCTUATIONharikrishnankch
 
Irwe 320 hydrogeology ppt1
Irwe 320 hydrogeology ppt1Irwe 320 hydrogeology ppt1
Irwe 320 hydrogeology ppt1masunga jandika
 
Types of aquifer by bablu bishnoi
Types of aquifer by bablu bishnoiTypes of aquifer by bablu bishnoi
Types of aquifer by bablu bishnoirahul22varsha
 
Chapter 4 groundwater hydrology
Chapter 4 groundwater hydrologyChapter 4 groundwater hydrology
Chapter 4 groundwater hydrologyMohammed Salahat
 
Groundwater occurrence Vertical distribution of groundwater
Groundwater occurrence Vertical distribution of groundwaterGroundwater occurrence Vertical distribution of groundwater
Groundwater occurrence Vertical distribution of groundwaterNaresh Kumar
 
Elements of surface hydrology by Akshay D Raut
Elements of surface hydrology by Akshay D RautElements of surface hydrology by Akshay D Raut
Elements of surface hydrology by Akshay D RautAkshayRaut51
 
Hydrology (Ground water Hydrology)
Hydrology (Ground water Hydrology)Hydrology (Ground water Hydrology)
Hydrology (Ground water Hydrology)Latif Hyder Wadho
 
Chapter 1 occurrence of groundwater
Chapter 1  occurrence of groundwaterChapter 1  occurrence of groundwater
Chapter 1 occurrence of groundwaterUsama Waly
 
Hydrology cycle and ground water (GT&AG)
Hydrology cycle and ground water (GT&AG)Hydrology cycle and ground water (GT&AG)
Hydrology cycle and ground water (GT&AG)Er.Navazhushen Patel
 

What's hot (19)

Groundwater Hydrogeology
Groundwater Hydrogeology Groundwater Hydrogeology
Groundwater Hydrogeology
 
GROUNDWATER LEVEL FLUCTUATION
GROUNDWATER LEVEL FLUCTUATIONGROUNDWATER LEVEL FLUCTUATION
GROUNDWATER LEVEL FLUCTUATION
 
Irwe 320 hydrogeology ppt1
Irwe 320 hydrogeology ppt1Irwe 320 hydrogeology ppt1
Irwe 320 hydrogeology ppt1
 
Types of aquifer by bablu bishnoi
Types of aquifer by bablu bishnoiTypes of aquifer by bablu bishnoi
Types of aquifer by bablu bishnoi
 
Chapter 4 groundwater hydrology
Chapter 4 groundwater hydrologyChapter 4 groundwater hydrology
Chapter 4 groundwater hydrology
 
Groundwater occurrence Vertical distribution of groundwater
Groundwater occurrence Vertical distribution of groundwaterGroundwater occurrence Vertical distribution of groundwater
Groundwater occurrence Vertical distribution of groundwater
 
Elements of surface hydrology by Akshay D Raut
Elements of surface hydrology by Akshay D RautElements of surface hydrology by Akshay D Raut
Elements of surface hydrology by Akshay D Raut
 
Aquifer
AquiferAquifer
Aquifer
 
Ground water
Ground waterGround water
Ground water
 
Ground water extension and contamination
Ground water extension and contaminationGround water extension and contamination
Ground water extension and contamination
 
Circ1139
Circ1139Circ1139
Circ1139
 
Unit4
Unit4Unit4
Unit4
 
Hydrology
HydrologyHydrology
Hydrology
 
Hydrology (Ground water Hydrology)
Hydrology (Ground water Hydrology)Hydrology (Ground water Hydrology)
Hydrology (Ground water Hydrology)
 
Ground water
 Ground water Ground water
Ground water
 
Chapter 1 occurrence of groundwater
Chapter 1  occurrence of groundwaterChapter 1  occurrence of groundwater
Chapter 1 occurrence of groundwater
 
Hydrology cycle and ground water (GT&AG)
Hydrology cycle and ground water (GT&AG)Hydrology cycle and ground water (GT&AG)
Hydrology cycle and ground water (GT&AG)
 
Vertical distribution of groundwater
Vertical distribution of groundwaterVertical distribution of groundwater
Vertical distribution of groundwater
 
Groundwater
GroundwaterGroundwater
Groundwater
 

Similar to Ground water facts

Ground water resources and problems
Ground water resources  and  problems Ground water resources  and  problems
Ground water resources and problems Jahangir Alam
 
GWE 1-9 Lem 1.pptx
GWE 1-9 Lem 1.pptxGWE 1-9 Lem 1.pptx
GWE 1-9 Lem 1.pptxManamnoBeza1
 
Week-2: Basics of Groundwater,
Week-2: Basics of Groundwater, Week-2: Basics of Groundwater,
Week-2: Basics of Groundwater, Suyog Khose
 
The Flow of Fresh Water
The Flow of Fresh WaterThe Flow of Fresh Water
The Flow of Fresh Watermlong24
 
Geology: Water as a Resource
Geology: Water as a ResourceGeology: Water as a Resource
Geology: Water as a ResourceIvy Sabandal
 
Groundwater Notes - Earth's Environment
Groundwater Notes - Earth's EnvironmentGroundwater Notes - Earth's Environment
Groundwater Notes - Earth's Environmenthelgersk
 
Eath sci (compuesto, dimabayao)
Eath sci (compuesto, dimabayao)Eath sci (compuesto, dimabayao)
Eath sci (compuesto, dimabayao)nicoledimabayao
 
Ugrc140 earth resources modified copy
Ugrc140 earth resources modified copyUgrc140 earth resources modified copy
Ugrc140 earth resources modified copySaviour Gidi
 
Unsuccessfulwell Perchedwater table successful wellSpring.docx
Unsuccessfulwell Perchedwater table successful wellSpring.docxUnsuccessfulwell Perchedwater table successful wellSpring.docx
Unsuccessfulwell Perchedwater table successful wellSpring.docxdickonsondorris
 
origin, type and composition of ground water
origin, type and composition of ground waterorigin, type and composition of ground water
origin, type and composition of ground waterDarshan Darji
 
Groundwater occurrence, Rock properties affecting groundwater, Soil classific...
Groundwater occurrence, Rock properties affecting groundwater, Soil classific...Groundwater occurrence, Rock properties affecting groundwater, Soil classific...
Groundwater occurrence, Rock properties affecting groundwater, Soil classific...Naresh Kumar
 

Similar to Ground water facts (20)

Ground water resources and problems
Ground water resources  and  problems Ground water resources  and  problems
Ground water resources and problems
 
Groundwater
GroundwaterGroundwater
Groundwater
 
GWE 1-9 Lem 1.pptx
GWE 1-9 Lem 1.pptxGWE 1-9 Lem 1.pptx
GWE 1-9 Lem 1.pptx
 
Water.ppt.pptx
Water.ppt.pptxWater.ppt.pptx
Water.ppt.pptx
 
Week-2: Basics of Groundwater,
Week-2: Basics of Groundwater, Week-2: Basics of Groundwater,
Week-2: Basics of Groundwater,
 
The Flow of Fresh Water
The Flow of Fresh WaterThe Flow of Fresh Water
The Flow of Fresh Water
 
ground water
ground water ground water
ground water
 
Hydrology 9.pdf
Hydrology 9.pdfHydrology 9.pdf
Hydrology 9.pdf
 
Geology: Water as a Resource
Geology: Water as a ResourceGeology: Water as a Resource
Geology: Water as a Resource
 
Groundwater Notes - Earth's Environment
Groundwater Notes - Earth's EnvironmentGroundwater Notes - Earth's Environment
Groundwater Notes - Earth's Environment
 
Eath sci (compuesto, dimabayao)
Eath sci (compuesto, dimabayao)Eath sci (compuesto, dimabayao)
Eath sci (compuesto, dimabayao)
 
Ugrc140 earth resources modified copy
Ugrc140 earth resources modified copyUgrc140 earth resources modified copy
Ugrc140 earth resources modified copy
 
Unsuccessfulwell Perchedwater table successful wellSpring.docx
Unsuccessfulwell Perchedwater table successful wellSpring.docxUnsuccessfulwell Perchedwater table successful wellSpring.docx
Unsuccessfulwell Perchedwater table successful wellSpring.docx
 
Ground water
Ground waterGround water
Ground water
 
Ground Water Hydrology
Ground Water HydrologyGround Water Hydrology
Ground Water Hydrology
 
Fresh water
Fresh waterFresh water
Fresh water
 
origin, type and composition of ground water
origin, type and composition of ground waterorigin, type and composition of ground water
origin, type and composition of ground water
 
Ct 301 hydrology 5th
Ct 301 hydrology 5thCt 301 hydrology 5th
Ct 301 hydrology 5th
 
lecture-1.pdf
lecture-1.pdflecture-1.pdf
lecture-1.pdf
 
Groundwater occurrence, Rock properties affecting groundwater, Soil classific...
Groundwater occurrence, Rock properties affecting groundwater, Soil classific...Groundwater occurrence, Rock properties affecting groundwater, Soil classific...
Groundwater occurrence, Rock properties affecting groundwater, Soil classific...
 

Recently uploaded

Call for Papers - African Journal of Biological Sciences, E-ISSN: 2663-2187, ...
Call for Papers - African Journal of Biological Sciences, E-ISSN: 2663-2187, ...Call for Papers - African Journal of Biological Sciences, E-ISSN: 2663-2187, ...
Call for Papers - African Journal of Biological Sciences, E-ISSN: 2663-2187, ...Christo Ananth
 
chaitra-1.pptx fake news detection using machine learning
chaitra-1.pptx  fake news detection using machine learningchaitra-1.pptx  fake news detection using machine learning
chaitra-1.pptx fake news detection using machine learningmisbanausheenparvam
 
The Most Attractive Pune Call Girls Budhwar Peth 8250192130 Will You Miss Thi...
The Most Attractive Pune Call Girls Budhwar Peth 8250192130 Will You Miss Thi...The Most Attractive Pune Call Girls Budhwar Peth 8250192130 Will You Miss Thi...
The Most Attractive Pune Call Girls Budhwar Peth 8250192130 Will You Miss Thi...ranjana rawat
 
Software Development Life Cycle By Team Orange (Dept. of Pharmacy)
Software Development Life Cycle By  Team Orange (Dept. of Pharmacy)Software Development Life Cycle By  Team Orange (Dept. of Pharmacy)
Software Development Life Cycle By Team Orange (Dept. of Pharmacy)Suman Mia
 
Introduction to IEEE STANDARDS and its different types.pptx
Introduction to IEEE STANDARDS and its different types.pptxIntroduction to IEEE STANDARDS and its different types.pptx
Introduction to IEEE STANDARDS and its different types.pptxupamatechverse
 
(SHREYA) Chakan Call Girls Just Call 7001035870 [ Cash on Delivery ] Pune Esc...
(SHREYA) Chakan Call Girls Just Call 7001035870 [ Cash on Delivery ] Pune Esc...(SHREYA) Chakan Call Girls Just Call 7001035870 [ Cash on Delivery ] Pune Esc...
(SHREYA) Chakan Call Girls Just Call 7001035870 [ Cash on Delivery ] Pune Esc...ranjana rawat
 
MANUFACTURING PROCESS-II UNIT-5 NC MACHINE TOOLS
MANUFACTURING PROCESS-II UNIT-5 NC MACHINE TOOLSMANUFACTURING PROCESS-II UNIT-5 NC MACHINE TOOLS
MANUFACTURING PROCESS-II UNIT-5 NC MACHINE TOOLSSIVASHANKAR N
 
HARDNESS, FRACTURE TOUGHNESS AND STRENGTH OF CERAMICS
HARDNESS, FRACTURE TOUGHNESS AND STRENGTH OF CERAMICSHARDNESS, FRACTURE TOUGHNESS AND STRENGTH OF CERAMICS
HARDNESS, FRACTURE TOUGHNESS AND STRENGTH OF CERAMICSRajkumarAkumalla
 
Structural Analysis and Design of Foundations: A Comprehensive Handbook for S...
Structural Analysis and Design of Foundations: A Comprehensive Handbook for S...Structural Analysis and Design of Foundations: A Comprehensive Handbook for S...
Structural Analysis and Design of Foundations: A Comprehensive Handbook for S...Dr.Costas Sachpazis
 
Extrusion Processes and Their Limitations
Extrusion Processes and Their LimitationsExtrusion Processes and Their Limitations
Extrusion Processes and Their Limitations120cr0395
 
Sheet Pile Wall Design and Construction: A Practical Guide for Civil Engineer...
Sheet Pile Wall Design and Construction: A Practical Guide for Civil Engineer...Sheet Pile Wall Design and Construction: A Practical Guide for Civil Engineer...
Sheet Pile Wall Design and Construction: A Practical Guide for Civil Engineer...Dr.Costas Sachpazis
 
Processing & Properties of Floor and Wall Tiles.pptx
Processing & Properties of Floor and Wall Tiles.pptxProcessing & Properties of Floor and Wall Tiles.pptx
Processing & Properties of Floor and Wall Tiles.pptxpranjaldaimarysona
 
main PPT.pptx of girls hostel security using rfid
main PPT.pptx of girls hostel security using rfidmain PPT.pptx of girls hostel security using rfid
main PPT.pptx of girls hostel security using rfidNikhilNagaraju
 
(RIA) Call Girls Bhosari ( 7001035870 ) HI-Fi Pune Escorts Service
(RIA) Call Girls Bhosari ( 7001035870 ) HI-Fi Pune Escorts Service(RIA) Call Girls Bhosari ( 7001035870 ) HI-Fi Pune Escorts Service
(RIA) Call Girls Bhosari ( 7001035870 ) HI-Fi Pune Escorts Serviceranjana rawat
 
Introduction and different types of Ethernet.pptx
Introduction and different types of Ethernet.pptxIntroduction and different types of Ethernet.pptx
Introduction and different types of Ethernet.pptxupamatechverse
 
High Profile Call Girls Nagpur Isha Call 7001035870 Meet With Nagpur Escorts
High Profile Call Girls Nagpur Isha Call 7001035870 Meet With Nagpur EscortsHigh Profile Call Girls Nagpur Isha Call 7001035870 Meet With Nagpur Escorts
High Profile Call Girls Nagpur Isha Call 7001035870 Meet With Nagpur Escortsranjana rawat
 
HARMONY IN THE NATURE AND EXISTENCE - Unit-IV
HARMONY IN THE NATURE AND EXISTENCE - Unit-IVHARMONY IN THE NATURE AND EXISTENCE - Unit-IV
HARMONY IN THE NATURE AND EXISTENCE - Unit-IVRajaP95
 

Recently uploaded (20)

Call for Papers - African Journal of Biological Sciences, E-ISSN: 2663-2187, ...
Call for Papers - African Journal of Biological Sciences, E-ISSN: 2663-2187, ...Call for Papers - African Journal of Biological Sciences, E-ISSN: 2663-2187, ...
Call for Papers - African Journal of Biological Sciences, E-ISSN: 2663-2187, ...
 
chaitra-1.pptx fake news detection using machine learning
chaitra-1.pptx  fake news detection using machine learningchaitra-1.pptx  fake news detection using machine learning
chaitra-1.pptx fake news detection using machine learning
 
Call Us -/9953056974- Call Girls In Vikaspuri-/- Delhi NCR
Call Us -/9953056974- Call Girls In Vikaspuri-/- Delhi NCRCall Us -/9953056974- Call Girls In Vikaspuri-/- Delhi NCR
Call Us -/9953056974- Call Girls In Vikaspuri-/- Delhi NCR
 
The Most Attractive Pune Call Girls Budhwar Peth 8250192130 Will You Miss Thi...
The Most Attractive Pune Call Girls Budhwar Peth 8250192130 Will You Miss Thi...The Most Attractive Pune Call Girls Budhwar Peth 8250192130 Will You Miss Thi...
The Most Attractive Pune Call Girls Budhwar Peth 8250192130 Will You Miss Thi...
 
Software Development Life Cycle By Team Orange (Dept. of Pharmacy)
Software Development Life Cycle By  Team Orange (Dept. of Pharmacy)Software Development Life Cycle By  Team Orange (Dept. of Pharmacy)
Software Development Life Cycle By Team Orange (Dept. of Pharmacy)
 
Introduction to IEEE STANDARDS and its different types.pptx
Introduction to IEEE STANDARDS and its different types.pptxIntroduction to IEEE STANDARDS and its different types.pptx
Introduction to IEEE STANDARDS and its different types.pptx
 
(SHREYA) Chakan Call Girls Just Call 7001035870 [ Cash on Delivery ] Pune Esc...
(SHREYA) Chakan Call Girls Just Call 7001035870 [ Cash on Delivery ] Pune Esc...(SHREYA) Chakan Call Girls Just Call 7001035870 [ Cash on Delivery ] Pune Esc...
(SHREYA) Chakan Call Girls Just Call 7001035870 [ Cash on Delivery ] Pune Esc...
 
MANUFACTURING PROCESS-II UNIT-5 NC MACHINE TOOLS
MANUFACTURING PROCESS-II UNIT-5 NC MACHINE TOOLSMANUFACTURING PROCESS-II UNIT-5 NC MACHINE TOOLS
MANUFACTURING PROCESS-II UNIT-5 NC MACHINE TOOLS
 
DJARUM4D - SLOT GACOR ONLINE | SLOT DEMO ONLINE
DJARUM4D - SLOT GACOR ONLINE | SLOT DEMO ONLINEDJARUM4D - SLOT GACOR ONLINE | SLOT DEMO ONLINE
DJARUM4D - SLOT GACOR ONLINE | SLOT DEMO ONLINE
 
HARDNESS, FRACTURE TOUGHNESS AND STRENGTH OF CERAMICS
HARDNESS, FRACTURE TOUGHNESS AND STRENGTH OF CERAMICSHARDNESS, FRACTURE TOUGHNESS AND STRENGTH OF CERAMICS
HARDNESS, FRACTURE TOUGHNESS AND STRENGTH OF CERAMICS
 
Structural Analysis and Design of Foundations: A Comprehensive Handbook for S...
Structural Analysis and Design of Foundations: A Comprehensive Handbook for S...Structural Analysis and Design of Foundations: A Comprehensive Handbook for S...
Structural Analysis and Design of Foundations: A Comprehensive Handbook for S...
 
Extrusion Processes and Their Limitations
Extrusion Processes and Their LimitationsExtrusion Processes and Their Limitations
Extrusion Processes and Their Limitations
 
Sheet Pile Wall Design and Construction: A Practical Guide for Civil Engineer...
Sheet Pile Wall Design and Construction: A Practical Guide for Civil Engineer...Sheet Pile Wall Design and Construction: A Practical Guide for Civil Engineer...
Sheet Pile Wall Design and Construction: A Practical Guide for Civil Engineer...
 
Processing & Properties of Floor and Wall Tiles.pptx
Processing & Properties of Floor and Wall Tiles.pptxProcessing & Properties of Floor and Wall Tiles.pptx
Processing & Properties of Floor and Wall Tiles.pptx
 
main PPT.pptx of girls hostel security using rfid
main PPT.pptx of girls hostel security using rfidmain PPT.pptx of girls hostel security using rfid
main PPT.pptx of girls hostel security using rfid
 
(RIA) Call Girls Bhosari ( 7001035870 ) HI-Fi Pune Escorts Service
(RIA) Call Girls Bhosari ( 7001035870 ) HI-Fi Pune Escorts Service(RIA) Call Girls Bhosari ( 7001035870 ) HI-Fi Pune Escorts Service
(RIA) Call Girls Bhosari ( 7001035870 ) HI-Fi Pune Escorts Service
 
Introduction and different types of Ethernet.pptx
Introduction and different types of Ethernet.pptxIntroduction and different types of Ethernet.pptx
Introduction and different types of Ethernet.pptx
 
★ CALL US 9953330565 ( HOT Young Call Girls In Badarpur delhi NCR
★ CALL US 9953330565 ( HOT Young Call Girls In Badarpur delhi NCR★ CALL US 9953330565 ( HOT Young Call Girls In Badarpur delhi NCR
★ CALL US 9953330565 ( HOT Young Call Girls In Badarpur delhi NCR
 
High Profile Call Girls Nagpur Isha Call 7001035870 Meet With Nagpur Escorts
High Profile Call Girls Nagpur Isha Call 7001035870 Meet With Nagpur EscortsHigh Profile Call Girls Nagpur Isha Call 7001035870 Meet With Nagpur Escorts
High Profile Call Girls Nagpur Isha Call 7001035870 Meet With Nagpur Escorts
 
HARMONY IN THE NATURE AND EXISTENCE - Unit-IV
HARMONY IN THE NATURE AND EXISTENCE - Unit-IVHARMONY IN THE NATURE AND EXISTENCE - Unit-IV
HARMONY IN THE NATURE AND EXISTENCE - Unit-IV
 

Ground water facts

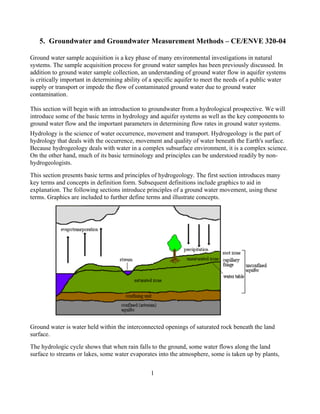
  • 1. 1 5. Groundwater and Groundwater Measurement Methods – CE/ENVE 320-04 Ground water sample acquisition is a key phase of many environmental investigations in natural systems. The sample acquisition process for ground water samples has been previously discussed. In addition to ground water sample collection, an understanding of ground water flow in aquifer systems is critically important in determining ability of a specific aquifer to meet the needs of a public water supply or transport or impede the flow of contaminated ground water due to ground water contamination. This section will begin with an introduction to groundwater from a hydrological prospective. We will introduce some of the basic terms in hydrology and aquifer systems as well as the key components to ground water flow and the important parameters in determining flow rates in ground water systems. Hydrology is the science of water occurrence, movement and transport. Hydrogeology is the part of hydrology that deals with the occurrence, movement and quality of water beneath the Earth's surface. Because hydrogeology deals with water in a complex subsurface environment, it is a complex science. On the other hand, much of its basic terminology and principles can be understood readily by non- hydrogeologists. This section presents basic terms and principles of hydrogeology. The first section introduces many key terms and concepts in definition form. Subsequent definitions include graphics to aid in explanation. The following sections introduce principles of a ground water movement, using these terms. Graphics are included to further define terms and illustrate concepts. Ground water is water held within the interconnected openings of saturated rock beneath the land surface. The hydrologic cycle shows that when rain falls to the ground, some water flows along the land surface to streams or lakes, some water evaporates into the atmosphere, some is taken up by plants,
  • 2. 2 and some seeps into the ground. As water begins to seep into the ground, it enters a zone that contains both water and air, referred to as the unsaturated zone or vadose zone. The upper part of this zone, known as the root zone or soil zone, supports plant growth and is crisscrossed by living roots, holes left by decayed roots, and animal and worm burrows. Below lies an intermediate zone, followed by a saturated capillary fringe, which results from the attraction between water and rocks. As a result of this attraction, water clings as a film on the surface of rock particles. Water moves through the unsaturated zone into the saturated zone, where all the interconnected openings between rock particles are filled with water. It is within this saturated zone that the term "ground water" is correctly applied. Ground water is held in aquifers, which are discussed in the following sections. Ground water is often thought of as an underground river or lake. Only in caves or within lava flows does ground water occur this way. Instead, ground water is usually held in porous soil or rock materials, much the same way water is held in a sponge. Unconfined Aquifers In unconfined aquifers, the ground water only partially fills the aquifer and the upper surface of the ground water (the water table) is free to rise and decline. The ground water is at atmospheric pressure. The height of the water table will be the same as the water level in a well constructed in that unconfined aquifer. The water table typically mimics, in a subdued way, the topography of the land surface above, resulting in a water table with hills, valleys, or flat areas. It is
  • 3. 3 important to note that unconfined aquifers, especially those close to the surface, can be vulnerable to contamination from activities on the land surface. Confined Aquifers Confined aquifers may also be referred to as artesian aquifers. A confined aquifer is sandwiched between confining beds (layers of impermeable materials such as clay which impede the movement of water into and out of the aquifer). Because of the confining beds, ground water in these aquifers is under high pressure. Because of the high pressure, the water level in a well will rise to a level higher than the water level at the top of the aquifer. The water level in the well is referred to as the potentiometic surface or pressure surface. Even in a confined aquifer, water seeks its own level. Geological strata are not perfectly horizontal. At some point the lithological unit that comprises the confined aquifer is exposed to the surface. This is the aquifer'srecharge zone, and it may be miles away from where one hopes to construct a well. The "confined" aquifer is actually unconfined at the recharge zone. In order for pressure to build, the water level in the recharge zone must be at a higher elevation than the base of the confining unit. When a well is drilled through the confining unit, usually far from the recharge zone, the water in this well will rise to the level of the water at the recharge zone. In some instances this may be above the surface of the ground, in which case the well is called aflowing artesian well. This same situation, where the level of the water at the recharge zone is above the base of the confining unit, leads to the appearance of springsor seeps where the confining unit is penetrated by a hillside. It is important to note that confining beds not only serve to hamper the movement of water into and out of the aquifer, they also serve as a barrier to the flow of contaminants from overlying unconfined aquifers. For this same reason, however, contaminants that reach a confined aquifer through a poorly constructed well or through natural seepage, can be extremely difficult and expensive to remove. This section introduces the basic concepts of ground water and surface-water interactions, the meaning of water levels in piezometers and wells, and the measurement of water level and discharge. Surface Expressions of Ground Water Whether streams, ponds, lakes, or oceans, any surface-water bodies are likely to be surface expressions of ground water. Some, like puddles after a rainstorm, are ephemeral, or short-lived. Others, like the oceans, are perennial, or long-lasting. In either case, we may gain valuable information about subsurface conditions by examining surface-water/ground water interactions. In some cases and under some conditions, surface water is moving toward ground water. This is the case with losing streams, and it also may be true for losing ponds, lakes, wetlands, or puddles. The opposite condition might also exist: Water might be moving from ground water toward the surface "gaining" stream, pond, wetland, or other water body.
  • 4. 4 To determine the direction of movement, consider water levels in wells or piezometers near the surface- water body. The wells or piezometers must be open to the same body of rock or sediment that holds the surface water, and they must be hydraulically connected. A lower level in the wells indicates that the surface- water body is losing, whereas a higher level in the wells indicates that it is gaining (see figure below). Temperature may be another indicator. In temperate regions, ground water tends to be colder than surface water during the summer and warmer than surface water during the winter. Some environments in which this would not be true would be zones of hydrothermal activity (e.g., hot springs), or areas where the surface water originates as melt water from glaciers. Differences in water chemistry might indicate flow directions, as well. Any time a surface-water body appears to be losing water to the ground water, c6nsider the possibility that the surface water may be perched. In this situation, the rate at which water is added to the surface water exceeds the rate at which the underlying rock or sediment can transmit or "drain" the surface water. For example, a heavy rain or sudden snowmelt might cause a temporary pond to form on clay-rich soil. A clay lens near the surface in some glacial materials might cause the formation of a perpetual wetland at the surface, whereas the regional water table lies much farther below. Subsurface Expressions of Ground Water Geologists look for outcrops of rock to provide clues about subsurface geology. But where no outcrops exist, their information may come from drillhole data. Likewise, hydrogeologists can learn a great deal from "outcrops" of ground water: springs, seeps, and some other surface-water bodies. But where no hydrogeologic outcrop exists, hydrogeologists must rely on data from holes drilled to puncture the ground water's surface and allow us to examine its nature. Why Is This the Water Level? Ask that question any time you encounter a water level, whether surficial or sub-surficial. If surface water, is it gaining or losing? If subsurface, is the water level from an aquifer or aquitard? If an aquifer, is it confined, semiconfined, or unconfined? Is the water level the result of flow from fractures? Is it from a cave, mine, conduit, tunnel, pipeline, or drainage tile? Was the water level measured in a piezometer? A well? What is the screened or open interval in the well?
  • 5. 5 One fairly unusual subsurface expression of ground water is water in caves or caverns. Some of these hold subsurface springs, streams, and ponds. Of course, these features occur only where large underground openings exist, and they are particularly likely to be in karst regions. Other underground conduits might not be natural. For example, such human-made features as tunnels, underground mines, or buried conduits or pipes might be affected by ground water. In these cases, consider how permeable the walls of the opening are, and particularly with mines or pipes, consider whether water is actively being pumped or drained from the opening. Perhaps more common than these features are holes we put in the ground to find the water level. Piezometers and wells are the cornerstones of hydrogeologic data. Water Levels in Piezometers A piezometer is a pipe installed in the ground, and it has a very short (less than 1 ft) intake, or screened or open interval. It may even have no screen at all. A piezometer is installed specifically for the purpose of determining hydraulic head at a specific point within an aquifer or aquitard. The bottom opening of the piezometer, or its intake, is the point at which it makes the measurement. The water level in a piezometer generally does not give directly the position of the water table or potentiometric surface. (Potentiometric surface is referred to as "piezometric" surface in some texts.) A piezometer gives the location of the water table only if its intake is positioned such that it barely penetrates the water table (see figure to left). The likelihood that this will occur probably is not great. If it does occur, it probably will be coincidental, and so piezometers are most useful when their screens are below the water table. However, hydraulic head varies vertically. As a result, if a piezometer is installed with its intake more than a few feet below the water table, vertical components of flow will prevent it from giving the water table location directly. When enough hydraulic head values are available, taken from multiple piezometers, a flow net may be constructed from the data, and the location of the water table or potentiometric surface may be determined from the flow field.
  • 6. 6 Piezometer nests are groups of three or more piezometers installed side by side, but measuring hydraulic heads at various depths (see figure above). Reading the water levels in nested piezometers allows one to determine the direction and magnitude of a vertical gradient. Begin by finding the difference in head (H) between two of the piezometers; usually, this is the difference in elevation (above a datum) of water levels in the piezometers. Next, find the distance (dl) between the points at which the piezometers are open to the ground water. The gradient is M/ dl, and the direction of the gradient is from the opening in the piezometer with the higher water level to the opening in the piezometer with the lower level (see figure to right). Piezometers may be regarded as small-diameter wells, and as such, they may not be well-suited for sampling for chemical analysis, because their intakes usually are too short to allow for easy flow of water into and out of the piezometer. For the same reason, piezometers are not appropriate for performing pumping tests or other tasks requiring pumping large volumes of fluid from an aquifer, such as contaminant recovery. They may, however, be suitable for slug or bail tests. Water Levels in Wells A well is a pipe installed in the ground, and it has a longer intake than does a piezometer. The optimal length of a well intake depends on desired yield and formation characteristics. Wells are installed for the purpose of extracting ground water, whether for domestic or municipal use, or irrigation; for pumping tests; for extracting samples for chemical analyses; for product recovery; dewatering an area for construction or engineering purposes; or for injecting fluids, as in a recharge well or waste-injection well. The water level in a well indicates the conditions through the screened or open interval of the well. The water level in the well might be above, at, or below the ground surface. When the well water level is above the ground surface, it indicates that the screened or open interval is under confining conditions. When the well water level is at or below ground surface, it may indicate one of two things. First, it might indicate that the open or screened interval is not under confining conditions; the aquifer is unconfined. Or, second, it might indicate that the aquifer is confined, but that the confining pressure does not create enough head to drive the well water above ground level. Drill hole data, geologic maps and cross- sections, or hydraulic testing of the well might be used to determine which of these conditions is present. In unconfined aquifers, when the intake is short (no more than a few meters) and it intersects the water table, the level of water in the well indicates that of the water table. But if the screened or open interval is longer, or if the top of that interval is positioned below the water table, the water level in the well does
  • 7. 7 not give the level of the water table. Instead, the water level reflects conditions only for that screened or open interval (see figure below). To locate the position of the water table, a piezometer nest or a well of appropriate design must be used. Finding Wells To find already-existing wells in the field, the easiest place to start is to ask the property owner where the wells are. Another source of information is maps of locations given on site plans or in drilling logs. Government agencies might have logs that indicate location. In the field, look for pipes sticking up out of the ground, or plates mounted flush with ground surface. Look for stone- or concrete-lined access pits, possibly covered by wood or metal sheeting. Follow water supply lines leading out of houses or other buildings. Be aware that wells may be inside buildings. Look for stone or clay tile drainage ways. Look for windmills or wind- lasses that may have been used to pump water out of the ground; be aware that windmills also might be used for generating electricity or grinding grain. Look for storage tanks, water towers, or pumping facilities; any of these might lead you to a well. Well Depth The depth of a well is the vertical distance from the bottom of the well to the surface. In order to keep measurements consistent, establish some reference point at the surface. The reference point might be the top of the well casing (TOC), or it might be ground level (grade). The depth of a well should be recorded on the well construction diagram or log. However, each time the water level is measured, the well depth should be determined by sounding, if possible. This should be done because silt may have settled in the bottom of a well, frost heave may have damaged it, or well construction diagrams may be unavailable or inaccurate. In some wells, however, the presence of pumps and discharge lines may make depth sounding impossible. To sound the bottom of a well, first check the well construction diagram, if available. This will indicate the approximate depth. Then lower a weighted cable or tape down the hole until it goes slack, and measure the cable length. It may be convenient to use a water-level indicator for this purpose.
  • 8. 8 If the well has a pump installed in it, watch out for the pump lines. The line may accidentally become wrapped around one of them and tangle. Do not play out too much line; it may have caught on something, and as you continue unreeling it, it will just become more and more tangled. Water-Level Measurements Water-level measurements provide a basic piece of information used in hydrogeologic studies. Water level may be a "static" level or a "pumping" level; a static level is measured when the well is not being pumped, and has not been pumped for some time. A pumping level is measured when the well is being pumped or has been pumped recently. The method for making a water-level measurement depends on whether the well is flowing or nonflowing. This section describes some of these methods. Measuring Water Level in Flowing Wells In some wells, called flowing wells, water flows out the top of the well naturally and without any pumping. The potentiometric surface associated with these wells is above the ground surface. If a well is flowing, and it is necessary to know the elevation of the potentiometric surface in the aquifer tapped by the well, the water level must be measured either directly or by taking a pressure measurement. Direct Measurement. Direct measurement involves allowing the water to rise to the level of the potentiometric surface and then measuring its height above ground surface. To use this method, a conduit for the water to rise in must be provided. This method works only if it is physically possible to measure the height above the ground surface. If it is more than about 8-10 ft above the ground, this will be difficult. Attach the conduit, which might be a pipe or piece of tubing, to the top of the well. It is critical that there be no leaks at the joint or anywhere along the conduit. The pipe or tubing may be of any diameter; it is perfectly acceptable for the tubing to be the small diameter, clear vinyl tubing commonly found in laboratories, even if the well has a much larger diameter. Clear tubing has the added advantage of making it easy to see the water level. Alternatively, a piece of PVC or metal pipe might be attached to the top of the well; in this case, you will need to use some nonvisual method of finding water level. No matter what type of conduit is used, it is not important that it be straight. The critical measurement is the elevation of the water level above the ground, and the path it takes is not significant. Measure the vertical distance between the ground surface and the water level in the conduit. Record the water level as the distance in feet or meters above the ground surface. Based on survey data, this may be referenced to a known datum, for example, mean sea level. Equipment List -Conduit and tools and materials for attaching it to the wellhead -Tape measure -Keys and tools to open well and locked gates -Water-level indicator, if conduit is not transparent -Well construction diagram and boring log -Field notebook, pens, pencils, calculator
  • 9. 9 -Air monitoring devices, as needed -Personal protective equipment, as needed Pressure Measurement. To measure water level in a flowing well by pressure measurement, attach a pressure gauge to the top of the well casing. Stop the flow of water by capping the well; ensure that there are no leaks. Because the well is capped off, pressure or head measurements made in this way are sometimes referred to as "shut-in pressures" or "shut-in heads." Read water pressure in units of length (feet or meters). Record this value as height of the water level above the elevation of the pressure gauge. Note that the pressure gauge is not at ground level; measure and record its elevation relative to ground level. If the gauge reads in units of pressure, such as psi (pounds per square inch), this pressure measurement can be converted easily to a head measurement. To do this, use the specific weight of water, 62.4 pounds per cubic foot (pcf). An example follows: Head above measuring point gauge = waterofweightspecific readinggauge ... . Be sure to account for differences in units. For example, if the pressure gauge reads 10 psi, the head can be calculated as follows: Head = == ft in x ft in x lb ft x in lb pcf psi 1 .12 1 .12 4.62 1 . 10 4.62 10 3 2 23 ft Equipment List -Well cap with fitting to attach pressure gauge -Pressure gauge -Wrenches to attach well cap -Keys and tools to open well and locked gates -Well construction diagram and boring log -Field notebook, pens, pencils, calculator -Air-monitoring devices, as needed -Personal protective equipment, as needed Measuring Water Level in Nonflowing Wells In a nonflowing well, it usually is necessary to lower a probe into the well to find the water level. Probes range from very simple to complex in their construction.
  • 10. 10 Calibrated Lines. A weighted line is a simple means of finding depth to water. If chemical composition or contamination of the well water is of no concern, the line may be coated with chalk at its lower end. Ordinary classroom chalk works well for this purpose. Lower the line into the well until it has reached the water. Mark the place on the line where it touches the reference point of your choice. The top of casing (TOC) and the ground surface are two common choices; record which point is used, and use the same point every time. Measure the length of the line from that point to the top of the wetted portion, which is shown by the washed-off or wet chalk (see picture above). That measurement is the depth to water from the reference point. When using this method, it is helpful to use a line that has been calibrated to the nearest foot or meter or less. Lower the line until the end is wetted and a whole number of feet or meters touches the measuring point. Then simply subtract the length of the wetted portion. Using a measuring tape as a chalk line eliminates the need for calibrating the line. A steel or fiberglass tape with raised markings may be used, and the end may be chalked or the wetted portion may be measured, without chalking. If using a fiberglass tape, be aware that the tape will stretch somewhat it hangs down in the well. The tape manufacturer should be able to tell how m1tch stretch to expect; in some cases, this information is printed right on the tape or housing. Be aware that wet fiberglass tape can stick to the side of a well, making measurements difficult. Also, the weight on the end of the line will displace water, thus raising the water level. This is particularly significant in small-diameter wells. To avoid using chalk, it is simpler, cleaner, and more efficient to use a "popper" at the end of the line to indicate water surface. Poppers are cheap and easy to construct; see the picture to the right for an example. Attach the popper to the end of a calibrated line or measuring tape. Lower it until you hear the "pop" it makes when it reaches the water surface. It may be difficult to hear this noise if a pump is running, so this method may not be appropriate in all situations. Don't forget to add the length of the popper to the depth measurement. Electric cable water-level indicators work on the principle that an electrical cur- rent will pass through water fairly easily. These indicators consist of a current source; two wires attached to the source at one end and weighted at the other; and an indicator of current, commonly a light, buzzer, or ammeter. The weighted ends of the wires are dropped down the well, and the current source is activated. When the wire ends touch the water surface, it completes the circuit, and the current indicator reflects that fact (see diagram below). An inexpensive indicator of this type may be built fairly easily by using light gauge two-strand wire with the ends exposed and a weight taped to one end. The other ends of the wire strands should be connected individually to the leads of a continuity tester, or multitester or ammeter wired to a battery.
  • 11. 11 The disadvantage to this type of homemade instrument is that the line is not calibrated, which will make measurements inconvenient. But especially for shallow water levels, it will work adequately for studies not requiring a high degree of precision. This type of indicator will not work if a free organic liquid (e.g., gasoline or oil) is floating on top of the water in the well, because organic liquids usually are not good conductors of electricity. The same may be true of water with a very low dissolved-salt content. This type of indicator may give a false reading if the wire ends touch water that has condensed on the inside of the well casing, above the true water surface. If the well is constructed with metal casing, and if the wires contact the casing, it may conduct the current and give a false reading. Finally, in using an electric cable water-level indicator, it is better to rely on the depth-to- water reading obtained while lowering the cable rather than that obtained while raising it. As the probe is raised, water may temporarily adhere to it, giving the impression that it is still submerged, when in fact, it may not be. In using any of these methods, be certain when reading depth to water on a calibrated line that you are reading up from below the reference point, and not down from above it (see diagram to the right). In addition, be aware that some measuring tapes are calibrated in tenths of feet rather than inches. Acoustic Indicators. Acoustic water-level probes direct sound waves toward the bottom of the well. The sound bounces off the water and returns to the surface, where a detector determines how long it took the sound to "make the trip." A long time interval indicates a deeper water level. These probes are more expensive than electric cable indicators, and they require periodic calibration. Interface Probes. Interface probes are particularly useful in ground water contamination studies. These probes detect the level at which there is an interface between water and oil, gasoline, or solvent. They may have varying designs. Perhaps the least complex design is simply two electric cable indicators in one probe, with a tiny
  • 12. 12 difference between the height of indicators on the probe. The interface is the level at which the upper indicator is situated within floating "product," or organic liquid, while the lower indicator is in water. At this level, no current will pass through the upper indicator, but current will pass through the lower (see figure below). When using an interface probe, remember that the water level in the well will be depressed somewhat because of the presence of the overlying product. The corrected depth to water may be found by using the following formula. Corrected Measurement of Depth to Water = Field Measurement of Depth to Water - (Thickness of LNAPL Layer X WaterofDensity LNAPLofDensity .. .. Note that the fluid densities may be strongly temperature-dependent. Float Recorders. When continuous measurements must be recorded, a float recorder may be used for convenience. Design of a float recorder for a well is the same as that of a float recorder for a stream gage. A float attached to a cable floats at the water surface. The cable is wrapped around a pulley, with a counterweight at the other end. As water level rises and falls, the float and pulley adjust, and the change is recorded either digitally or by a chart-and-pen system. The major difference between this setup and that of a stream gage is that the float, cable, and counterweight must fit within the diameter of the well, and so are smaller than those used for a stream gage. Pressure Transducers. Pressure transducers measure a particular kind of water level. They do not measure depth to water in a well. Rather, these instruments measure height of the column of water situated above the probe (see figure to left). This makes them useful for
  • 13. 13 applications such as pumping tests, slug tests, or other situations in which water level changes with time. They are particularly useful in tests in which water level changes rapidly. Pumping and slug tests are described in the following section. The design principle of pressure transducers is that the pressure on the tip of the probe is related to the height of the water column covering the probe, an electrical current passes through the tip of the probe, and the current is proportional to the pressure. A digital readout device attached to the transducer cable translates the current into head measurements. These may read out directly or may be stored digitally (in "dataloggers") for later retrieval or downloading. Because the pressure reading must be corrected for barometric pressure, the transducer cable carries a tiny air line that allows the device to compensate for air pressure. Some may require temperature corrections as well. Equipment List Tape measure or ruler Keys and tools to open well and locked gates Well construction diagram and boring log Field notebook, calculator, pens, pencils, Air-monitoring devices, as needed Personal protective equipment, as needed Decontamination equipment, as needed Water-level indicator (one or more of these) 1. Calibrated line Tape measure (steel preferred) Carpenter's chalk or popper and materials to affix it to the tape measure 2. Electric cable water-level indicator Water-level indicator Spare batteries 3. Interface probe Interface probe Spare batteries Other probes as needed (e.g., acoustic probe, pressure transducer)
  • 14. 14 Aquifer and Aquitard Testing Section Overview Hydrogeologic parameters of aquifers and aquitards are best determined in situ. Although hydraulic conductivity, transmissivity, and storativity may be estimated from charts of common values or from laboratory testing, field tests are much more likely to give results that more closely predict the aquifer or aquitard's actual behavior. This section describes principles and procedures for planning and carrying out slug tests and pumping tests, and describes the rudiments of data analysis for these tests as well. Additionally it offers a few considerations on tracer tests. Slug Tests What Is a Slug Test? The purpose of a slug test is to obtain a preliminary estimate of the hydraulic conductivity of aquifer or aquitard material in situ. In some situations, storativity may also be obtained from slug test data. In a slug test, an instantaneous change in water level is caused in a well, and then the rate at which water level returns to the initial level is measured (see below). A faster return to initial head correlates with a higher value of hydraulic conductivity. Slug tests are of two types: falling-head tests and rising- head tests. When a slug test is performed on a well, one of each type of test may be conducted in sequence. A falling-head test involves causing an instantaneous rise in water level, then observing the head as it falls back to the initial level. A rising-head test involves causing an instantaneous drop in water level, then observing the head as it rises back to the initial level. Slug tests may be relatively inexpensive, require little equipment, are frequently rapid, and can be used to test the characteristics of either
  • 15. 15 aquifers or aquitards. In addition, slug testing involves extracting little or no water from a well; this is particularly important if the water is contaminated and its disposal is regulated. The major disadvantage of slug testing is that it gives a measure of hydraulic conductivity only for the zone immediately adjacent to the well. As a result, measurements from slug tests cannot incorporate or account for the effects of large-scale heterogeneities or fractures which occur more than a short distance from the well intake. When fractures intersect or occur close to the well intake, however, the results of the slug test may be controlled by the fractures, and may not reveal the nature of the matrix permeability. Slug test field and analytical procedures are described in numerous other sources, among them Freeze and Cherry (1979), Domenico and Schwartz (1998), Kruseman and de Ridder (1990), Dawson and Istok (1991), and Watson and Burnett (1995). The ASTM has developed several standard methods pertaining to slug tests. ASTM Standard Test Method D4044 gives the field procedures, while a half- dozen others describe analytical procedures. Slug Test Procedures This section covers slug test planning, field procedures, data processing, and data analysis. Planning a Slug Test The first step in a slug test is to assemble the necessary tools and instruments. An equipment list is given at the end of this section. As that list shows, in addition to the normal equipment for opening a well and measuring depth to water, a few special items are required. These are described in more detail here. An instrument for measuring water level in the well is needed. More specifically, the instrument should be suited to measuring changes in water level. For materials of low to medium hydraulic conductivity, such as clays, silts, silty sands, and most rocks, any water-level indicator may work. For materials of high hydraulic conductivity, such as clean sands, gravels, and fractured rocks, using a pressure transducer in addition to a water-level indicator is recommended, and may be absolutely necessary, because measurements must be taken very rapidly. A data logger will simplify the job, because it can take literally hundreds of measurements per second and store them in digital form for later downloading and processing by computer. These instruments are described in the previous section. A means of instantaneously raising and lowering water in the well is needed. This "slug" gives the test its name. Possibilities are a solid slug, a bailer, a slug of water, and simple air pressure or vacuum. A solid slug is a cylindrical object, metal or plastic, with a loop or hole at its end where a line can be attached. Slugs may be 2-3 feet long or longer. In higher- conductivity materials, longer slugs are better, because they cause a greater change in water level, which in turn takes longer to recover to the original level. Because the test is longer, readings are more manageable, as they need not be taken as rapidly. In low-hydraulic-conductivity materials, however, tests may take hours or days, so shorter slugs are more convenient. The advantages of using a slug are that, if clean, it does not introduce
  • 16. 16 contaminants into the well, and that the rise and fall of water levels are virtually instantaneous. If a slug is to be homemade, the critical factors are that it should have a sturdy loop for attaching a line, it should be narrow enough to fit down the well and still admit a transducer cable or other water-level measuring device, and it must be heavy or dense enough to sink once it hits the water. A bailer is similar to a slug except that it is hollow and can be filled with water. It also has a valve at the bottom into which water flows as the bailer is lowered into a well. To cause a rise in water level, fill the bailer with water at the ground surface, and rapidly lower it into the well, below the water surface. Do not do this if the well is to be sampled soon after for chemical analysis. To cause a drop in water level, rapidly withdraw the bailer. Use care in this portion of the test, as the bailer may leak water out the bottom, which would cause the subsequently measured rising head data to be inaccurate. A slug of clean water-a volume of water poured quickly down the well may be introduced into the well to cause a rise in head. The advantage of this method is that it costs nothing. However, it has three drawbacks. First, because of the time it takes to pour the water, the change in water level is not instantaneous. Second, only a falling-head test can be performed this way, not a rising-head test. For a rising-head test, which is more accurate in certain situations, some means of with- drawing water still will be needed. And, third: using this method will alter water chemistry within the well, so this method should not be used if the well is to be sampled for chemical analysis. Air pressure or suction may be used to conduct a "pneumatic" slug test. These tests have the advantage of not introducing any materials into the well at all, which minimizes the risk of contamination. In addition, the change in water level is virtually instantaneous, making it possible to use slug tests even in wells screened in aquifers of very high hydraulic conductivity. For more information, see Leap (1984) and the report by Orient and colleagues (1987). Other requirements of a slug test deal more with the test well than the equipment. For a slug test to be successful, the column of water in the well must be long enough to accommodate the transducer (if one is to be used) as well as the slug. Information on length of the water column may be available from the boring log or well completion diagram, or from previous data-collection efforts. The diameter of the well must be large enough to accommodate the slug and the water-level measuring device simultaneously. The entire well screen should be submerged below water level in the well throughout the test. For reasons explained under the subsection "Interpret the Results," which follows, if the screen is not submerged through the whole test, the falling-head test will not be reliable. In this situation, only the rising-head test results should be considered credible. For most test conditions, it still will be necessary to insert a slug and allow the water level to fall to the original elevation before conducting the rising-head test; thus, data on the rate of fall of water may still be kept. However, this may not constitute a tenable slug test. Finally, for the slug test to be successful, inserting or withdrawing the slug must cause a significant change in water level. The amount of change will depend on the diameter of the well and the length and diameter of the slug. A short narrow-diameter slug may cause little change in a large-diameter well. For example, a 3-foot-long, l-inch-diameter slug will cause only a 2.25-inch rise in water level in a 4-inch-diameter well. This small change in water level will not lead to precise measurements during the test; a larger or longer slug should be used.
  • 17. 17 Equipment List • Watch (with second hand), or stop watch, or timer • Tools and keys to gain access to the well • Slug (solid, bailer, or water) or device to apply air pressure or vacuum Water • level indicator and spare batteries • Field notebook, pencils, and pens • Calculator • Pressure transducer, as needed, with spare batteries • Data logger with cables to attach to the transducer, as needed • Air-monitoring equipment, as needed • Personal protective equipment, as needed Field Procedures Prepare to Run the Test. Before beginning the test, measure the depth-to-water level in the well. The water level must be constant and steady for the test to be valid. Also measure depth to the bottom of the well to be sure that the well can accommodate the slug and water-level measuring device. If using a transducer, lower it into the water to the appropriate depth. If using a slug or bailer, set the transducer deep enough in the well to avoid damage from the submerged slug or bailer. However, keep the transducer sufficiently far enough above the bottom of the well to avoid damaging it or clogging it with silt. Check the water level, and wait for it to return to normal. Introducing the transducer and cable into the well will displace some water, and the water level must recover before the test begins. If the well is in a layer of low hydraulic conductivity, this may take a long time. If it takes an hour or more, then expect a very long slug test, perhaps lasting days or more. Under these conditions, it is wise to use a small slug. In addition, using a transducer may not be wise, unless it can be "dedicated" to the well (left undisturbed in the well for the duration of the test, which in such cases may be a period of days or weeks). Measurements will not need to be taken rapidly in a situation like this, and because the transducer measurements must be checked against depth-to-water measurements anyway, the transducer offers no real advantage. Just before starting the test, measure and record the water level. If using a transducer, the proper level to record is the height of the column of water above the transducer. If using any other instrument, the proper level to record is depth-to- water level from some reference point. Be sure to note what instrument is used, as well as the reference point. Conduct a Falling-Head Test Introduce the Slug into the Well. Begin the test by introducing the slug into the water in the well. This should be virtually instantaneous, but it is important to avoid creating splashes or turbulence in
  • 18. 18 the well. If using a solid slug, it might be wise to lower the slug into the well before the test such that it is just above the water surface. Then, when the test begins, you can lower it quickly into the water. Be careful not to damage the transducer, if you are using one, by dropping the slug onto it. If using a bailer, consider using the same procedure as for a solid slug. However, be careful that water does not leak out of the bailer before the test begins, causing a premature rise in water level. If pouring a slug of water into the well, pour quickly. This is particularly important when the formation has high hydraulic conductivity, because water level will change rapidly. No matter what type of slug is used, once it is introduced into the water, it should not be moved for the duration of the test. Take Measurements of Water Level Begin measuring the water level immediately after introducing the slug into the well. The first objective is to measure the highest water level. This level will occur within the first second or so after the slug is lowered, and the level will begin to drop immediately. Be prepared for this before lowering the slug. Record both the measurement and the time of measurement, to the nearest fraction of a second, if possible. The next objective is to read and record the water level as it returns to normal, and also to record the time each water-level measurement is made. The sample data form (right) shows readings that should be made in the field. Continue making and recording measurements of the water level and time, according to a schedule. The schedule will depend on how fast the water level falls, which depends on the hydraulic conductivity (K) of the formation. For materials of moderate hydraulic conductivity, measure the water level every second for the first 10 seconds, then every 10 seconds for the first minute, every minute for the first 5 minutes, and every 5 minutes until the water level returns to the static pretest level. In materials of lower hydraulic conductivity, begin on the same schedule, but after three constant readings in a row, skip to the next higher time interval. Because a well in materials of low hydraulic conductivity may take days or even months to recover, it may be appropriate to make readings at intervals of 1 to 6
  • 19. 19 hours or longer, even weeks. Do not disturb the slug or transducer during the test, as this will change the water level and compromise the results. If the well must be capped while the water level recovers, be sure to use a vented cap so that air pressure does not build up in the well, potentially affecting water level. In materials of high hydraulic conductivity, measurements must be taken very rapidly. As a result, using a transducer may be a virtual necessity. Using a data- logger in this situation simplifies the test considerably. But if neither of these is available, it still may be possible to take the rapid measurements that are required by using the following method. This method requires two people to take measurements, a china marker (grease pencil), and a water level indicator. An electric cable water- level indicator with an audible signal such as a beeper or buzzer works best in this situation. When the test begins, one person uses a stopwatch and calls out "Read" at 5-second intervals. The other person uses the water-level indicator to find the depth to water. This person should not actually determine the depth, but should simply lower the probe to the water surface, then use the china marker to mark the position on the cable. The timer should indicate intervals of 30 seconds, and the cable marker should make a different mark (perhaps thicker, or doubled, or of a different color) to indicate the 30-second reading. As long as water level keeps changing rapidly, continue taking the measurements at 5-second intervals. Later, change to 10- or 30-second intervals. When the test is over, marks on the cable should be reviewed and translated into actual depth measurements. This method is not easy, and it requires advance practice. Decide When to End the Test. How long should the test continue? If a rising-head test will be conducted after the falling-head test, then wait until the water level has completely recovered before starting the rising-head test. Meanwhile, continue recording the time and water level until the water level has recovered at least 80% of the way. Depending on which analytical method will be used to process the data, the values between about 60% and 80% of recovery mayor may not be needed, but it will not hurt to have recorded them. If the well must be capped while the water level recovers, be sure to use a vented cap so that pressure conditions in the well are atmospheric. An example of a completed
  • 20. 20 slug test data form is given in (see above). Conduct a Rising-Head Test Prepare to Start the Rising-Head Test. Wait until the water level has fully recovered from the falling-head test. Just before starting the test, measure and record the water level and time. Begin the Rising-Head Test. Begin the test by instantaneously removing the slug from the well water. If using a solid slug, withdraw it quickly. Depending on the depth of the well, either pull it to the surface or simply leave it suspended in the well. In pulling it to the surface, there is a risk of bumping the transducer cable or tangling other downhole probes. If using a bailer, it might leak and empty itself if left suspended in the well; this will cause the water level in the well to rise too quickly and yield an erroneous test result. Weigh this risk against the risk of disturbing the transducer or other downhole probes. Begin measuring and recording the water level immediately after withdrawing the slug. The first object is to measure the lowest water level, which will occur within the first second after the slug is removed. Record both the measurement and the time of measurement, to the nearest fraction of a second, if possible. The next objective is to read and record the water level as it returns to normal, along with time of the measurements. Continue making measurements of water level and time, according to the appropriate schedule, as for the falling-head test. If the well must be capped before the test is complete, use a vented cap. In the rising-head test, this is particularly important if hydraulic conductivity in the tested formation is high and if the water level in the well is above the screened interval. When this is the case, the water level can rise quickly enough to compress the air in the casing, which can blow the cap off with explosive force. End the Test. Stop the test after 60% to 80% of the initial head has been recovered. Processing the Data Before the data can be analyzed, they must be processed to yield the appropriate values for analysis. The following steps for processing apply to both falling- and rising-head tests, but the data from each test should be processed separately. First, find 0H . 0H is the maximum level above (or below) the pretest level to which the water level rises (or falls) immediately after the slug is inserted (or removed). Find 0H by subtracting the depth to water before the test from the depth to water immediately after the slug is inserted or removed. The choice of 0H is somewhat arbitrary, but is critical to the success of the method. As the slug drops into the water, a great deal splashing and turbulence tends to occur. The result is that water levels in the first second or two may vary widely. When anything but a transducer and datalogger are used to make water- level measurements, the choice may be simple, because usually by the time the first measurement is made, the water has stopped splashing.
  • 21. 21 However, the choice of 0H is particularly confusing when a transducer and datalogger are used, because the datalogger may record a hundred or more readings in the first second of the test. How can one choose an Ho value from such an alarmingly large and widely diverging set of points? The answer is to use commonsense. Remember that the maximum change in water level (Ho) cannot exceed what is physically possible, given a slug of a certain volume in a well of a certain diameter-even though the transducer readings might indicate so. It is a good idea to calculate the highest water level that might possibly be reached, and not to select an 0H value which exceeds this. Knowing the volume of the slug, calculate the maximum change it could possibly have caused in the water level by using the following formula: Maximum possible change in water level = Volume of slug well radius) 2 Don't forget to use the radius of the well, not its diameter, and to convert all measurements to consistent units. Once the maximum possible change in water level is known, eliminate from consideration all data points that are greater than that value. Choose the recorded value that is closest to, but does not exceed, the maximum possible value. Why not just use the calculated value? The calculated value is a theoretical value that might not ever be achieved, because water instantaneously moves into or out of the well screen as the slug is inserted or withdrawn. Once the value of 0H has been chosen, make a table or use a computer spread- sheet program to record and process the water level and time data. If a depth-to- water indicator was used to measure water level, the columns should be as given in (See above figure (a)). If a transducer was used to measure water level, the transducer measurements will give the height of the water column above the transducer. In this case, Ho is the highest value recorded immediately after the slug is inserted (or the lowest value recorded immediately after it is removed) minus the height before the slug was inserted or withdrawn. The data table will look slightly different, too, as is shown in (See above figure (b)).
  • 22. 22 Analyzing the Data The analysis given here follows the Hvorslev (1951) method. This method is applicable in a wide variety of field settings, and graphing and calculations are relatively simple. The Hvorslev method only gives hydraulic conductivity of the formation, not transmissivity or storativity. Other methods of interpreting the data are available; see Freeze and Cherry (1979), ASTM Standards 4044 and 4104, Dawson and Istok (1991), Fetter (1994), or other texts for details. Graph the Data. Plot elapsed time versus head ratio (H/ 0H ) on a one-cycle semilogarithmic graph with the head ratio on the logarithmic axis and time on the arithmetic axis. Ignoring the first few data points, which are likely to be spurious, draw a straight line through the points (see left). Perform the Necessary Calculations. Read the value of 0T , the basic time lag, from the graph. 0T is the time at which the head ratio equals 0.37. To find it, find 0.37 on the scale of the head ratio, draw a horizontal line from this point to the line connecting the data points, and then drop a vertical line down to the time axis. Read the value; this is 0T . Calculate K. Calculate hydraulic conductivity (K) of the formation using the following formula. This formula applies only if the length of the well or piezometer casing is more than 8 times the radius of the screen (or L/R > 8): K= ( ) 0 2 2 1 LT RLnr where r = radius of the well or piezometer casing L = length of the saturated portion of the screen or filter pack (see what follows) R = radius of the screen or screen plus filter pack (see what follows) 0T = basic time lag, which is read from the graph, as described earlier K = hydraulic conductivity of the formation If the well or piezometer taps an aquitard, then R is the radius of the screen plus the filter pack (gravel pack), and L is the length of the filter pack (gravel pack). Interpret the Results. Check the results with a table of common values of hydraulic conductivity for the rock or sediment type. Check the results of the falling- and rising-head tests against each other. (Both types of test should be performed whenever possible.) They should give results that are fairly close to each other, so one can be used to check the other. However, occasionally the two tests will not
  • 23. 23 agree. This is most likely to occur in a well installed in an unconfined aquifer, with a screen that extends above the water table. During a falling-head test in such a well, water might leak out of the screen above the water table into the unsaturated zone. The test result will then give an erroneously high value for K. If this is suspected, the rising-head test should be considered more reliable. In both the falling- and rising-head tests, the line may be curved at either end. These portions should be ignored during curve fitting. Finally, recall that the volume of water entering or leaving the formation during the test is very small. If results seem too high or too low, it may be that only the sand or gravel pack surrounding the screen actually was tested, and not the formation itself. To determine if this is likely, use information from the boring log and well construction diagram, along with geological judgment and common sense. Pumping Tests What Is a Pumping Test? In a pumping test, water is pumped out of a well at a known rate over a period of several hours or days. As pumping is going on, water level is monitored in one or more observation wells some distance from the pumping well, and in the pumping well, too. There is a relationship between the test parameters (water levels during the test, pumping rate, time since pumping began, and distance between pumping and observation ,wells) and the aquifer parameters (transmissivity, T, and storativity, S). For best results, a pumping test should be followed by a recovery test, in which water level is monitored after the pump has been shut off. Data recorded during both phases of the test are used to calculate values of T and S. Pumping tests have both advantages and disadvantages when compared with slug tests. Because pumping tests involve extracting more water from the aquifer than do slug tests, they do a better job of estimating aquifer characteristics close to and at some distance from the well. Pumping tests can measure characteristics of large-scale heterogeneities and anisotropy. They give a more realistic estimate of how the aquifer and any confining layer actually respond to pumping. However, pumping tests take longer, require the use of a pump, may require the presence of an observation well in addition to the pumping (test) well, and are therefore considerably more expensive than slug tests. In addition, the problem of disposing of the pumped water must be addressed. Finally, pumping tests are less well-suited than slug tests for estimating the characteristics of aquitards. This section describes how to plan a pumping test, carry it out, and analyze the results. Pumping test field and analytical procedures are described in numerous other sources, among them Freeze and Cherry (1979), Kruseman and de Ridder (1990), Dawson and Istok (1991), Fetter (1994), Watson and Burnett (1995), and Domenico and Schwartz (1998). The ASTM has developed several standard methods pertaining to pumping tests. ASTM Standard Test Method D4050 gives the field procedures, while a few others describe analytical procedures.
  • 24. 24 Planning a Pumping Test Planning a pumping test begins with studying the geology of the site. Then, an analytical method is considered, an equipment list is put together, and the pumping and observation wells are designed and installed. Finally, the test parameters must be chosen, including pumping rate and length of the test. The steps are described in more detail in what follows. Study the Geology An understanding of subsurface geology is essential to planning a successful test. Answering the following questions will provide a good beginning. When the test is to be performed in an unexplored area, answers to these questions may not be known, in which case informed guesses should be made. These guesses should be based on the study of regional geology, by utilizing existing geologic maps and reports, field observations of outcrop patterns, and topography. What aquifers, partial aquifers, and aquitards are present, and what are their depths, orientations, and thicknesses? What is the degree and nature of heterogeneity of the geologic materials and/or formations in the area? What is the degree and nature of anisotropy of the geologic materials and/or formations in the area? What are the static water levels in the area? Consider water table and potentiometric surfaces. Where are the recharge areas for the aquifers? What is the general direction of ground water flow in each layer or formation? What surface-water bodies exist in the area? How are they likely to interact with ground water? Into what range are values of hydraulic conductivity (K) likely to fall? Consider aquifers as well as aquitards. To what extent will fracturing influence the test? Is fracture permeability the primary source of water? How important is it? What hydrologic boundaries are present? Consider both contributing boundaries (e.g., surface-water bodies, facies changes to higher-K formations, fracture permeability) and noncontributing boundaries (e.g., pinched-out formations, buried valley walls, facies changes to lower-K formations, or sealed fault zones). What other wells are present that might influence or be affected by the test? Nonpumping wells should be considered as possible observation wells. Pumping wells should be considered as possible interferences, and their pumping rates and times should be monitored. Likewise, pumping the test well might cause a drop in water level in a private well; potential effects should be estimated, and the owners should be consulted. Consider the Analytical Method Consider the methods that might be used to analyze the data. Choice of analytical method determines the number and placement of wells, frequency of measurement, and pumping pattern. A variety of analytical methods are described in Walton (1987), Kruseman and de Ridder (1990), and Dawson and Istok (1991). Four methods are described here: the Theis, Jacob time-drawdown, distance- drawdown, and step-drawdown methods. Considerations about these and a few other tests are described in what follows. Methods for Ideal Aquifers. The Theis, Jacob time-drawdown, distance-draw- down, and step- drawdown methods apply when the formation being tested fits ideal assumptions. These assumptions
  • 25. 25 are that the aquifer is isotropic and homogeneous, horizontal, fully confined, of constant thickness, and infinite in lateral extent; that it has no hydrologic boundaries and no interference from other pumping wells; that the well intake extends through the full saturated thickness of the aquifer; and that flow in the aquifer is laminar and horizontal. When a pumping test is performed in nonideal conditions, the test's results do not conform to the ideal curves. The ways in which they deviate should guide the choice of analytical method. As a result, it helps to plot the data as for ideal conditions, and then to evaluate the nature of the deviation from the ideal. Theis Method. The Theis method involves plotting a curve of time versus draw- down data and matching the curve to type curve of the Well Function. Advantages of the Theis method are that the method is simple and well-known, and that deviations from the ideal are easily seen on the Theis plot. One disadvantage is that at least one observation (nonpumping) well is required if a value of S is to be calculated. Another is that the method involves curve matching, which invites interpretive error, although several computer software packages are available to match the curves numerically and obtain an optimal solution. Jacob Time-Drawdown Method. The Jacob time-drawdown method involves plotting data on a graph of time versus drawdown and fitting a straight line to the points. This method assumes the same ideal conditions as does the Theis method. In addition, it applies only to data for which the Jacob approximation is valid, that is, for which the parameter u, as defined in what follows, is less than or equal to about 0.01 (Lee and Fetter, 1994). This condition generally occurs when pumping times are long. Advantages of the Jacob time-drawdown method are that the graphical technique is simpler than that of the Theis method, and that the effects of hydrologic boundaries may show clearly on the graph. In addition, the Jacob time-drawdown method may be used (0 interpret data from the pumping well, eliminating the need for an observation well. However, if no observation well is used, only transmissivity, and not storativity, can be determined. As with the Theis method, a disadvantage of the Jacob time-drawdown method is that it involves curve fitting, which invites interpretive error, although computer software for curve-matching may be used to obtain a statistically optimal solution. Distance-Drawdown Method. The distance-drawdown method involves plotting drawdown versus distance from the pumping well. To use this method, at least three observation wells are needed, at specific intervals of distance from the pumping well. An advantage of the distance-drawdown method is that only a few water-level measurements must be made. The major disadvantage is the need for several observation wells. In addition, this method involves curve fitting, which invites interpretive error, although as with the methods already described, some computer software packages may be used to minimize this error. Step-Drawdown Test. The step-drawdown test involves pumping at several successively higher rates and observing the effects on drawdown. It is used specifically to determine well yield and optimum pumping rate for a particular well. Often, a step-drawdown test is conducted as a trial test to select an
  • 26. 26 appropriate pumping rate for a subsequent pumping test. Calculating transmissivity and storativity from a step-drawdown test may be difficult or impossible. More information is included in the section titled "Determine the Pumping Rate," which follows. Methods for NonIdeal Aquifers. When data from a pumping test are plotted using standard methods, and are found not to match idealized curves, it is an indication that one or more of the assumptions of idealized methods do not apply. This most commonly occurs because the aquifer is semiconfined or unconfined, the aquifer is not laterally extensive, the well does not fully penetrate the aquifer, or there is interference during the test by another pumping well. Methods exist that offer ways to estimate the transmissivity and storativity of an aquifer even when ideal conditions are not met. Methods have been developed for semiconfined aquifers, with and without storage in the confining layer, as well as for unconfined aquifers. Some methods attempt to account for the effects of hydrologic boundaries or interference from other pumping wells. These methods should be considered when it becomes obvious that the data do not fit the type curve. Further information is available in Freeze and Cherry (1979), Walton (1987), Kruseman and de Ridder (1990), Dawson and Istok (1991), Fetter (1994), and Domenico and Schwartz (1998). Determine What Is Needed To Do the Test. No matter what analytical method will be used, in order to conduct any pumping test, a pumping well must be available. For most analytical methods, and especially if storativity is to be estimated, there also must be at least one observation well. A means of measuring water level in all wells is needed. Although it might initially seem like a good plan to use the same water-level indicator for both the pumping and observation wells, in practice this may be impossible because of the physical distance between them and the rapid measurements needed early in the test. A means of disposing of the pumped water is needed; in some situations, regulations may specify that it be contained for later disposal by an approved method. A means of measuring discharge rate from the pumped well is needed. And, finally, a timepiece or stopwatch, and a notebook and/or recording forms are needed. Design the Pumping Well If no well exists in the study area, design and install one based on the considerations discussed in what follows. If an existing well is to be used as the pumping well, determine if it is suitable for the pumping test. In many cases, the construction details and location of an existing well make it inappropriate for the test, and another well must be designed and installed. If no information is available on the existing well, the well should not be used. Installing a new well provides the hydrogeologist with good subsurface geological data. In addition, it has the benefit of allowing the hydrogeologist to design a well that will provide good-quality pumping test data. Diameter. Consider cost, the diameter of the pump, the discharge rate necessary to stress the aquifer and affect water levels in the observation wells, and what the well will be used for after the tests. Depth and Placement of Intake. Design the well such that the screened or open portion is open only to the aquifer that is to be tested. Ideally, it should fully penetrate the aquifer.
  • 27. 27 Location. Frequently, choice of location is limited. But within the constraints of the site, try to choose a location that maximizes easy access, minimizes interference from other pumping wells, and optimizes data-analysis options. Post-test Use of Well. If a well is to be abandoned after the test, it may be constructed of reusable materials. But if it is to be used for water supply or monitoring, the design may depend more on the final use than on its usefulness for the test. Design the Observation Wells If existing wells are to be used as observation wells, their construction details and locations must be reviewed. If new wells are to be installed for the purpose of the test, several factors must be considered, including well design, the number of wells, and locations. Observation Well Design. Diameter and construction depend on what the well is to be used for after the test. If it is to be used only for the test, and will be abandoned thereafter, it may be constructed of reusable materials and may be of relatively small diameter. The diameter only need be big enough to accommodate a water-level indicator, so a l- or 2-in. diameter might suffice. Depth of the observation well(s) should be determined by geology: The intake portion of the well must be open to the same aquifer as is the pumping well. However, the intake need not fully penetrate the aquifer, assuming ideal conditions are met (horizontal, laminar flow). If conditions are not ideal, the observation wells should be open to the same portion of the aquifer as is the pumping well. Number of Observation Wells. To characterize fully the hydraulic characteristics of a formation, several observation wells open to the aquifer are needed. In the case of a semiconfined aquifer, observation wells also should be installed in the overlying aquifer. However, cost is a major limiting factor in determining the number of observation wells. In some cases, the value of information gained from installing a well does not justify the expense. No Observation Wells. A pumping test can be run with no observation wells. However, it will yield a limited amount of information. With no observation well, water levels must be measured in the pumping well, and turbulence within the well will affect quality of the data. Because of this, the recovery test becomes even more important. Neither storativity nor radius of pumping influence can be determined from a test with no observation wells. If the budget for the test is so limited that no observation wells can be installed, it may be more useful or cost- effective to abandon plans for a pumping test, install a few small-diameter wells, and use slug tests to estimate hydraulic conductivity. One Observation Well. Use of one observation well may yield acceptable results in ideal conditions. However, if aquifer conditions are heterogeneous, a test with one observation well will be limited in its value, because conditions near the well may not represent conditions elsewhere in the aquifer. In addition, the distance- drawdown method cannot be used to interpret data from such a test, because three or more observation wells are needed to perform that analysis.
  • 28. 28 Two or More Observation Wells. Two or more wells should be used if conditions are laterally heterogenous and an assessment of the degree of heterogeneity is required. In this case, the wells ideally should be situated such that they are the same distance from the pumping well, but in positions where they will reveal the different conductivities (see right). If conditions are laterally homogeneous, wells should be situated at different distances from the pumping well. For maximum benefit, their distances from the pumping well should be in different orders of magnitude (e.g., 10, 100, 1000 meters). The distance- drawdown method then will provide more precise and accurate information. A minimum of three wells is required for this analysis. Obviously, a limit exists beyond which a well will not provide useful information because it will not be affected by pumping. This "radius of influence" can be estimated before the test by using the equations for the distance-drawdown method. Locations of Observation Wells. The wells must be close enough to the pumping well to register easily measured changes in water level within the first few hours of the test. (If the water level drops only a tiny amount throughout the entire duration of the test, then measurements are not likely to be precise enough to yield good results.) Observation wells must be appropriately placed to generate the curved portion on a Theis plot. The farther they are from the pumping well, the greater the portion of the aquifer that they test, but the longer in duration- and more expensive-the test must be. Of course, the observation wells must fall within the radius of influence of pumping. In addition, location of the observation well often is constrained by practical considerations such as property boundaries and drilling rig accessibility. If multiple observation wells are used, they should conform to the spacing considerations described under the earlier "Number of Observation Wells." With these competing demands, how can optimum distance of observation wells be determined? For
  • 29. 29 some tests, it may be possible to estimate the optimum distance for a single-observation well. For this estimate to be most successful, the hydraulic conductivity of the aquifer must be already fairly well- established, and the pumping rate should be known. Optimum pumping rate should be established by performing a step-drawdown test, described later in this chapter. If hydraulic conductivity and the pumping rate are known, to estimate the optimum distance to an observation well, follow these steps. 1. Multiply the hydraulic conductivity of the aquifer by the aquifer thickness (if the well intake fully penetrates the aquifer) or by the intake length (if it does not). This yields an estimate of transmissivity (T). 2. Estimate the order of magnitude of the storativity (S). Aquifer storativity ranges from about 10-7 to 10-1 . If the aquifer is perfectly confined, then as a preliminary estimate, use S = 10-5 . (This estimate will help during the design phase. But remember, one of the reasons for doing the pumping test is to determine the actual value of S, so the estimate is just a preliminary approximation, and very well may be proven to be inaccurate after the test.) If the aquifer is "leaky" (semiconfined), use S = 10-3 . If it is unconfined, use S =10-1 (or estimate a range of values for specific yield, Sy from a table of common values such as Table 6.2, and use S = Sy). 3. Assume that drawdown (h0 - h) in the observation wells should be at least 1 to 3 meters after about 12 hours of pumping. If it were any less than this, it would be difficult to measure the small changes in water level. This time period is the variable t in the equation in Step 5, which follows. 4. Now, use the Theis equation and the values estimated in Steps 1 to 3 to calculate values of the well function, W(u), for the various pumping rates: W(u)= ( )04 h h T Q π − 5. Use Appendix 3 to find corresponding values of u for the W(u) values calculated in Step 4. 6. Use the following equation to calculate distances to the observation wells (r) for the values of u found in Step 5. R2 = 4Tut S 7. Now compare these r values with the field situation. What is practical, given the constraints of the site? Property lines, obstructions, buildings, and locations of existing wells all will influence the final decision. Sample Calculation of the Optimum Distance to the Observation Well. A 24- hour-long pumping test is to be conducted in a well that is screened through the full thickness of a 20-m thick fully confined aquifer. The aquifer is composed of well-sorted medium sand, which from previous studies has been shown to have a hydraulic conductivity of 10-2 cm/sec. Water is to be pumped from the well by a submersible pump at the rate of 100 gpm. Because the aquifer is fully confined, a preliminary estimate of storativity is 10-5. The results of the test, of course, will yield a more accurate estimation.
  • 30. 30 A drawdown of 2 meters after 12 hours of pumping is desired. What is the optimum distance from the pumping well to the observation well? To solve this problem, first, the value of transmissivity (T) is calculated, where b is the saturated thickness of the aquifer: 2 2 10 20 100 20 sec sec cm cm cm T Kb X mX m − = = = Then the value of the well function W(u) is calculated: W(u) = ( )04 h h T Q π − = ( )( ) 2 2 3 2 2 20 60sec 264 4 2 sec min 100 100 min cm gal m m m cm gal π                   = 8 When W(u) = 8.0, the value of u is about 2 x 10⁻⁴ . Substituting this value into the equation for the radius, 2 4Tut r S = = ( ) ( ) 2 2 4 2 2 2 5 20 3600sec 1 4 2 10 12 sec 100 6912 10 cm m x hr hr cm m − −      Χ          = Therefore, r = 83 meters. Ideally, then, the observation well should be located about 80 m from the pumping well. In practicality, however, the site boundaries, the lateral extent of the aquifer, and access for the drilling rig all must be considered before the location of the observation well can be finalized. Determine the Length of the Test For a confined aquifer, the typical duration of a test would include a pumping phase 12-24 hours long, and a recovery phase which runs as long as the pumping phase. For an unconfined aquifer, a typical test may run 3-7 days in the pumping phase and the same duration in the recovery phase. Longer durations might be needed, e.g., if the test is intended to reveal the effects of a distant hydrogeologic boundary. In any case, each phase of the test ideally should be continued until equilibrium is reached.
  • 31. 31 In planning the test, consider the data-interpretation method. Note that when drawdown values are plotted versus time on a logarithmic axis, points plotted after about 8 hours into the test are very close together (see beloww). Thus, if a test must be terminated early, it makes more sense to do so at the end of a work shift of 8 hours than at the end of two work shifts, or 16 hours. If terminated at the end of 16 hours, the final 8 hours of the test very likely will have yielded little additional useful information. Consider the personnel who are to be onsite during the test. The greatest number of measurements are needed at the beginning of the pumping phase and again at the beginning of the recovery phase, so the greatest number of workers will be needed at these times. They will be needed to make simultaneous measurements at several different wells. Finally, consider that longer tests give more information about hydrogeologic boundaries and secondary permeability than do shorter tests. Thus, the length of the test must take into account the objectives of the test. Choose a Pump The pump used for the pumping test must meet several criteria. Its intake must fit in the well, so diameter is critical. Consider what else will be downhole during the test, including the water-level indicator.
  • 32. 32 The equipment must provide the needed "lift." How far down is the water level? How far below that will the pump intake be positioned? The pump also must deliver the required pumping rate (which is discussed in what follows). Pumps generally are designed with a specific purpose in mind, for example, sampling, purging, well development, or water supply. Their capacity depends on their design, the lift, the head of water above the intake, and the diameter, among other things. The pump's manufacturer can supply the needed information on pump capacity. Keep in mind that no vacuum pump will be able to lift water more than about 25 feet. Ideally, the pump should deliver discharge at a steady rate. As a result, suction pumps, positive- displacement pumps, and submersible pumps may be suitable, but bladder pumps may not be. Bladder pumps operate by alternately filling, then discharging water from a bladder. The time between the fill and discharge cycles may be as long as several minutes. As a result, the discharge is not steady. Data from the recovery phase of the test will be more reliable than data from the pumping phase in such a situation. The power source for the pump must be considered. Some pumps run off of a car or truck battery, but this is not likely to be a reliable source for a long pumping test. Others must be plugged into a household-voltage circuit. Is a power supply reliable and readily available? Will it remain so throughout the duration of the test? If not, a generator may be used; be sure to have plenty of fuel on hand to power the generator. Some pumps are gasoline or diesel-fueled. Ensure that supplies are ample. In some cases, and if a low level of sophistication and precision is acceptable, a pump may not be required at all. In these cases, the well must be able to be bailed by hand quickly enough to yield the required discharge. This is most practical if the wells are shallow and if the aquifer is of low conductivity. In deep wells, the time required to haul the bailer out of the well, empty it, and then lower it again is too long. If bailing is used, each time water-level measurements are made, they should be made at the same point in the bailing cycle. Bailing must be done at a constant rate throughout the test. It helps to have several field personnel performing this task, so that some may rest while another bails. Volume of water and time must be measured constantly throughout this type of test, as the bailer may collect different volumes of water each time. Obviously, bailing is not practical for tests more than a few hours long or for tests of very deep wells. Care must be taken during bailing tests that the cable for the water-level indicator is not disturbed as the bailer is raised and lowered. This type of test will yield very crude data, at best. Determine the Pumping Rate To choose the pumping rate, consider what the pump can handle as well as what rate will give the desired drawdown. As just indicated, the maximum capacity of the pump is determined by its design, size, the lift required, and the head of water above the pump's intake. Do not design the test such that the pump must run at its maximum capacity from the beginning of the test. The reason for this is simple: The yield of the pump will decline throughout the test, as the water level in the well drops. If the pump is already running at maximum capacity, its performance cannot be improved to increase the
  • 33. 33 yield to its initial level. How far below the water level will the pump intake be positioned? It must be far enough below the water level so that the pump won't run dry. In addition, if a pressure transducer is used, the pump intake should be separated from the transducer by a few feet to minimize turbulent interference. What head of water will be above the pump intake? As the test goes on, this will decrease, which may decrease the yield. Consider what the well is capable of yielding. Pumping at 200 gallons per minute (gpm) will immediately dry out a well that is only capable of producing 2 gpm. Estimate the transmissivity (T) of the aquifer; do this by estimating the hydraulic conductivity (K) and multiplying by the aquifer thickness. If the aquifer is much thicker than the portion penetrated by the well, then instead of thickness, use the length of the well intake. Also estimate storativity (S), as described in Step 2 under "Locations of Observation Wells." With the estimates of T and S, and with an estimate of the distance between pumping and observation wells, use the Theis equation to estimate the pumping rate that would yield an easily measured draw down in the observation well at some time (t) after pumping begins. Also consider how much water must be pumped out of the well before the Theis age solution begins to be applicable. It is not enough to simply empty out the water that is standing in the well; new water must be drawn into the well and pumped out during the test. Calculate the volume of water standing in the well as volume = 2 rπ x (height of water column), and then ensure that the pumping rate is sufficient to pump out all of this water and more during the first portion of the test. Finally, it might be wise and ultimately cost-effective to conduct a pilot test to determine the optimum pumping rate. Do this by performing a step-drawdown test: guidelines for doing this are described under "Pretest," which follows. Determine How to Measure Discharge Measurements of discharge should be made at various time intervals throughout the test. At the beginning of the test, they should be made frequently; once flow stabilizes, they may be made less often. In the case of a bailing test, they must be made continuously. Therefore, a reliable method for measuring discharge must be employed. The bucket-and-timer method works well if flow is relatively low (up to about 10 gpm, if using a 5- gallon bucket). A flow meter may be used by installing it in the discharge line; ensure that the expected discharge falls within the operating range of the meter. Orifice weirs may be used, but care should be taken that the discharging water is contained if necessary or routed away from the pumping well. For more information, see the section on measuring discharge from wells in Chapter 4, "Soil Water and Ground Water.
  • 34. 34 Disposing of Pumped Water Water pumped out of the well during the test must not be permitted to recharge the pumped aquifer. This is of particular concern for unconfined aquifers. However, it is not necessarily an issue for certain confined aquifers, especially if there is no chance that water discharged onto the surface will change hydraulic head within the confined aquifer. Convey the discharged water away from the site through pipes or hoses. Be sure that the piping system is capable of carrying water at the proposed pumping rate. In some areas, it may be necessary to check beforehand to determine if any permits are required before releasing water into a stream or drainage way. At some sites, particularly if the water is known to be contaminated, it may be necessary to contain the pumped water. If this is the case, depending on the pumping rate and duration of the test, it may be possible to contain the water in several 55-gallon drums. Alternatively, tank trucks may be used to haul the water away for appropriate disposal. Depending on test design, if tankers are used, it still may be necessary to temporarily contain the water in stock tanks or drums. In addition, consider having a backup truck on hand so that there is no delay in the test if one should fill up; consider the pumping rate and the truck's capacity to determine if this is necessary. Depending on the water chemistry and the volume that is to be pumped, in some situations, it may be advantageous to obtain a permit to discharge the water to a local sewer or waterway. This might require obtaining a National Pollutant Discharge Elimination System (NPDES) permit. The appropriate environmental agency should be consulted for more information. Determine How to Measure Water Levels How often should measurements be taken? The early portion of the time- drawdown curve is critical in curve matching. As a result, it is important to make frequent measurements at the beginning of the pumping phase of the test, and then again at the beginning of the recovery phase. As the test proceeds, measurements may be made less frequently. Kruseman and de Ridder (1990) suggested the following schedule of measurements: In addition, consider that the analytical method influences the frequency of measurements needed. If the data will be analyzed by the distance-drawdown method, for example, only a few measurements are necessary, and these may be taken quite some time after pumping begins. For a step-drawdown test, a rapid series of measurements should be taken every time the pumping rate increases, but frequency may decline thereafter. Use a water-level indicator to make the measurements. These were described previously. Considerations for choosing instruments appropriate for a pumping test are discussed here.
  • 35. 35 Measurements in the pumping well must be taken quickly, especially at the beginning of the test, because water level changes rapidly. Electric cable water- level indicators or pressure transducers are well suited to this task. However, a chalk line or steel tape may be difficult to use with much accuracy, because making one measurement typically takes more than a minute. In addition, turbulence in the well caused by the pump will degrade the quality of these measurements. Noise from the pump may render a popper useless. Measurements in the observation well(s) involve different considerations. Can the same water-level indicator be used in the pumping well and observation well(s)? How close together are the wells? How easy is it to carry the instrument between them? Is it physically possible to make measurements in all wells with the same device, given that some measurements must be made simultaneously in all the wells? Some data loggers can accommodate several transducer inputs. If these will be used, is the transducer cable long enough to run between the wells and down the holes? For further reading on planning the field aspects of a pumping test, consult Walton (1987), Kruseman and de Ridder (1990), or Dawson and Istok (1991). Performing the Test Once the test and observation wells have been drilled, constructed, and developed, consider the record- keeping system. Determine who will keep the records during the test. Use standard forms (an example appears in below) or set up tables in a field notebook before the test. Several columns will be needed, with these headings as a minimum: Pumping Well: Time, depth to water (or transducer reading), pumping rate, comments. Observation Well: Time, depth to water (or transducer reading), comments. Don't forget to include units of measurement in each column where appropriate. The test should be conducted in several stages. Some hydrogeologists conduct a step-drawdown test before every pumping test. This pretest provides the information needed to determine the equipment, personnel, and time that will be required for the actual pumping test. This practice can save money and time and yield better results. The pumping test itself consists of two stages: Stage 1, Pumping; and Stage 2, Recovery. The pumping stage involves pumping the well and recording the time and water level in the pumping and observation well(s). The recovery stage simply involves recording the water level
  • 36. 36 in the pumping and observation well(s). This section gives the step by step method for performing the complete test. Pretest: Step-Drawdown Test A step-drawdown test (or "step test") is conducted for the purpose of determining the optimum pumping rate for a well. This type of test may be conducted before a standard pumping test, or it may be conducted in any production well when data on optimum pumping rates are needed. A step-drawdown test is performed by pumping at several successively higher rates and observing the effects on drawdown. To do this, follow the field procedures for Stage 1 of a standard pumping test, as described in what follows. However, in a step-drawdown test, the pumping rate is varied stepwise through the test. This is done by beginning the test at a low pumping rate. Pumping at this rate continues for a period of 1-2 hours, or until drawdown has stabilized to some degree. Then, pumping rate is increased, and pumping at the new rate continues for the same length of time. Then, the pumping rate is increased again, ideally by the same factor as it was increased in the previous step. The test continues in this fashion for several "steps," or pumping rates. Walton (1987) suggested at least three steps, whereas Driscoll (1986) suggested five to eight steps. To analyze the data, begin by plotting drawdown versus time on an arithmetic graph with, time on the horizontal axis and drawdown on the vertical axis; (see figure above. 5.9 (a)). In addition, plot discharge versus drawdown on an arithmetic graph, with drawdown on the horizontal axis and discharge on the vertical axis; (see figure above (b)). This second plot shows specific capacity, which is the well's yield per unit drawdown. On both graphs, connect the points with a smooth curve. Conduct the pumping test at a pumping rate chosen from the straight (early) portion of the specific- capacity curve. The point at which the specific-capacity curve flattens out is the maximum safe yield. It is not wise to operate the well at the maximum safe yield.
  • 37. 37 Stage 1: Pumping Measure and record water levels in all wells. Ensure that nearby wells will not be pumping during the test. Any wells in the expected zone of pumping influence of the test well should be shut down for the duration of the test. Set up equipment. Pump and power supply. Note that installing the pump raises the water level. Allow it to return to original before the test begins. Water-level measuring devices. If using transducers, allow enough time after installing the probes in the wells for the water level to return to the original before the test begins. Discharge-measuring system. Discharge-disposal system. Check with all field personnel to ensure that all duties, including record keeping, are clearly understood. Rehearse if necessary. Synchronize watches. Determine which watch will be considered official time, and which will be backup. Check and record time and water levels in all wells. Start the pump and begin making measurements. The first several measurements must be made rapidly, so it is essential that field personnel know their jobs and be prepared to perform them immediately. In addition, the use of automatic recorders is strongly recommended for any wells near the pumping well, so there is no delay in taking measurements. Throughout Stage I (Pumping), monitor pump operation, discharge, and water levels. Try to anticipate problems before they occur. Stage 2: Recovery Near the end of Stage 1 (Pumping), prepare for Stage 2 (Recovery). Once again, measurements will have to be made rapidly at the beginning of the recovery period, so several workers should be on hand and well-rehearsed. Before shutting down the pump, once again review duties. If any of the observation wells are remote from the pumping well, and if a field worker is at that well and will begin making measurements there once the pump is shut off, ensure that the worker is aware of the timing of the shut off. Walkie- talkies may be useful for this, or hand or light signals. Make and record a final discharge measurement and a final water-level measurement in all wells; these values are important because they will be used in analyzing the results. Then shut off the pump. Begin taking water-level measurements on the same schedule as the original measurements in Stage 1 (Pumping).While recording the data, use the same column headings as during the pumping portion, except that no column is needed for discharge.
  • 38. 38 After it is stopped, the pump should be left in the well, as pulling it out will change water level in the well, and the time it takes to haul it out may interfere with the valuable early time measurements. In addition, pulling it out is likely to disturb the transducer, if one is being used. One problem with leaving the pump in the well is that water in the discharge line may drain back into the well. This should be avoided, because it changes the water level in the well. If necessary, a check valve may be installed near the bottom of the discharge line to prevent this from occurring. This must be done before the test begins. Stop the test after the requisite time has elapsed. Processing the Data The field data must be processed to put them in a form that is useful for the analysis. Prepare to do this by constructing a table or computer spreadsheet with headings as shown in the figure below. Convert the time data to "Elapsed Time" data. These values should give the elapsed time after pumping began, for Stage 1 (Pumping), and the elapsed time after pumping ended, for Stage 2 (Recovery) data. Use units such as seconds or minutes. Any time unit may be used, as long as it is used consistently. Convert the water-level measurements to drawdown measurements. Use units such as feet or meters, and be consistent. This conversion is done slightly differently for pumping data than for recovery data, as described in what follows. For Stage 1 (Pumping), if depth-to-water measurements (e.g., depth from the top of casing to the water level) were taken, find drawdown by subtracting depth to water before pumping from depth to water during pumping.
  • 39. 39 If a transducer was used, calculate drawdown by subtracting height of water during pumping from height of water before pumping (see right). Some transducers or data loggers can be set to do this during the test, so that later conversion is not necessary, and this significantly simplifies the work. For Stage 2 (Recovery) measurements, the quantity plotted is not drawdown, but recovery. Recovery is the distance that the water level rises after the pump is shut off. If depth-to-water measurements were taken, then calculate recovery as the depth to water before the pump was shut off minus the depth to water after the pump was shut off. If a transducer was used, then calculate recovery as the height of water above the transducer after the pump was shut off minus the height of water above the transducer before the pump was shut off (see right). Analyzing the Data Detailed discussions of data analysis may be found in several texts (e.g. Freeze and Cherry, 1979; Driscoll, 1986; Walton, 1987; Kruseman & Ridder, 1990; Dawson and Istok, 1991; and Fetter, 1994). As a first approach, however, make Theis and Jacob time-drawdown plots. If conditions are ideal, these plots will allow easy data analysis. If conditions deviate from the ideal, these plots will indicate the degree and nature of the deviation. Theis Method A Theis plot may be constructed if at least one observation well was used. First, a type curve (or reverse-type curve) must be obtained. A reverse-type curve printed on acetate may be purchased from the National Ground Water Association. One may be photo-enlarged from the figure to the right; however, doing so will distort the axes somewhat. A computer- generated plot may be
  • 40. 40 created by plotting values of W(u) vs. l/u; however, printing the graph may distort the axes (depending on the soft- ware used). This problem sometimes may be solved by using the same software to plot both type curves and data curves. However, even so, it is important to check the plots to ensure that the axes match. It may be simplest to construct a hand- drawn curve. Although it is tedious, once this is done, it need never be done again (unless differently scaled graph paper is used). To construct a hand-drawn curve, use a table of values of W(u) and u, such as found in Appendix 3. Calculate l/u for each value of u. Plot W(u) vs. l/u on 3 x 5-cycle log-log graph paper, with W(u) on the y axis (three log cycles), and l/u on the x axis (five log cycles). Several sheets may be cut and pasted together to cover the entire table of values. However, it is possible to fit the most critical I. portions of the curve on one sheet by plotting only those values for u = 10-4 to 101 (1/u = 10-1 to 104 ) and W(u) = 10-2 to 101 . Connect the points with a smooth curve, and darken it by going over it in black ink. Make a dot at the point W(u) = 1, 1/u = 1 (this will be a convenient choice for a match point later on). Once the reverse-type curve is available, set it aside. Use a clean sheet of 3 x 5-cycle log-log paper to plot field data curves. If only one observation well was used, plot drawdown on the y axis (three cycles) vs. time on the x axis (five cycles) (see below). If more than one observation well was used, and conditions are laterally homogeneous, calculate time/(radius)2 for all wells. Then plot the draw- down on the y axis vs. time/(radius)2 on the x axis. If the points do not fall along a fairly smooth curve with the same general shape as the reverse-type curve, the assumption of lateral homogeneity is likely to be false. However, given the natural variation in geologic data and in measurements of this nature, some deviation from assumed conditions may always be expected. This does not necessarily invalidate the test results. If more than one observation well was used, and conditions may not be assumed to be laterally homogeneous, then plot drawdown on the y axis and either time or time/(radius)2 on the x axis. It does not matter which quantity is chosen for the x axis, as long as it is clearly labeled, but using time/(radius)2 and plotting the data from each well as a separate line may show the nature of the heterogeneities. Plot a curve (or curves) for the pumping stage and a curve (or curves) for the recovery stage.