SlideShare a Scribd company logo
1 of 8
Download to read offline
UK Labour Market	 9th
January 2015
The most up-to-date source of monthly UK labour market data and analysis
Report on Jobs
1998 1999 2000 2001 2002 2003 2004 2005 2006 2007 2008 2009 2010 2011 2012 2013 2014
25
30
35
40
45
50
55
60
65
70
75
Temp/Contract	Billings
Permanent	Placements
Increasing rate of decline
Increasing rate of growth
50 = no change on previous month
Staff Appointments via Recruitment Consultancies
Permanent and temporary appointments
rise at faster rates in December
Commenting on the latest survey results, Bernard Brown, Partner and Head of
Business Services at KPMG, said:
“A strong year for the UK jobs market finished with a flourish as temporary roles
saw an upswing in popularity. More than 1 in 3 recruiters suggest that employees
looking for short-term roles are being increasingly spoilt for choice as organisations
search for help in an effort to fulfil customer orders.
“Good news for candidates also extends into the pay packet. Once again, a
shortage of skills in key areas has led to a rise in the starting salaries on offer. It
could mean that 2015 becomes the year in which the candidate finally becomes
king.”
Markit
Henley on Thames
Oxon RG9 1HG, UK
Tel: +44 1491 461000
Fax: +44 1491 461001
email: economics@markit.com
Copies of the report are available
on annual subscription from
Markit. For subscription details
please contact:
economics@markit.com
The Report on Jobs is a monthly
publication produced by Markit and
sponsored by the Recruitment and
Employment Confederation and KPMG
LLP.
The report features original survey
data which provide the most up-to-
date monthly picture of recruitment,
employment, staff availability and
employee earnings trends available.
1	Executive summary
2	Appointments
3	Vacancies
4	Sectoral demand
5	Staff availability
6	Pay pressures
7	Special feature
Key points from the December survey:
Stronger growth of permanent placements
Temp billings increase at sharpest rate in three months
Strong pay growth underpinned by tight candidate availability



Report on Jobs | Recruitment Industry Survey
The Report on Jobs is unique in providing the most
comprehensive guide to the UK labour market,
drawing on original survey data provided by
recruitment consultancies and employers to provide
the first indication each month of labour market
trends.
The main findings for December are:
Permanent placements rise at
faster rate...
Recruitment consultants signalled a further increase in
permanent staff appointments during December. The rate of
expansion was strong, having picked up from November’s
18-month low. However, the number of job vacancies available
to people seeking permanent roles rose at the slowest pace
since July 2013.
...while temp billings growth also
accelerates
Short-term staff appointments increased at a sharper rate in
December. The latest rise in temp billings was the strongest in
three months.
Pay growth remains marked
Average starting salaries awarded to people placed in
permanent jobs continued to rise, with the rate of growth little-
changed from the strong pace recorded in November. Temp
pay meanwhile increased at the sharpest rate in three months.
Candidate availability remains tight
The availability of staff to fill permanent job roles continued
to fall in December. Although easing to the slowest in eight
months, the rate of deterioration remained marked. Temp
availability decreased sharply, with the latest reduction faster
than that recorded in November.
1 Executive summary
1998 1999 2000 2001 2002 2003 2004 2005 2006 2007 2008 2009 2010 2011 2012 2013 2014
25
30
35
40
45
50
55
60
65
70
Staff Appointments
Temp/Contract	Billings
Permanent	Placements
25
30
35
40
45
50
55
60
65
70
50	=	no	change	on	previous	month 50=no	change	on	previous	month
1998 1999 2000 2001 2002 2003 2004 2005 2006 2007 2008 2009 2010 2011 2012 2013 2014
35
40
45
50
55
60
65
70
Staff Availability and Earnings Growth
Skill	shortages
Average	permanent	salaries	(LHS)
90
80
70
60
50
40
30
50	=	no	change	on	previous	month 50	=	no	change	on	previous	month	(inverted)
inverted	-	RHS)
(Availability	of	staff
1998 1999 2000 2001 2002 2003 2004 2005 2006 2007 2008 2009 2010 2011 2012 2013 2014
Temp/Contract	Vacancies
Permanent	Vacancies
50	=	no	change	on	previous	month
25
30
35
40
45
50
55
60
65
70
75 Increasing rate of growth
Increasing rate of decline
Demand for staff
All Intellectual Property Rights owned by Markit Economics Limited
Report on Jobs | Recruitment Industry Survey
Recruitment consultancies report on the number of
people placed in permanent jobs each month, and
their revenues (billings) received from placing people
in temporary or contract positions at employers.
Latest recruitment survey data highlighted faster growth of staff
appointments during the final month of 2014.
Growth of permanent placements
accelerates
The number of people placed in permanent jobs by
recruitment consultancies continued to rise in December.
After accounting for the usual seasonal factors, the latest
index reading signalled that the rate of expansion quickened
from November’s 18-month low and was marked overall.
Panel members commented that general demand conditions
remained strong, although there were difficulties in finding
suitable candidates for certain skill-sets.
The fastest growth of permanent staff appointments was
indicated in the South of England, while the slowest rise was
signalled in the North.
Temp billings rise at fastest rate in
three months
Agencies’ billings from the employment of temporary/contract
staff increased further in December. The pace of growth was
strong, having quickened to a three-month high. Around 35%
of panellists signalled higher temp billings, more than twice the
proportion that noted a decline. Rising client workloads were
reported as the main factor supporting growth of short-term
staff appointments.
In contrast to the trend seen for permanent placements, the
strongest growth of temp billings was signalled by Northern-
based agencies, while the South posted the slowest expansion.
An index reading above 50 signals a higher number of
placements/billings than the previous month. Readings below
50 signal a decline compared with the previous month.
2 Staff appointments
1998 1999 2000 2001 2002 2003 2004 2005 2006 2007 2008 2009 2010 2011 2012 2013 2014
25
30
35
40
45
50
55
60
65
70
75
Temp/Contract	Billings
Permanent	Placements
Increasing rate of decline
Increasing rate of growth
50 = no change on previous month
Staff Appointments via Recruitment Consultancies
2014	Jul	 48.4	 38.3	 13.3	 35.1	 67.5	 64.9
	 Aug	 41.1	 33.9	 25.0	 16.2	 58.1	 62.4
	 Sep	 45.2	 34.3	 20.5	 24.7	 62.4	 60.1
	 Oct	 44.4	 30.1	 25.4	 19.0	 59.5	 59.8
	 Nov	 33.1	 38.5	 28.4	 4.7	 52.4	 56.9
	 Dec	 31.7	 37.2	 31.1	 0.6	 50.3	 59.0
	 	 Higher	 Same	 Lower	 Net	 Index	 S.Adj.	
	           	 %	 %	 %	 +/-	 50 = no chg	 Index
Permanent Staff Placements
Q. Please compare the number of staff placed in permanent
positions with the number one month ago.
2014	Jul	 48.0	 37.5	 14.5	 33.6	 66.8	 63.0
	 Aug	 40.8	 38.2	 21.0	 19.7	 59.9	 61.0
	 Sep	 47.1	 38.3	 14.6	 32.5	 66.2	 62.4
	 Oct	 34.1	 44.7	 21.2	 12.9	 56.5	 57.5
	 Nov	 38.7	 42.3	 19.0	 19.7	 59.8	 59.5
	 Dec	 34.5	 48.8	 16.8	 17.7	 58.8	 60.1
	 	 Higher	 Same	 Lower	 Net	 Index	 S.Adj.	
	           	 %	 %	 %	 +/-	 50 = no chg	 Index
Temporary/Contract Staff Billings
Q. Please compare your billings received from the
employment of temporary and contract staff with the
situation one month ago.
Report on Jobs | Recruitment Industry Survey
3 Vacancies
All Intellectual Property Rights owned by Markit Economics Limited
Recruitment consultants are asked to specify
whether the demand for staff from employers has
changed on the previous month, thereby providing
an indicator of the number of job vacancies. The
summary indexes shown in this page are derived
from the detailed sector data shown on page 5.
Growth of demand for staff eases
further
The Report on Jobs Vacancy Index fell to a 17-month low in
December. Recording 62.5, down from 64.0 in November,
the Report on Jobs Vacancy Index nevertheless remained
indicative of a strong rate of expansion overall.
Growth of demand eased for permanent staff in the latest
survey period, but accelerated for temporary workers.
Public & private sector vacancies
Private sector demand for staff remained substantially stronger
than that from the public sector in December. Private sector
permanent staff posted the fastest increase overall.
Other vacancy indicators
Latest official data from the Office for National Statistics (ONS)
indicated that vacancies rose 22.1% on an annual basis in the
three months to November.
Meanwhile, internet-based recruitment spending continued
to increase at a strong annual pace. Latest data showed a
8.8% rise in Q2 2014 from the corresponding period one year
earlier.
The Job Vacancies Index monitors the overall demand for
staff at recruitment consultancies. An index reading above
50 signals a higher number of vacancies than the previous
month. Readings below 50 signal a decline compared with the
previous month.
19981999200020012002200320042005200620072008200920102011201220132014
Temp/Contract	Vacancies
Permanent	Vacancies
50	=	no	change	on	previous	month
25
30
35
40
45
50
55
60
65
70
75
Increasing rate of growth
Increasing rate of decline
25
30
35
40
45
50
55
60
65
70
75
Job Vacancies
50	=		no	change	on	previous	month
Vacancy	Index
Increasing rate of growth
Increasing rate of decline
Job Vacancy Indicators
	 	 	 Aug’14	 Sep	 Oct	 Nov	 Dec	
Job Vacancy Index (recruitment industry survey)
50 = no change on previous month	 			 	
Other key vacancy data
Annual % change
Sources: 	Job centre vacancies provided by ONS via EcoWin.
Internet recruitment spending provided by WARC.com
Total			 68.0	 67.1	 65.7	 64.0	 62.5
Permanent Staff	 68.0	 67.1	 65.8	 64.2	 62.5
Temporary Staff	 68.5	 66.8	 64.9	 61.8	 62.3
Public: perm		 54.1	 58.0	 57.0	 54.5	 51.9
Public: temp		 58.9	 57.9	 56.6	 56.9	 54.5
Private: perm		 70.8	 69.0	 68.4	 67.1	 65.3
Private: temp		 72.6	 71.2	 65.7	 65.1	 64.3
Job centre vacancies	 26.8	 24.8	 25.0	 22.1	 n/a	
Internet recruitment	 8.8	 --	 --	 --	 --	
Public & private sector vacancies (not seasonally adjusted)
Report on Jobs | Recruitment Industry Survey
Recruitment consultancies are requested to compare
the demand for staff according to sector with the
situation one month ago.
Permanent Staff
Accounting/Financial topped the demand for staff ‘league
table’ in December, ahead of IT & Computing and Secretarial/
Clerical. The slowest rise in demand was signalled for
Construction workers.
4 Demand for staff by sector
50	=		no	change	on	previous	month
Demand for staff
20
30
40
50
60
70
80
90 Secretarial & Clerical
Perm
Tem p
2002 2004 2006 2008 2010 2012 2014
20
30
40
50
60
70
80
90 Accounting & Financial
Tem p
Perm
2002 2004 2006 2008 2010 2012 2014
2002 2004 2006 2008 2010 2012 2014
20
30
40
50
60
70
80
90 Executive & Professional
Perm
Tem p
2002 2004 2006 2008 2010 2012 2014
20
30
40
50
60
70
80
90 IT & Computing
Tem p
Perm
20
30
40
50
60
70
80
90
2002 2004 2006 2008 2010 2012 2014
Tem p
Blue Collar
Perm
2002 2004 2006 2008 2010 2012 2014
20
30
40
50
60
70
80
90 Hotel & Catering
Tem p
Perm
2002 2004 2006 2008 2010 2012 2014
20
30
40
50
60
70
80
90 Nursing/Medical/Care
Perm
Tem p
20
30
40
50
60
70
80
90
2013 2014
Engineering
Tem p
Perm
20
30
40
50
60
70
80
90
2013 2014
Construction
Tem p
Perm
	 	 	This year (Last year)	
		 Rank	 Dec'14	 Rank	 Dec'13
	 	 	This year (Last year)	
	 	 Rank	 Dec'14	 Rank	 Dec'13
*Non-seasonally adjusted data. Prior to April 2013
Engineering/Construction was reported as a single category.
Data are presented in the form of diffusion indices whereby
a reading of 50 indicates no change on the previous month.
Readings above 50 signal stronger demand than a month
ago. Readings below 50 signal weaker demand than a month
ago.
Nursing/Medical/Care		 1	 65.3	 (2)	 (65.0)
Blue Collar			 2	 65.3	 (5)	 (63.5)
Hotel & Catering			 3	 63.8	 (7)	 (59.0)
Secretarial/Clerical		 4	 63.5	 (4)	 (64.1)
IT & Computing			 5	 62.4	 (1)	 (65.5)
Accounting/Financial		 6	 60.1	 (3)	 (64.5)
Engineering*			 7	 58.5	 (8)	 (58.8)
Construction*			 8	 56.7	 (6)	 (59.8)
Executive/Professional		 9	 54.3	 (9)	 (57.8)
Accounting/Financial		 1	 64.2	 (4)	 (68.0)
IT & Computing			 2	 63.3	 (3)	 (68.7)
Secretarial/Clerical		 3	 63.1	 (5)	 (64.8)
Executive/Professional		 4	 62.5	 (2)	 (68.9)
Engineering*			 5	 61.5	 (7)	 (58.8)
Nursing/Medical/Care		 6	 61.5	 (1)	 (69.3)
Hotel & Catering			 7	 61.1	 (9)	 (57.5)
Blue Collar			 8	 59.0	 (6)	 (61.5)
Construction*			 9	 55.6	 (7)	 (58.8)
Temporary/contract staff
Higher levels of demand were signalled for all monitored types
of temporary/contract staff in December. The joint-strongest
rates of growth were reported for Nursing/Medical/Care and
Blue Collar workers.
Report on Jobs | Recruitment Industry Survey
Recruitment consultants are asked to report whether
availability of permanent and temporary staff has
changed on the previous month. An overall indicator
of staff availability is also calculated.
Availability of permanent staff
Permanent staff availability continued to deteriorate in
December, continuing the trend observed since May 2013.
Although marked, the latest fall was the slowest in eight
months. Around 42% of panellists reported lower permanent
candidate availability, compared with approximately 8% that
signalled a rise.
Lower permanent staff availability was signalled across
each of the monitored English regions, with the sharpest fall
recorded in the Midlands.
Availability of temp/contract staff
The availability of candidates to fill short-term roles worsened
further in December. The rate of decline was strong, having
accelerated since November.
London-based agencies reported the most marked
reduction in temporary/contract staff availability, followed by
those in the South.
5 Staff availability
1998 199920002001 20022003 200420052006 200720082009 201020112012 20132014
Temp	Availability Permanent	Availability
50	=	no	change	on	previous	month
20
30
40
50
60
70
80
90Improving availability
Deteriorating availability
20
30
40
50
60
70
80
90
Staff Availability
50	=		no	change	on	previous	month
Staff	Availability	Index
Improving availability
Deteriorating availability
2014	Jul	 8.0	 38.6	 53.5	 -45.5	 27.2	 28.5
	 Aug	 7.1	 41.1	 51.8	 -44.8	 27.6	 29.5
	 Sep	 11.7	 43.3	 45.0	 -33.3	 33.3	 33.4
	 Oct	 7.9	 51.3	 40.8	 -32.8	 33.6	 33.7
	 Nov	 8.0	 48.4	 43.6	 -35.6	 32.2	 33.6
	 Dec	 8.1	 50.0	 41.9	 -33.8	 33.1	 36.2
Key permanent staff skills reported in short supply:*
Accountancy/Financial: Audit, Financial Planners,
General Finance, Paraplanners, Tax. Blue Collar: HGV
Drivers. Construction: Project Managers, Rail, Traffic, Site
Managers. Engineering: Aerospace, Engineers, Mechanical.
Executive/Professional: Executives, HR, Legal, Project
Leaders. Hotels/Catering: Chefs, Hospitality. IT/Computing:
Business Analysts, Digital Marketing, Java, .Net, SAP,
Security, Software, Web Developers. Nursing/Medical/
Care: Care Workers, Nurses. Other: Account Managers,
Commercial, Electronics, Manufacturing, Marketing, Product
Managers, Property, Sales, Teachers.
Key temp skills reported in short supply:*
Blue Collar: Drivers, Trades, Warehouse. Engineering:
CAD, Engineers, Manufacturing, Mechanical. Hotels/
Catering: Catering. IT/Computing: Business Intelligence,
Java, .Net, Software, SQL. Nursing/Medical/Care: Care
Staff, Medical. Other: Languages.
Availability of permanent staff
Q. Is the availability of candidates for permanent vacancies
better, the same or worse than one month ago?
	 	 Better	 Same	 Worse	 Net	 Index	 S.Adj.	
	           	 %	 %	 %	 +/-	 	 Index
2014	Jul	 13.0	 44.2	 42.8	 -29.8	 35.1	 36.5
	 Aug	 12.8	 46.5	 40.7	 -27.9	 36.0	 37.9
	 Sep	 10.7	 51.8	 37.6	 -26.9	 36.5	 37.4
	 Oct	 8.5	 54.1	 37.5	 -29.0	 35.5	 36.9
	 Nov	 15.5	 53.1	 31.4	 -15.9	 42.0	 41.2
	 Dec	 12.4	 52.7	 34.9	 -22.6	 38.7	 39.8
Availability of temporary/contract staff
Q. Is the availability of candidates for temporary vacancies
better, the same or worse than one month ago?
	 	 Better	 Same	 Worse	 Net	 Index	 S.Adj.	
	           	 %	 %	 %	 +/-	 	 Index
All Intellectual Property Rights owned by Markit Economics Limited
*consultants are invited to specify any areas in which they have encountered skill
shortages during the latest month
Report on Jobs | Recruitment Industry Survey
The recruitment industry survey tracks both the
average salaries awarded to people placed in
permanent jobs each month, as well as average
hourly rates of pay for temp/contract staff.
Permanent salaries
Recruitment consultants reported a further rise in average
starting salaries for people placed in permanent jobs during
December. The rate of growth was little-changed from
November’s marked pace, with panellists commenting on skill
shortages in a number of areas as a factor driving up pay.
The Midlands continued to lead a broad-based increase in
salaries during the latest survey period.
Temp/contract pay rates
Temporary/contract staff hourly pay rates continued to rise
in December. The latest increase was the strongest in three
months, with a number of panel members commenting on an
imbalance of demand and supply.
The fastest growth of short-term staff pay was recorded in
the North, followed by the Midlands.
6 Pay pressures
1998 1999 2000 2001 2002 2003 2004 2005 2006 2007 2008 2009 2010 2011 2012 2013 2014
35
40
45
50
55
60
65
70
Temp/Contract	Hourly	Pay	Rates
Permanent	Salaries
Increasing rate of decline
Increasing rate of growth
50 = no change on previous month
Pay Pressures
2014	Jun	 38.3	 58.2	 3.5	 34.8	 67.4	 66.2
	 Jul	 35.9	 62.6	 1.5	 34.4	 67.2	 66.0
	 Aug	 33.2	 63.2	 3.6	 29.5	 64.8	 65.7
	 Sep	 32.1	 64.5	 3.4	 28.7	 64.4	 64.0
	 Oct	 28.3	 65.9	 5.8	 22.5	 61.3	 61.9
	 Nov	 27.8	 69.1	 3.2	 24.6	 62.3	 62.5
	 Dec	 24.3	 73.6	 2.1	 22.3	 61.1	 62.3
	 	 Higher	 Same	 Lower	 Net	 Index	 S.Adj.	
	           	 %	 %	 %	 +/-	 	 Index
Permanent Salaries
Q.Areaverage salaries awarded tostaffplaced in permanent
positions higher, the same or lower than one month ago?
2014	Jun	 22.4	 74.1	 3.5	 18.8	 59.4	 59.7
	 Jul	 18.9	 78.2	 2.9	 16.0	 58.0	 58.3
	 Aug	 22.8	 73.0	 4.2	 18.7	 59.3	 59.7
	 Sep	 23.2	 74.0	 2.8	 20.4	 60.2	 59.9
	 Oct	 24.4	 71.6	 4.0	 20.4	 60.2	 57.3
	 Nov	 19.4	 77.1	 3.4	 16.0	 58.0	 57.7
	 Dec	 18.1	 78.6	 3.3	 14.9	 57.4	 59.2
	 	 Higher	 Same	 Lower	 Net	 Index	 S.Adj.	
	           	 %	 %	 %	 +/-	 	 Index
Temporary/Contract Pay Rates
Q. Are average hourly pay rates for temporary/contract staff
higher, the same or lower than one month ago?
2001 2002 2003 2004 2005 2006 2007 2008 2009 2010 2011 2012 2013 2014
-6
-3
0
3
6
9
Public	sector
Private	sector
Annual percent change
Yr/yr % chg in average weekly earnings (3mma)
	 2011	 2012	 2013	 Jul'14	 Aug	 Sep	 Oct
Whole economy	 2.4	 1.4	 1.2	 0.6	 0.7	 1.0	 1.4
Private sector	 2.4	 1.5	 1.4	 0.9	 1.1	 1.2	 1.7
Public sector	 2.7	 1.6	 0.7	 -0.3	 -0.1	 0.8	 0.6
Services	 2.8	 1.5	 1.1	 0.4	 0.5	 0.8	 1.3
Manufacturing	 1.6	 1.8	 2.2	 2.0	 1.8	 1.9	 1.8
Construction	 0.8	 0.9	 0.0	 1.1	 2.0	 2.4	 2.0
UK average weekly earnings
Data from the Office for National Statistics indicated
that employee earnings (including bonuses) rose 1.4%
on an annual basis in the three months to October,
the fastest growth since the three months to March.
This was driven by a sharper increase in private sector
earnings, as public sector pay growth slowed.
Report on Jobs | Recruitment Industry Survey
7 Feature Regional claimant count	
	 KPMG LLP, a UK limited liability partnership, is a
	 subsidiary of KPMG Europe LLP and operates
	 from 22 offices across the UK with over 12,000
partners and staff.  The UK firm recorded a turnover of £1.8 billion
in the year ended September 2012. KPMG is a global network of
professional firms providing Audit, Tax, and Advisory services. We
operate in 156 countries and have 152,000 professionals working in
member firms around the world. The independent member firms of
the KPMG network are affiliated with KPMG International Cooperative
(“KPMG International”), a Swiss entity. KPMG International provides
no client services.
	 The REC is the professional body representing
	 the UK’s £24.6 billion private recruitment and
	 staffingindustrywithmorethan8,000recruitment
agencies and 6,000 recruitment consultants in membership. There are
over 1 million temporary workers registered with UK agencies who are
deployed in industry, commerce and the public services every day.
	 is a leading global diversified provider of
	 financial 	 information services. We provide
productsthatenhancetransparency,reduceriskandimproveoperational
efficiency. Our customers include banks, hedge funds, asset managers,
central banks, regulators, auditors, fund administrators and insurance
companies. Founded in 2003, we employ over 3,000 people in 11
countries. For more information, please see www.markit.com.
Recruitment Industry Survey
The monthly survey features original research data collected via
questionnaire by Markit from a panel of 400 UK recruitment and
employment consultancies. In 2010/11, some 1,049,333 people were
employed in either temporary or contract work through consultancies
and 604,193 people were placed in permanent positions through
consultancies. Monthly survey data were first collected in October
1997 and are collected in the end of each month, with respondents
asked to specify the direction of change in a number of survey variables.
Markit do not revise underlying survey data after first publication, but
seasonal adjustment factors may be revised from time to time as
appropriate which will affect the seasonally adjusted data series.
The intellectual property rights to these data are owned by or licensed to
MarkitEconomicsLimited.Anyunauthoriseduse,includingbutnotlimitedto
copying, distributing, transmitting or otherwise of any data appearing is not
permitted without Markit’s prior consent. The publication or release of any
of these data prior to the general release time is an infringement of Markit
Economics Limited’s intellectual property rights. Markit shall not have any
liability, duty or obligation for or relating to the content or information (“data”)
contained herein, any errors, inaccuracies, omissions or delays in the data,
or for any actions taken in reliance thereon. In no event shall Markit be liable
for any special, incidental, or consequential damages, arising out of the use
of the data. Purchasing Managers’ Index®
and PMI®
are either registered
trade marks of Markit Economics Limited or licensed to Markit Economics
Limited. Markit is a registered trade mark of Markit Group Limited.
UK claimant count rate drops to 2.7%
November saw the number of people claiming Jobseeker’s
Allowance in the UK fall by 26,900 to 900,100, the lowest since
July 2008.
That was according to the latest data from the Office for National
Statistics (ONS), which added that the corresponding claimant
count rate* dropped to 2.7% in the penultimate month of the year
– likewise the lowest since July 2008.
The South East of England again recorded the lowest overall
unemployment rate at the regional level, its 1.5% slightly better
than the 1.6% registered in the South West of England.
Northern Ireland continued to post the highest claimant count rate
at 5.8%, followed by the North East at 4.5%.
All Intellectual Property Rights owned by Markit Economics Limited
South East	 71	 1.5	 (1)
South West	 44	 1.6	 (2)
East of England	 59	 1.9	 (3)
London	 131	 2.4	 (4)
East Midlands	 60	 2.6	 (5)
NW & Merseyside	 100	 2.8	 (6)
Scotland	 87	 3.2	 (7)
West Midlands	 94	 3.4	 (8)
Wales	 51	 3.6	 (9)
Yorks & Humberside	 98	 3.7	 (10)
North East	 55	 4.5	 (11)
Northern Ireland 	 51	 5.8	 (12)
United Kingdom	 900	 2.7	
	 	 	 Claimant count (Nov’14)
Region	 ‘000s	 Rate (%)*	 Rank
Source: Department for Work & Pensions and National Statistics.
* As a percentage of Claimant Count + Workforce Jobs.

More Related Content

What's hot

January Labour Market Update
January Labour Market UpdateJanuary Labour Market Update
January Labour Market UpdateKaylan Bland
 
February Labour Market Update
February Labour Market UpdateFebruary Labour Market Update
February Labour Market UpdateKaylan Bland
 
March 2015 U.S. employment update and outlook
March 2015 U.S. employment update and outlookMarch 2015 U.S. employment update and outlook
March 2015 U.S. employment update and outlookJLL
 
Report on jobs November 6th
Report on jobs November 6thReport on jobs November 6th
Report on jobs November 6thAdrian Orton
 
February 2015 U.S. employment update and outlook
February 2015 U.S. employment update and outlookFebruary 2015 U.S. employment update and outlook
February 2015 U.S. employment update and outlookJLL
 
Employment and Job Market - Canada - July 2016
Employment and Job Market - Canada - July 2016Employment and Job Market - Canada - July 2016
Employment and Job Market - Canada - July 2016paul young cpa, cga
 
Bartlett and west feb 2011 - ar
Bartlett and west   feb 2011 - arBartlett and west   feb 2011 - ar
Bartlett and west feb 2011 - arJustin Main
 
Minneapolis–St. Employment Update | December 2015
Minneapolis–St. Employment Update | December 2015Minneapolis–St. Employment Update | December 2015
Minneapolis–St. Employment Update | December 2015Carolyn Bates
 
March 2018 U.S. employment update and outlook
March 2018 U.S. employment update and outlookMarch 2018 U.S. employment update and outlook
March 2018 U.S. employment update and outlookJLL
 
The Latvian Economy - No 7, September 14, 2011
The Latvian Economy - No 7, September 14, 2011The Latvian Economy - No 7, September 14, 2011
The Latvian Economy - No 7, September 14, 2011Swedbank
 
Business Dynamism, Job Reallocation Rates and the UK Productivity Puzzle (199...
Business Dynamism, Job Reallocation Rates and the UK Productivity Puzzle (199...Business Dynamism, Job Reallocation Rates and the UK Productivity Puzzle (199...
Business Dynamism, Job Reallocation Rates and the UK Productivity Puzzle (199...enterpriseresearchcentre
 
Technological change, employment and wages
Technological change, employment and wagesTechnological change, employment and wages
Technological change, employment and wagesThe Economics Network
 
Minneapolis–St. Paul Employment Update | August 2016
Minneapolis–St. Paul Employment Update | August 2016Minneapolis–St. Paul Employment Update | August 2016
Minneapolis–St. Paul Employment Update | August 2016Carolyn Bates
 

What's hot (20)

January Labour Market Update
January Labour Market UpdateJanuary Labour Market Update
January Labour Market Update
 
February Labour Market Update
February Labour Market UpdateFebruary Labour Market Update
February Labour Market Update
 
March 2015 U.S. employment update and outlook
March 2015 U.S. employment update and outlookMarch 2015 U.S. employment update and outlook
March 2015 U.S. employment update and outlook
 
Earnings Event
Earnings EventEarnings Event
Earnings Event
 
Report on jobs November 6th
Report on jobs November 6thReport on jobs November 6th
Report on jobs November 6th
 
ONS Economic Forum
ONS Economic ForumONS Economic Forum
ONS Economic Forum
 
February 2015 U.S. employment update and outlook
February 2015 U.S. employment update and outlookFebruary 2015 U.S. employment update and outlook
February 2015 U.S. employment update and outlook
 
Ags Ed7 English
Ags Ed7 EnglishAgs Ed7 English
Ags Ed7 English
 
ONS Economic Forum Glasgow
ONS Economic Forum Glasgow ONS Economic Forum Glasgow
ONS Economic Forum Glasgow
 
Employment and Job Market - Canada - July 2016
Employment and Job Market - Canada - July 2016Employment and Job Market - Canada - July 2016
Employment and Job Market - Canada - July 2016
 
Bartlett and west feb 2011 - ar
Bartlett and west   feb 2011 - arBartlett and west   feb 2011 - ar
Bartlett and west feb 2011 - ar
 
Minneapolis–St. Employment Update | December 2015
Minneapolis–St. Employment Update | December 2015Minneapolis–St. Employment Update | December 2015
Minneapolis–St. Employment Update | December 2015
 
March 2018 U.S. employment update and outlook
March 2018 U.S. employment update and outlookMarch 2018 U.S. employment update and outlook
March 2018 U.S. employment update and outlook
 
The Latvian Economy - No 7, September 14, 2011
The Latvian Economy - No 7, September 14, 2011The Latvian Economy - No 7, September 14, 2011
The Latvian Economy - No 7, September 14, 2011
 
Business Dynamism, Job Reallocation Rates and the UK Productivity Puzzle (199...
Business Dynamism, Job Reallocation Rates and the UK Productivity Puzzle (199...Business Dynamism, Job Reallocation Rates and the UK Productivity Puzzle (199...
Business Dynamism, Job Reallocation Rates and the UK Productivity Puzzle (199...
 
July 2015 Chicago Employment Update
July 2015 Chicago Employment UpdateJuly 2015 Chicago Employment Update
July 2015 Chicago Employment Update
 
Technological change, employment and wages
Technological change, employment and wagesTechnological change, employment and wages
Technological change, employment and wages
 
Economic Review 2015-11
Economic Review 2015-11Economic Review 2015-11
Economic Review 2015-11
 
ONS Economic Forum on the road Bristol
ONS Economic Forum on the road BristolONS Economic Forum on the road Bristol
ONS Economic Forum on the road Bristol
 
Minneapolis–St. Paul Employment Update | August 2016
Minneapolis–St. Paul Employment Update | August 2016Minneapolis–St. Paul Employment Update | August 2016
Minneapolis–St. Paul Employment Update | August 2016
 

Viewers also liked

Talent Analytics: Maximizing the TA Value
Talent Analytics: Maximizing the TA ValueTalent Analytics: Maximizing the TA Value
Talent Analytics: Maximizing the TA ValueRob McIntosh
 
The Next Generation Of Employee Referral Programs Will Focus On Improving Qua...
The Next Generation Of Employee Referral Programs Will Focus On Improving Qua...The Next Generation Of Employee Referral Programs Will Focus On Improving Qua...
The Next Generation Of Employee Referral Programs Will Focus On Improving Qua...Dr. John Sullivan
 
How to Measure & Improve Quality of Hire [Webcast]
How to Measure & Improve Quality of Hire [Webcast]How to Measure & Improve Quality of Hire [Webcast]
How to Measure & Improve Quality of Hire [Webcast]LinkedIn Talent Solutions
 
Measure Quality of Hire with Lou Adler | Webcast
Measure Quality of Hire with Lou Adler | WebcastMeasure Quality of Hire with Lou Adler | Webcast
Measure Quality of Hire with Lou Adler | WebcastLinkedIn Talent Solutions
 
Les tendances du Recrutement en France en 2016
Les tendances du Recrutement en France en 2016Les tendances du Recrutement en France en 2016
Les tendances du Recrutement en France en 2016Pierre Bernard
 
Hiring for success — what makes the difference? Why are so many organisations...
Hiring for success — what makes the difference? Why are so many organisations...Hiring for success — what makes the difference? Why are so many organisations...
Hiring for success — what makes the difference? Why are so many organisations...Steven Jagger
 
Framework for improving and measuring quality of hire
Framework for improving and measuring quality of hireFramework for improving and measuring quality of hire
Framework for improving and measuring quality of hireRob McIntosh
 
Quality of Hire
Quality of Hire Quality of Hire
Quality of Hire Cielo
 
Recruitment process Of IBM
Recruitment process Of IBMRecruitment process Of IBM
Recruitment process Of IBMGaurav Gupta
 
Google's Recruitment and Selection Process
Google's Recruitment and Selection ProcessGoogle's Recruitment and Selection Process
Google's Recruitment and Selection ProcessYash Bhatt
 

Viewers also liked (12)

Talent Analytics: Maximizing the TA Value
Talent Analytics: Maximizing the TA ValueTalent Analytics: Maximizing the TA Value
Talent Analytics: Maximizing the TA Value
 
The Next Generation Of Employee Referral Programs Will Focus On Improving Qua...
The Next Generation Of Employee Referral Programs Will Focus On Improving Qua...The Next Generation Of Employee Referral Programs Will Focus On Improving Qua...
The Next Generation Of Employee Referral Programs Will Focus On Improving Qua...
 
How to Measure & Improve Quality of Hire [Webcast]
How to Measure & Improve Quality of Hire [Webcast]How to Measure & Improve Quality of Hire [Webcast]
How to Measure & Improve Quality of Hire [Webcast]
 
Measure Quality of Hire with Lou Adler | Webcast
Measure Quality of Hire with Lou Adler | WebcastMeasure Quality of Hire with Lou Adler | Webcast
Measure Quality of Hire with Lou Adler | Webcast
 
Les tendances du Recrutement en France en 2016
Les tendances du Recrutement en France en 2016Les tendances du Recrutement en France en 2016
Les tendances du Recrutement en France en 2016
 
Hiring for success — what makes the difference? Why are so many organisations...
Hiring for success — what makes the difference? Why are so many organisations...Hiring for success — what makes the difference? Why are so many organisations...
Hiring for success — what makes the difference? Why are so many organisations...
 
Framework for improving and measuring quality of hire
Framework for improving and measuring quality of hireFramework for improving and measuring quality of hire
Framework for improving and measuring quality of hire
 
Cas 75 - Nescafé
Cas 75 - NescaféCas 75 - Nescafé
Cas 75 - Nescafé
 
Quality of Hire
Quality of Hire Quality of Hire
Quality of Hire
 
Recruitment process Of IBM
Recruitment process Of IBMRecruitment process Of IBM
Recruitment process Of IBM
 
Google's Recruitment and Selection Process
Google's Recruitment and Selection ProcessGoogle's Recruitment and Selection Process
Google's Recruitment and Selection Process
 
Recruitment process of nestle
Recruitment process of nestleRecruitment process of nestle
Recruitment process of nestle
 

Similar to December report on Permanent and temporary jobs - Permanent placements rise at faster rate again!

Permanent salaries rise at fastest rate since July 2007
Permanent salaries rise at fastest rate since July 2007Permanent salaries rise at fastest rate since July 2007
Permanent salaries rise at fastest rate since July 2007Steven Jagger
 
U.S. employment update and outlook: January 2015
U.S. employment update and outlook: January 2015 U.S. employment update and outlook: January 2015
U.S. employment update and outlook: January 2015 JLL
 
US employment rate data and trends – January 2017
US employment rate data and trends – January 2017US employment rate data and trends – January 2017
US employment rate data and trends – January 2017JLL
 
First Friday October 2014
First Friday October 2014First Friday October 2014
First Friday October 2014JCianciolo
 
FirstFridayPreview October 2014jims
FirstFridayPreview October 2014jimsFirstFridayPreview October 2014jims
FirstFridayPreview October 2014jimsJim Spellacy
 
DCR Workforce June 2013 Trendline Report
DCR Workforce June 2013 Trendline ReportDCR Workforce June 2013 Trendline Report
DCR Workforce June 2013 Trendline Reportss
 
First Friday august 2014
First Friday august 2014First Friday august 2014
First Friday august 2014Joe Cianciolo
 
DCR TrendLine July 2014 - Non Employee Workforce Insight
DCR TrendLine July 2014 - Non Employee Workforce InsightDCR TrendLine July 2014 - Non Employee Workforce Insight
DCR TrendLine July 2014 - Non Employee Workforce Insightss
 
DCR Trendline April 2015
DCR Trendline April 2015DCR Trendline April 2015
DCR Trendline April 2015ss
 
May 2017 U.S. employment update and outlook
May 2017 U.S. employment update and outlookMay 2017 U.S. employment update and outlook
May 2017 U.S. employment update and outlookJLL
 
U.S. employment rate data and trends June 2014
U.S. employment rate data and trends June 2014U.S. employment rate data and trends June 2014
U.S. employment rate data and trends June 2014JLL
 
February 2016 U.S. employment update and outlook
February 2016 U.S. employment update and outlook February 2016 U.S. employment update and outlook
February 2016 U.S. employment update and outlook JLL
 
April 2015 U.S. employment update and outlook
April 2015 U.S. employment update and outlookApril 2015 U.S. employment update and outlook
April 2015 U.S. employment update and outlookJLL
 
U.S. employment update and outlook: December 2014
U.S. employment update and outlook: December 2014U.S. employment update and outlook: December 2014
U.S. employment update and outlook: December 2014JLL
 
U.S. employment update and outlook: October 2014
U.S. employment update and outlook: October 2014U.S. employment update and outlook: October 2014
U.S. employment update and outlook: October 2014JLL
 
DCR TrendLine September 2014 - Non Employee Workforce Insight
DCR TrendLine September 2014 - Non Employee Workforce InsightDCR TrendLine September 2014 - Non Employee Workforce Insight
DCR TrendLine September 2014 - Non Employee Workforce Insightss
 
U.S. employment update and outlook: November 2014
U.S. employment update and outlook: November 2014U.S. employment update and outlook: November 2014
U.S. employment update and outlook: November 2014JLL
 
November 2015 U.S. employment update and outlook
November 2015 U.S. employment update and outlookNovember 2015 U.S. employment update and outlook
November 2015 U.S. employment update and outlookJLL
 
Economic update (may 2013)
Economic update (may 2013)Economic update (may 2013)
Economic update (may 2013)veredus
 

Similar to December report on Permanent and temporary jobs - Permanent placements rise at faster rate again! (20)

Permanent salaries rise at fastest rate since July 2007
Permanent salaries rise at fastest rate since July 2007Permanent salaries rise at fastest rate since July 2007
Permanent salaries rise at fastest rate since July 2007
 
FFP5DEC14-
FFP5DEC14-FFP5DEC14-
FFP5DEC14-
 
U.S. employment update and outlook: January 2015
U.S. employment update and outlook: January 2015 U.S. employment update and outlook: January 2015
U.S. employment update and outlook: January 2015
 
US employment rate data and trends – January 2017
US employment rate data and trends – January 2017US employment rate data and trends – January 2017
US employment rate data and trends – January 2017
 
First Friday October 2014
First Friday October 2014First Friday October 2014
First Friday October 2014
 
FirstFridayPreview October 2014jims
FirstFridayPreview October 2014jimsFirstFridayPreview October 2014jims
FirstFridayPreview October 2014jims
 
DCR Workforce June 2013 Trendline Report
DCR Workforce June 2013 Trendline ReportDCR Workforce June 2013 Trendline Report
DCR Workforce June 2013 Trendline Report
 
First Friday august 2014
First Friday august 2014First Friday august 2014
First Friday august 2014
 
DCR TrendLine July 2014 - Non Employee Workforce Insight
DCR TrendLine July 2014 - Non Employee Workforce InsightDCR TrendLine July 2014 - Non Employee Workforce Insight
DCR TrendLine July 2014 - Non Employee Workforce Insight
 
DCR Trendline April 2015
DCR Trendline April 2015DCR Trendline April 2015
DCR Trendline April 2015
 
May 2017 U.S. employment update and outlook
May 2017 U.S. employment update and outlookMay 2017 U.S. employment update and outlook
May 2017 U.S. employment update and outlook
 
U.S. employment rate data and trends June 2014
U.S. employment rate data and trends June 2014U.S. employment rate data and trends June 2014
U.S. employment rate data and trends June 2014
 
February 2016 U.S. employment update and outlook
February 2016 U.S. employment update and outlook February 2016 U.S. employment update and outlook
February 2016 U.S. employment update and outlook
 
April 2015 U.S. employment update and outlook
April 2015 U.S. employment update and outlookApril 2015 U.S. employment update and outlook
April 2015 U.S. employment update and outlook
 
U.S. employment update and outlook: December 2014
U.S. employment update and outlook: December 2014U.S. employment update and outlook: December 2014
U.S. employment update and outlook: December 2014
 
U.S. employment update and outlook: October 2014
U.S. employment update and outlook: October 2014U.S. employment update and outlook: October 2014
U.S. employment update and outlook: October 2014
 
DCR TrendLine September 2014 - Non Employee Workforce Insight
DCR TrendLine September 2014 - Non Employee Workforce InsightDCR TrendLine September 2014 - Non Employee Workforce Insight
DCR TrendLine September 2014 - Non Employee Workforce Insight
 
U.S. employment update and outlook: November 2014
U.S. employment update and outlook: November 2014U.S. employment update and outlook: November 2014
U.S. employment update and outlook: November 2014
 
November 2015 U.S. employment update and outlook
November 2015 U.S. employment update and outlookNovember 2015 U.S. employment update and outlook
November 2015 U.S. employment update and outlook
 
Economic update (may 2013)
Economic update (may 2013)Economic update (may 2013)
Economic update (may 2013)
 

Recently uploaded

VIP Call Girls Service Jamshedpur Aishwarya 8250192130 Independent Escort Ser...
VIP Call Girls Service Jamshedpur Aishwarya 8250192130 Independent Escort Ser...VIP Call Girls Service Jamshedpur Aishwarya 8250192130 Independent Escort Ser...
VIP Call Girls Service Jamshedpur Aishwarya 8250192130 Independent Escort Ser...Suhani Kapoor
 
Ethics of Animal Research Laika mission.ppt
Ethics of Animal Research Laika mission.pptEthics of Animal Research Laika mission.ppt
Ethics of Animal Research Laika mission.pptShafqatShakeel1
 
VIP Call Girl Bhilai Aashi 8250192130 Independent Escort Service Bhilai
VIP Call Girl Bhilai Aashi 8250192130 Independent Escort Service BhilaiVIP Call Girl Bhilai Aashi 8250192130 Independent Escort Service Bhilai
VIP Call Girl Bhilai Aashi 8250192130 Independent Escort Service BhilaiSuhani Kapoor
 
Storytelling, Ethics and Workflow in Documentary Photography
Storytelling, Ethics and Workflow in Documentary PhotographyStorytelling, Ethics and Workflow in Documentary Photography
Storytelling, Ethics and Workflow in Documentary PhotographyOrtega Alikwe
 
定制(UQ毕业证书)澳洲昆士兰大学毕业证成绩单原版一比一
定制(UQ毕业证书)澳洲昆士兰大学毕业证成绩单原版一比一定制(UQ毕业证书)澳洲昆士兰大学毕业证成绩单原版一比一
定制(UQ毕业证书)澳洲昆士兰大学毕业证成绩单原版一比一lvtagr7
 
Ch. 9- __Skin, hair and nail Assessment (1).pdf
Ch. 9- __Skin, hair and nail Assessment (1).pdfCh. 9- __Skin, hair and nail Assessment (1).pdf
Ch. 9- __Skin, hair and nail Assessment (1).pdfJamalYaseenJameelOde
 
VIP Call Girl Cuttack Aashi 8250192130 Independent Escort Service Cuttack
VIP Call Girl Cuttack Aashi 8250192130 Independent Escort Service CuttackVIP Call Girl Cuttack Aashi 8250192130 Independent Escort Service Cuttack
VIP Call Girl Cuttack Aashi 8250192130 Independent Escort Service CuttackSuhani Kapoor
 
Gurgaon Call Girls: Free Delivery 24x7 at Your Doorstep G.G.N = 8377087607
Gurgaon Call Girls: Free Delivery 24x7 at Your Doorstep G.G.N = 8377087607Gurgaon Call Girls: Free Delivery 24x7 at Your Doorstep G.G.N = 8377087607
Gurgaon Call Girls: Free Delivery 24x7 at Your Doorstep G.G.N = 8377087607dollysharma2066
 
原版定制卡尔加里大学毕业证(UC毕业证)留信学历认证
原版定制卡尔加里大学毕业证(UC毕业证)留信学历认证原版定制卡尔加里大学毕业证(UC毕业证)留信学历认证
原版定制卡尔加里大学毕业证(UC毕业证)留信学历认证diploma001
 
frfefeferfefqfeferc2012 Report Out Slides Final.ppt
frfefeferfefqfeferc2012 Report Out Slides Final.pptfrfefeferfefqfeferc2012 Report Out Slides Final.ppt
frfefeferfefqfeferc2012 Report Out Slides Final.pptSURYAKANTSAHDEO
 
VIP Call Girls Jamshedpur Ananya 8250192130 Independent Escort Service Jamshe...
VIP Call Girls Jamshedpur Ananya 8250192130 Independent Escort Service Jamshe...VIP Call Girls Jamshedpur Ananya 8250192130 Independent Escort Service Jamshe...
VIP Call Girls Jamshedpur Ananya 8250192130 Independent Escort Service Jamshe...Suhani Kapoor
 
do's and don'ts in Telephone Interview of Job
do's and don'ts in Telephone Interview of Jobdo's and don'ts in Telephone Interview of Job
do's and don'ts in Telephone Interview of JobRemote DBA Services
 
VIP High Profile Call Girls Jamshedpur Aarushi 8250192130 Independent Escort ...
VIP High Profile Call Girls Jamshedpur Aarushi 8250192130 Independent Escort ...VIP High Profile Call Girls Jamshedpur Aarushi 8250192130 Independent Escort ...
VIP High Profile Call Girls Jamshedpur Aarushi 8250192130 Independent Escort ...Suhani Kapoor
 
Outsmarting the Attackers A Deep Dive into Threat Intelligence.docx
Outsmarting the Attackers A Deep Dive into Threat Intelligence.docxOutsmarting the Attackers A Deep Dive into Threat Intelligence.docx
Outsmarting the Attackers A Deep Dive into Threat Intelligence.docxmanas23pgdm157
 
办理学位证(纽伦堡大学文凭证书)纽伦堡大学毕业证成绩单原版一模一样
办理学位证(纽伦堡大学文凭证书)纽伦堡大学毕业证成绩单原版一模一样办理学位证(纽伦堡大学文凭证书)纽伦堡大学毕业证成绩单原版一模一样
办理学位证(纽伦堡大学文凭证书)纽伦堡大学毕业证成绩单原版一模一样umasea
 
办澳洲詹姆斯库克大学毕业证成绩单pdf电子版制作修改
办澳洲詹姆斯库克大学毕业证成绩单pdf电子版制作修改办澳洲詹姆斯库克大学毕业证成绩单pdf电子版制作修改
办澳洲詹姆斯库克大学毕业证成绩单pdf电子版制作修改yuu sss
 
女王大学硕士毕业证成绩单(加急办理)认证海外毕业证
女王大学硕士毕业证成绩单(加急办理)认证海外毕业证女王大学硕士毕业证成绩单(加急办理)认证海外毕业证
女王大学硕士毕业证成绩单(加急办理)认证海外毕业证obuhobo
 
Black and White Minimalist Co Letter.pdf
Black and White Minimalist Co Letter.pdfBlack and White Minimalist Co Letter.pdf
Black and White Minimalist Co Letter.pdfpadillaangelina0023
 
PM Job Search Council Info Session - PMI Silver Spring Chapter
PM Job Search Council Info Session - PMI Silver Spring ChapterPM Job Search Council Info Session - PMI Silver Spring Chapter
PM Job Search Council Info Session - PMI Silver Spring ChapterHector Del Castillo, CPM, CPMM
 
How to Find the Best NEET Coaching in Indore (2).pdf
How to Find the Best NEET Coaching in Indore (2).pdfHow to Find the Best NEET Coaching in Indore (2).pdf
How to Find the Best NEET Coaching in Indore (2).pdfmayank158542
 

Recently uploaded (20)

VIP Call Girls Service Jamshedpur Aishwarya 8250192130 Independent Escort Ser...
VIP Call Girls Service Jamshedpur Aishwarya 8250192130 Independent Escort Ser...VIP Call Girls Service Jamshedpur Aishwarya 8250192130 Independent Escort Ser...
VIP Call Girls Service Jamshedpur Aishwarya 8250192130 Independent Escort Ser...
 
Ethics of Animal Research Laika mission.ppt
Ethics of Animal Research Laika mission.pptEthics of Animal Research Laika mission.ppt
Ethics of Animal Research Laika mission.ppt
 
VIP Call Girl Bhilai Aashi 8250192130 Independent Escort Service Bhilai
VIP Call Girl Bhilai Aashi 8250192130 Independent Escort Service BhilaiVIP Call Girl Bhilai Aashi 8250192130 Independent Escort Service Bhilai
VIP Call Girl Bhilai Aashi 8250192130 Independent Escort Service Bhilai
 
Storytelling, Ethics and Workflow in Documentary Photography
Storytelling, Ethics and Workflow in Documentary PhotographyStorytelling, Ethics and Workflow in Documentary Photography
Storytelling, Ethics and Workflow in Documentary Photography
 
定制(UQ毕业证书)澳洲昆士兰大学毕业证成绩单原版一比一
定制(UQ毕业证书)澳洲昆士兰大学毕业证成绩单原版一比一定制(UQ毕业证书)澳洲昆士兰大学毕业证成绩单原版一比一
定制(UQ毕业证书)澳洲昆士兰大学毕业证成绩单原版一比一
 
Ch. 9- __Skin, hair and nail Assessment (1).pdf
Ch. 9- __Skin, hair and nail Assessment (1).pdfCh. 9- __Skin, hair and nail Assessment (1).pdf
Ch. 9- __Skin, hair and nail Assessment (1).pdf
 
VIP Call Girl Cuttack Aashi 8250192130 Independent Escort Service Cuttack
VIP Call Girl Cuttack Aashi 8250192130 Independent Escort Service CuttackVIP Call Girl Cuttack Aashi 8250192130 Independent Escort Service Cuttack
VIP Call Girl Cuttack Aashi 8250192130 Independent Escort Service Cuttack
 
Gurgaon Call Girls: Free Delivery 24x7 at Your Doorstep G.G.N = 8377087607
Gurgaon Call Girls: Free Delivery 24x7 at Your Doorstep G.G.N = 8377087607Gurgaon Call Girls: Free Delivery 24x7 at Your Doorstep G.G.N = 8377087607
Gurgaon Call Girls: Free Delivery 24x7 at Your Doorstep G.G.N = 8377087607
 
原版定制卡尔加里大学毕业证(UC毕业证)留信学历认证
原版定制卡尔加里大学毕业证(UC毕业证)留信学历认证原版定制卡尔加里大学毕业证(UC毕业证)留信学历认证
原版定制卡尔加里大学毕业证(UC毕业证)留信学历认证
 
frfefeferfefqfeferc2012 Report Out Slides Final.ppt
frfefeferfefqfeferc2012 Report Out Slides Final.pptfrfefeferfefqfeferc2012 Report Out Slides Final.ppt
frfefeferfefqfeferc2012 Report Out Slides Final.ppt
 
VIP Call Girls Jamshedpur Ananya 8250192130 Independent Escort Service Jamshe...
VIP Call Girls Jamshedpur Ananya 8250192130 Independent Escort Service Jamshe...VIP Call Girls Jamshedpur Ananya 8250192130 Independent Escort Service Jamshe...
VIP Call Girls Jamshedpur Ananya 8250192130 Independent Escort Service Jamshe...
 
do's and don'ts in Telephone Interview of Job
do's and don'ts in Telephone Interview of Jobdo's and don'ts in Telephone Interview of Job
do's and don'ts in Telephone Interview of Job
 
VIP High Profile Call Girls Jamshedpur Aarushi 8250192130 Independent Escort ...
VIP High Profile Call Girls Jamshedpur Aarushi 8250192130 Independent Escort ...VIP High Profile Call Girls Jamshedpur Aarushi 8250192130 Independent Escort ...
VIP High Profile Call Girls Jamshedpur Aarushi 8250192130 Independent Escort ...
 
Outsmarting the Attackers A Deep Dive into Threat Intelligence.docx
Outsmarting the Attackers A Deep Dive into Threat Intelligence.docxOutsmarting the Attackers A Deep Dive into Threat Intelligence.docx
Outsmarting the Attackers A Deep Dive into Threat Intelligence.docx
 
办理学位证(纽伦堡大学文凭证书)纽伦堡大学毕业证成绩单原版一模一样
办理学位证(纽伦堡大学文凭证书)纽伦堡大学毕业证成绩单原版一模一样办理学位证(纽伦堡大学文凭证书)纽伦堡大学毕业证成绩单原版一模一样
办理学位证(纽伦堡大学文凭证书)纽伦堡大学毕业证成绩单原版一模一样
 
办澳洲詹姆斯库克大学毕业证成绩单pdf电子版制作修改
办澳洲詹姆斯库克大学毕业证成绩单pdf电子版制作修改办澳洲詹姆斯库克大学毕业证成绩单pdf电子版制作修改
办澳洲詹姆斯库克大学毕业证成绩单pdf电子版制作修改
 
女王大学硕士毕业证成绩单(加急办理)认证海外毕业证
女王大学硕士毕业证成绩单(加急办理)认证海外毕业证女王大学硕士毕业证成绩单(加急办理)认证海外毕业证
女王大学硕士毕业证成绩单(加急办理)认证海外毕业证
 
Black and White Minimalist Co Letter.pdf
Black and White Minimalist Co Letter.pdfBlack and White Minimalist Co Letter.pdf
Black and White Minimalist Co Letter.pdf
 
PM Job Search Council Info Session - PMI Silver Spring Chapter
PM Job Search Council Info Session - PMI Silver Spring ChapterPM Job Search Council Info Session - PMI Silver Spring Chapter
PM Job Search Council Info Session - PMI Silver Spring Chapter
 
How to Find the Best NEET Coaching in Indore (2).pdf
How to Find the Best NEET Coaching in Indore (2).pdfHow to Find the Best NEET Coaching in Indore (2).pdf
How to Find the Best NEET Coaching in Indore (2).pdf
 

December report on Permanent and temporary jobs - Permanent placements rise at faster rate again!

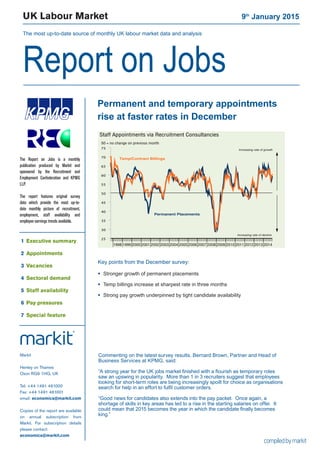
  • 1. UK Labour Market 9th January 2015 The most up-to-date source of monthly UK labour market data and analysis Report on Jobs 1998 1999 2000 2001 2002 2003 2004 2005 2006 2007 2008 2009 2010 2011 2012 2013 2014 25 30 35 40 45 50 55 60 65 70 75 Temp/Contract Billings Permanent Placements Increasing rate of decline Increasing rate of growth 50 = no change on previous month Staff Appointments via Recruitment Consultancies Permanent and temporary appointments rise at faster rates in December Commenting on the latest survey results, Bernard Brown, Partner and Head of Business Services at KPMG, said: “A strong year for the UK jobs market finished with a flourish as temporary roles saw an upswing in popularity. More than 1 in 3 recruiters suggest that employees looking for short-term roles are being increasingly spoilt for choice as organisations search for help in an effort to fulfil customer orders. “Good news for candidates also extends into the pay packet. Once again, a shortage of skills in key areas has led to a rise in the starting salaries on offer. It could mean that 2015 becomes the year in which the candidate finally becomes king.” Markit Henley on Thames Oxon RG9 1HG, UK Tel: +44 1491 461000 Fax: +44 1491 461001 email: economics@markit.com Copies of the report are available on annual subscription from Markit. For subscription details please contact: economics@markit.com The Report on Jobs is a monthly publication produced by Markit and sponsored by the Recruitment and Employment Confederation and KPMG LLP. The report features original survey data which provide the most up-to- date monthly picture of recruitment, employment, staff availability and employee earnings trends available. 1 Executive summary 2 Appointments 3 Vacancies 4 Sectoral demand 5 Staff availability 6 Pay pressures 7 Special feature Key points from the December survey: Stronger growth of permanent placements Temp billings increase at sharpest rate in three months Strong pay growth underpinned by tight candidate availability   
  • 2. Report on Jobs | Recruitment Industry Survey The Report on Jobs is unique in providing the most comprehensive guide to the UK labour market, drawing on original survey data provided by recruitment consultancies and employers to provide the first indication each month of labour market trends. The main findings for December are: Permanent placements rise at faster rate... Recruitment consultants signalled a further increase in permanent staff appointments during December. The rate of expansion was strong, having picked up from November’s 18-month low. However, the number of job vacancies available to people seeking permanent roles rose at the slowest pace since July 2013. ...while temp billings growth also accelerates Short-term staff appointments increased at a sharper rate in December. The latest rise in temp billings was the strongest in three months. Pay growth remains marked Average starting salaries awarded to people placed in permanent jobs continued to rise, with the rate of growth little- changed from the strong pace recorded in November. Temp pay meanwhile increased at the sharpest rate in three months. Candidate availability remains tight The availability of staff to fill permanent job roles continued to fall in December. Although easing to the slowest in eight months, the rate of deterioration remained marked. Temp availability decreased sharply, with the latest reduction faster than that recorded in November. 1 Executive summary 1998 1999 2000 2001 2002 2003 2004 2005 2006 2007 2008 2009 2010 2011 2012 2013 2014 25 30 35 40 45 50 55 60 65 70 Staff Appointments Temp/Contract Billings Permanent Placements 25 30 35 40 45 50 55 60 65 70 50 = no change on previous month 50=no change on previous month 1998 1999 2000 2001 2002 2003 2004 2005 2006 2007 2008 2009 2010 2011 2012 2013 2014 35 40 45 50 55 60 65 70 Staff Availability and Earnings Growth Skill shortages Average permanent salaries (LHS) 90 80 70 60 50 40 30 50 = no change on previous month 50 = no change on previous month (inverted) inverted - RHS) (Availability of staff 1998 1999 2000 2001 2002 2003 2004 2005 2006 2007 2008 2009 2010 2011 2012 2013 2014 Temp/Contract Vacancies Permanent Vacancies 50 = no change on previous month 25 30 35 40 45 50 55 60 65 70 75 Increasing rate of growth Increasing rate of decline Demand for staff All Intellectual Property Rights owned by Markit Economics Limited
  • 3. Report on Jobs | Recruitment Industry Survey Recruitment consultancies report on the number of people placed in permanent jobs each month, and their revenues (billings) received from placing people in temporary or contract positions at employers. Latest recruitment survey data highlighted faster growth of staff appointments during the final month of 2014. Growth of permanent placements accelerates The number of people placed in permanent jobs by recruitment consultancies continued to rise in December. After accounting for the usual seasonal factors, the latest index reading signalled that the rate of expansion quickened from November’s 18-month low and was marked overall. Panel members commented that general demand conditions remained strong, although there were difficulties in finding suitable candidates for certain skill-sets. The fastest growth of permanent staff appointments was indicated in the South of England, while the slowest rise was signalled in the North. Temp billings rise at fastest rate in three months Agencies’ billings from the employment of temporary/contract staff increased further in December. The pace of growth was strong, having quickened to a three-month high. Around 35% of panellists signalled higher temp billings, more than twice the proportion that noted a decline. Rising client workloads were reported as the main factor supporting growth of short-term staff appointments. In contrast to the trend seen for permanent placements, the strongest growth of temp billings was signalled by Northern- based agencies, while the South posted the slowest expansion. An index reading above 50 signals a higher number of placements/billings than the previous month. Readings below 50 signal a decline compared with the previous month. 2 Staff appointments 1998 1999 2000 2001 2002 2003 2004 2005 2006 2007 2008 2009 2010 2011 2012 2013 2014 25 30 35 40 45 50 55 60 65 70 75 Temp/Contract Billings Permanent Placements Increasing rate of decline Increasing rate of growth 50 = no change on previous month Staff Appointments via Recruitment Consultancies 2014 Jul 48.4 38.3 13.3 35.1 67.5 64.9 Aug 41.1 33.9 25.0 16.2 58.1 62.4 Sep 45.2 34.3 20.5 24.7 62.4 60.1 Oct 44.4 30.1 25.4 19.0 59.5 59.8 Nov 33.1 38.5 28.4 4.7 52.4 56.9 Dec 31.7 37.2 31.1 0.6 50.3 59.0 Higher Same Lower Net Index S.Adj. % % % +/- 50 = no chg Index Permanent Staff Placements Q. Please compare the number of staff placed in permanent positions with the number one month ago. 2014 Jul 48.0 37.5 14.5 33.6 66.8 63.0 Aug 40.8 38.2 21.0 19.7 59.9 61.0 Sep 47.1 38.3 14.6 32.5 66.2 62.4 Oct 34.1 44.7 21.2 12.9 56.5 57.5 Nov 38.7 42.3 19.0 19.7 59.8 59.5 Dec 34.5 48.8 16.8 17.7 58.8 60.1 Higher Same Lower Net Index S.Adj. % % % +/- 50 = no chg Index Temporary/Contract Staff Billings Q. Please compare your billings received from the employment of temporary and contract staff with the situation one month ago.
  • 4. Report on Jobs | Recruitment Industry Survey 3 Vacancies All Intellectual Property Rights owned by Markit Economics Limited Recruitment consultants are asked to specify whether the demand for staff from employers has changed on the previous month, thereby providing an indicator of the number of job vacancies. The summary indexes shown in this page are derived from the detailed sector data shown on page 5. Growth of demand for staff eases further The Report on Jobs Vacancy Index fell to a 17-month low in December. Recording 62.5, down from 64.0 in November, the Report on Jobs Vacancy Index nevertheless remained indicative of a strong rate of expansion overall. Growth of demand eased for permanent staff in the latest survey period, but accelerated for temporary workers. Public & private sector vacancies Private sector demand for staff remained substantially stronger than that from the public sector in December. Private sector permanent staff posted the fastest increase overall. Other vacancy indicators Latest official data from the Office for National Statistics (ONS) indicated that vacancies rose 22.1% on an annual basis in the three months to November. Meanwhile, internet-based recruitment spending continued to increase at a strong annual pace. Latest data showed a 8.8% rise in Q2 2014 from the corresponding period one year earlier. The Job Vacancies Index monitors the overall demand for staff at recruitment consultancies. An index reading above 50 signals a higher number of vacancies than the previous month. Readings below 50 signal a decline compared with the previous month. 19981999200020012002200320042005200620072008200920102011201220132014 Temp/Contract Vacancies Permanent Vacancies 50 = no change on previous month 25 30 35 40 45 50 55 60 65 70 75 Increasing rate of growth Increasing rate of decline 25 30 35 40 45 50 55 60 65 70 75 Job Vacancies 50 = no change on previous month Vacancy Index Increasing rate of growth Increasing rate of decline Job Vacancy Indicators Aug’14 Sep Oct Nov Dec Job Vacancy Index (recruitment industry survey) 50 = no change on previous month Other key vacancy data Annual % change Sources: Job centre vacancies provided by ONS via EcoWin. Internet recruitment spending provided by WARC.com Total 68.0 67.1 65.7 64.0 62.5 Permanent Staff 68.0 67.1 65.8 64.2 62.5 Temporary Staff 68.5 66.8 64.9 61.8 62.3 Public: perm 54.1 58.0 57.0 54.5 51.9 Public: temp 58.9 57.9 56.6 56.9 54.5 Private: perm 70.8 69.0 68.4 67.1 65.3 Private: temp 72.6 71.2 65.7 65.1 64.3 Job centre vacancies 26.8 24.8 25.0 22.1 n/a Internet recruitment 8.8 -- -- -- -- Public & private sector vacancies (not seasonally adjusted)
  • 5. Report on Jobs | Recruitment Industry Survey Recruitment consultancies are requested to compare the demand for staff according to sector with the situation one month ago. Permanent Staff Accounting/Financial topped the demand for staff ‘league table’ in December, ahead of IT & Computing and Secretarial/ Clerical. The slowest rise in demand was signalled for Construction workers. 4 Demand for staff by sector 50 = no change on previous month Demand for staff 20 30 40 50 60 70 80 90 Secretarial & Clerical Perm Tem p 2002 2004 2006 2008 2010 2012 2014 20 30 40 50 60 70 80 90 Accounting & Financial Tem p Perm 2002 2004 2006 2008 2010 2012 2014 2002 2004 2006 2008 2010 2012 2014 20 30 40 50 60 70 80 90 Executive & Professional Perm Tem p 2002 2004 2006 2008 2010 2012 2014 20 30 40 50 60 70 80 90 IT & Computing Tem p Perm 20 30 40 50 60 70 80 90 2002 2004 2006 2008 2010 2012 2014 Tem p Blue Collar Perm 2002 2004 2006 2008 2010 2012 2014 20 30 40 50 60 70 80 90 Hotel & Catering Tem p Perm 2002 2004 2006 2008 2010 2012 2014 20 30 40 50 60 70 80 90 Nursing/Medical/Care Perm Tem p 20 30 40 50 60 70 80 90 2013 2014 Engineering Tem p Perm 20 30 40 50 60 70 80 90 2013 2014 Construction Tem p Perm This year (Last year) Rank Dec'14 Rank Dec'13 This year (Last year) Rank Dec'14 Rank Dec'13 *Non-seasonally adjusted data. Prior to April 2013 Engineering/Construction was reported as a single category. Data are presented in the form of diffusion indices whereby a reading of 50 indicates no change on the previous month. Readings above 50 signal stronger demand than a month ago. Readings below 50 signal weaker demand than a month ago. Nursing/Medical/Care 1 65.3 (2) (65.0) Blue Collar 2 65.3 (5) (63.5) Hotel & Catering 3 63.8 (7) (59.0) Secretarial/Clerical 4 63.5 (4) (64.1) IT & Computing 5 62.4 (1) (65.5) Accounting/Financial 6 60.1 (3) (64.5) Engineering* 7 58.5 (8) (58.8) Construction* 8 56.7 (6) (59.8) Executive/Professional 9 54.3 (9) (57.8) Accounting/Financial 1 64.2 (4) (68.0) IT & Computing 2 63.3 (3) (68.7) Secretarial/Clerical 3 63.1 (5) (64.8) Executive/Professional 4 62.5 (2) (68.9) Engineering* 5 61.5 (7) (58.8) Nursing/Medical/Care 6 61.5 (1) (69.3) Hotel & Catering 7 61.1 (9) (57.5) Blue Collar 8 59.0 (6) (61.5) Construction* 9 55.6 (7) (58.8) Temporary/contract staff Higher levels of demand were signalled for all monitored types of temporary/contract staff in December. The joint-strongest rates of growth were reported for Nursing/Medical/Care and Blue Collar workers.
  • 6. Report on Jobs | Recruitment Industry Survey Recruitment consultants are asked to report whether availability of permanent and temporary staff has changed on the previous month. An overall indicator of staff availability is also calculated. Availability of permanent staff Permanent staff availability continued to deteriorate in December, continuing the trend observed since May 2013. Although marked, the latest fall was the slowest in eight months. Around 42% of panellists reported lower permanent candidate availability, compared with approximately 8% that signalled a rise. Lower permanent staff availability was signalled across each of the monitored English regions, with the sharpest fall recorded in the Midlands. Availability of temp/contract staff The availability of candidates to fill short-term roles worsened further in December. The rate of decline was strong, having accelerated since November. London-based agencies reported the most marked reduction in temporary/contract staff availability, followed by those in the South. 5 Staff availability 1998 199920002001 20022003 200420052006 200720082009 201020112012 20132014 Temp Availability Permanent Availability 50 = no change on previous month 20 30 40 50 60 70 80 90Improving availability Deteriorating availability 20 30 40 50 60 70 80 90 Staff Availability 50 = no change on previous month Staff Availability Index Improving availability Deteriorating availability 2014 Jul 8.0 38.6 53.5 -45.5 27.2 28.5 Aug 7.1 41.1 51.8 -44.8 27.6 29.5 Sep 11.7 43.3 45.0 -33.3 33.3 33.4 Oct 7.9 51.3 40.8 -32.8 33.6 33.7 Nov 8.0 48.4 43.6 -35.6 32.2 33.6 Dec 8.1 50.0 41.9 -33.8 33.1 36.2 Key permanent staff skills reported in short supply:* Accountancy/Financial: Audit, Financial Planners, General Finance, Paraplanners, Tax. Blue Collar: HGV Drivers. Construction: Project Managers, Rail, Traffic, Site Managers. Engineering: Aerospace, Engineers, Mechanical. Executive/Professional: Executives, HR, Legal, Project Leaders. Hotels/Catering: Chefs, Hospitality. IT/Computing: Business Analysts, Digital Marketing, Java, .Net, SAP, Security, Software, Web Developers. Nursing/Medical/ Care: Care Workers, Nurses. Other: Account Managers, Commercial, Electronics, Manufacturing, Marketing, Product Managers, Property, Sales, Teachers. Key temp skills reported in short supply:* Blue Collar: Drivers, Trades, Warehouse. Engineering: CAD, Engineers, Manufacturing, Mechanical. Hotels/ Catering: Catering. IT/Computing: Business Intelligence, Java, .Net, Software, SQL. Nursing/Medical/Care: Care Staff, Medical. Other: Languages. Availability of permanent staff Q. Is the availability of candidates for permanent vacancies better, the same or worse than one month ago? Better Same Worse Net Index S.Adj. % % % +/- Index 2014 Jul 13.0 44.2 42.8 -29.8 35.1 36.5 Aug 12.8 46.5 40.7 -27.9 36.0 37.9 Sep 10.7 51.8 37.6 -26.9 36.5 37.4 Oct 8.5 54.1 37.5 -29.0 35.5 36.9 Nov 15.5 53.1 31.4 -15.9 42.0 41.2 Dec 12.4 52.7 34.9 -22.6 38.7 39.8 Availability of temporary/contract staff Q. Is the availability of candidates for temporary vacancies better, the same or worse than one month ago? Better Same Worse Net Index S.Adj. % % % +/- Index All Intellectual Property Rights owned by Markit Economics Limited *consultants are invited to specify any areas in which they have encountered skill shortages during the latest month
  • 7. Report on Jobs | Recruitment Industry Survey The recruitment industry survey tracks both the average salaries awarded to people placed in permanent jobs each month, as well as average hourly rates of pay for temp/contract staff. Permanent salaries Recruitment consultants reported a further rise in average starting salaries for people placed in permanent jobs during December. The rate of growth was little-changed from November’s marked pace, with panellists commenting on skill shortages in a number of areas as a factor driving up pay. The Midlands continued to lead a broad-based increase in salaries during the latest survey period. Temp/contract pay rates Temporary/contract staff hourly pay rates continued to rise in December. The latest increase was the strongest in three months, with a number of panel members commenting on an imbalance of demand and supply. The fastest growth of short-term staff pay was recorded in the North, followed by the Midlands. 6 Pay pressures 1998 1999 2000 2001 2002 2003 2004 2005 2006 2007 2008 2009 2010 2011 2012 2013 2014 35 40 45 50 55 60 65 70 Temp/Contract Hourly Pay Rates Permanent Salaries Increasing rate of decline Increasing rate of growth 50 = no change on previous month Pay Pressures 2014 Jun 38.3 58.2 3.5 34.8 67.4 66.2 Jul 35.9 62.6 1.5 34.4 67.2 66.0 Aug 33.2 63.2 3.6 29.5 64.8 65.7 Sep 32.1 64.5 3.4 28.7 64.4 64.0 Oct 28.3 65.9 5.8 22.5 61.3 61.9 Nov 27.8 69.1 3.2 24.6 62.3 62.5 Dec 24.3 73.6 2.1 22.3 61.1 62.3 Higher Same Lower Net Index S.Adj. % % % +/- Index Permanent Salaries Q.Areaverage salaries awarded tostaffplaced in permanent positions higher, the same or lower than one month ago? 2014 Jun 22.4 74.1 3.5 18.8 59.4 59.7 Jul 18.9 78.2 2.9 16.0 58.0 58.3 Aug 22.8 73.0 4.2 18.7 59.3 59.7 Sep 23.2 74.0 2.8 20.4 60.2 59.9 Oct 24.4 71.6 4.0 20.4 60.2 57.3 Nov 19.4 77.1 3.4 16.0 58.0 57.7 Dec 18.1 78.6 3.3 14.9 57.4 59.2 Higher Same Lower Net Index S.Adj. % % % +/- Index Temporary/Contract Pay Rates Q. Are average hourly pay rates for temporary/contract staff higher, the same or lower than one month ago? 2001 2002 2003 2004 2005 2006 2007 2008 2009 2010 2011 2012 2013 2014 -6 -3 0 3 6 9 Public sector Private sector Annual percent change Yr/yr % chg in average weekly earnings (3mma) 2011 2012 2013 Jul'14 Aug Sep Oct Whole economy 2.4 1.4 1.2 0.6 0.7 1.0 1.4 Private sector 2.4 1.5 1.4 0.9 1.1 1.2 1.7 Public sector 2.7 1.6 0.7 -0.3 -0.1 0.8 0.6 Services 2.8 1.5 1.1 0.4 0.5 0.8 1.3 Manufacturing 1.6 1.8 2.2 2.0 1.8 1.9 1.8 Construction 0.8 0.9 0.0 1.1 2.0 2.4 2.0 UK average weekly earnings Data from the Office for National Statistics indicated that employee earnings (including bonuses) rose 1.4% on an annual basis in the three months to October, the fastest growth since the three months to March. This was driven by a sharper increase in private sector earnings, as public sector pay growth slowed.
  • 8. Report on Jobs | Recruitment Industry Survey 7 Feature Regional claimant count KPMG LLP, a UK limited liability partnership, is a subsidiary of KPMG Europe LLP and operates from 22 offices across the UK with over 12,000 partners and staff. The UK firm recorded a turnover of £1.8 billion in the year ended September 2012. KPMG is a global network of professional firms providing Audit, Tax, and Advisory services. We operate in 156 countries and have 152,000 professionals working in member firms around the world. The independent member firms of the KPMG network are affiliated with KPMG International Cooperative (“KPMG International”), a Swiss entity. KPMG International provides no client services. The REC is the professional body representing the UK’s £24.6 billion private recruitment and staffingindustrywithmorethan8,000recruitment agencies and 6,000 recruitment consultants in membership. There are over 1 million temporary workers registered with UK agencies who are deployed in industry, commerce and the public services every day. is a leading global diversified provider of financial information services. We provide productsthatenhancetransparency,reduceriskandimproveoperational efficiency. Our customers include banks, hedge funds, asset managers, central banks, regulators, auditors, fund administrators and insurance companies. Founded in 2003, we employ over 3,000 people in 11 countries. For more information, please see www.markit.com. Recruitment Industry Survey The monthly survey features original research data collected via questionnaire by Markit from a panel of 400 UK recruitment and employment consultancies. In 2010/11, some 1,049,333 people were employed in either temporary or contract work through consultancies and 604,193 people were placed in permanent positions through consultancies. Monthly survey data were first collected in October 1997 and are collected in the end of each month, with respondents asked to specify the direction of change in a number of survey variables. Markit do not revise underlying survey data after first publication, but seasonal adjustment factors may be revised from time to time as appropriate which will affect the seasonally adjusted data series. The intellectual property rights to these data are owned by or licensed to MarkitEconomicsLimited.Anyunauthoriseduse,includingbutnotlimitedto copying, distributing, transmitting or otherwise of any data appearing is not permitted without Markit’s prior consent. The publication or release of any of these data prior to the general release time is an infringement of Markit Economics Limited’s intellectual property rights. Markit shall not have any liability, duty or obligation for or relating to the content or information (“data”) contained herein, any errors, inaccuracies, omissions or delays in the data, or for any actions taken in reliance thereon. In no event shall Markit be liable for any special, incidental, or consequential damages, arising out of the use of the data. Purchasing Managers’ Index® and PMI® are either registered trade marks of Markit Economics Limited or licensed to Markit Economics Limited. Markit is a registered trade mark of Markit Group Limited. UK claimant count rate drops to 2.7% November saw the number of people claiming Jobseeker’s Allowance in the UK fall by 26,900 to 900,100, the lowest since July 2008. That was according to the latest data from the Office for National Statistics (ONS), which added that the corresponding claimant count rate* dropped to 2.7% in the penultimate month of the year – likewise the lowest since July 2008. The South East of England again recorded the lowest overall unemployment rate at the regional level, its 1.5% slightly better than the 1.6% registered in the South West of England. Northern Ireland continued to post the highest claimant count rate at 5.8%, followed by the North East at 4.5%. All Intellectual Property Rights owned by Markit Economics Limited South East 71 1.5 (1) South West 44 1.6 (2) East of England 59 1.9 (3) London 131 2.4 (4) East Midlands 60 2.6 (5) NW & Merseyside 100 2.8 (6) Scotland 87 3.2 (7) West Midlands 94 3.4 (8) Wales 51 3.6 (9) Yorks & Humberside 98 3.7 (10) North East 55 4.5 (11) Northern Ireland 51 5.8 (12) United Kingdom 900 2.7 Claimant count (Nov’14) Region ‘000s Rate (%)* Rank Source: Department for Work & Pensions and National Statistics. * As a percentage of Claimant Count + Workforce Jobs.