Steven Jagger kpmg report on jobs in May
•
1 like•847 views

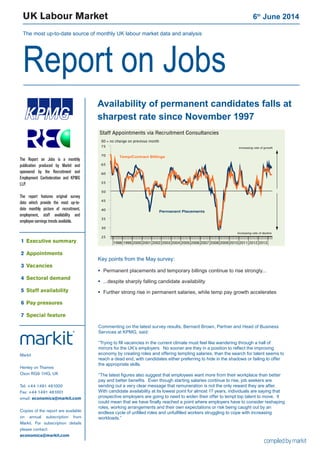
Availability of permanent candidates falls at sharpest rate since November 1997. Key points from the May survey: Permanent placements and temporary billings continue to rise strongly, despite sharply falling candidate availability Further strong rise in permanent salaries, while temp pay growth accelerates

Recommended
Recommended
More Related Content
What's hot
What's hot (20)
Similar to Steven Jagger kpmg report on jobs in May
Similar to Steven Jagger kpmg report on jobs in May (20)
Recently uploaded
Recently uploaded (20)
Steven Jagger kpmg report on jobs in May
- 1. UK Labour Market 6th June 2014 The most up-to-date source of monthly UK labour market data and analysis Report on Jobs 1998 1999 2000 2001 2002 2003 2004 2005 2006 2007 2008 2009 2010 2011 2012 2013 25 30 35 40 45 50 55 60 65 70 75 Temp/Contract Billings Permanent Placements Increasing rate of decline Increasing rate of growth 50 = no change on previous month Staff Appointments via Recruitment Consultancies Availability of permanent candidates falls at sharpest rate since November 1997 Commenting on the latest survey results, Bernard Brown, Partner and Head of Business Services at KPMG, said: “Trying to fill vacancies in the current climate must feel like wandering through a hall of mirrors for the UK’s employers. No sooner are they in a position to reflect the improving economy by creating roles and offering tempting salaries, than the search for talent seems to reach a dead end, with candidates either preferring to hide in the shadows or failing to offer the appropriate skills. “The latest figures also suggest that employees want more from their workplace than better pay and better benefits. Even though starting salaries continue to rise, job seekers are sending out a very clear message that remuneration is not the only reward they are after. With candidate availability at its lowest point for almost 17 years, individuals are saying that prospective employers are going to need to widen their offer to tempt top talent to move. It could mean that we have finally reached a point where employers have to consider reshaping roles, working arrangements and their own expectations or risk being caught out by an endless cycle of unfilled roles and unfulfilled workers struggling to cope with increasing workloads.” Markit Henley on Thames Oxon RG9 1HG, UK Tel: +44 1491 461000 Fax: +44 1491 461001 email: economics@markit.com Copies of the report are available on annual subscription from Markit. For subscription details please contact: economics@markit.com The Report on Jobs is a monthly publication produced by Markit and sponsored by the Recruitment and Employment Confederation and KPMG LLP. The report features original survey data which provide the most up-to- date monthly picture of recruitment, employment, staff availability and employee earnings trends available. 1 Executive summary 2 Appointments 3 Vacancies 4 Sectoral demand 5 Staff availability 6 Pay pressures 7 Special feature Key points from the May survey: Permanent placements and temporary billings continue to rise strongly... ...despite sharply falling candidate availability Further strong rise in permanent salaries, while temp pay growth accelerates
- 2. Report on Jobs | Recruitment Industry Survey The Report on Jobs is unique in providing the most comprehensive guide to the UK labour market, drawing on original survey data provided by recruitment consultancies and employers to provide the first indication each month of labour market trends. The main findings for May are: Steepest drop in permanent staff availability for 16½ years... The availability of candidates to fill permanent roles fell further in May. Moreover, the rate of deterioration accelerated to the sharpest since November 1997. Temporary/contract staff availability was also down markedly, with the latest drop only slightly slower than April’s 13-year record. ...contributes to robust pay growth Although easing slightly from April’s 81-month high, the rate of growth in permanent salaries remained considerable in May. Temporary/contract staff hourly pay rates meanwhile rose at the fastest pace since December 2007. Staff placements continue to increase at marked pace... Permanent placements growth remained marked in May, despite moderating slightly since the previous month. Temporary/contract staff billings also rose strongly, with the rate of expansion quickening from April’s ten-month low. ...supported by strongly rising vacancies Overall demand for staff continued to increase at a marked rate in May, although the pace of growth eased to a five-month low. Permanent vacancies again rose slightly faster than temporary/contract roles. 1 Executive summary 1998 1999 2000 2001 2002 2003 2004 2005 2006 2007 2008 2009 2010 2011 2012 2013 25 30 35 40 45 50 55 60 65 70 Staff Appointments Temp/Contract Billings Permanent Placements 25 30 35 40 45 50 55 60 65 70 50 = no change on previous month 50=no change on previous month 1998 1999 2000 2001 2002 2003 2004 2005 2006 2007 2008 2009 2010 2011 2012 2013 35 40 45 50 55 60 65 70 Staff Availability and Earnings Growth Skill shortages Average permanent salaries (LHS) 90 80 70 60 50 40 30 50 = no change on previous month 50 = no change on previous month (inverted) inverted - RHS) (Availability of staff 1998 1999 2000 2001 2002 2003 2004 2005 2006 2007 2008 2009 2010 2011 2012 2013 Temp/Contract Vacancies Permanent Vacancies 50 = no change on previous month 25 30 35 40 45 50 55 60 65 70 75 Increasing rate of growth Increasing rate of decline Demand for staff All Intellectual Property Rights owned by Markit Economics Limited
- 3. Report on Jobs | Recruitment Industry Survey Recruitment consultancies report on the number of people placed in permanent jobs each month, and their revenues (billings) received from placing people in temporary or contract positions at employers. Staff placements continued to rise strongly in May, with growth of both permanent and temporary appointments remaining marked. Further strong rise in permanent placements May data pointed to another rise in the number of people placed in permanent roles by recruitment consultancies. The rate of expansion remained substantial, despite easing slightly since April. Around 43% of panellists reported higher placements, versus just under 19% that signalled a fall. Increased client demand and rising confidence among employers were reported to have underpinned the latest expansion of permanent placements. However, some respondents commented that shortages of suitable candidates had restricted placements growth. The Midlands continued to register the strongest growth of permanent placements in May, while the slowest rise was indicated in London. Temp billings growth remains marked Agencies’ billings from the employment of temporary/contract staff continued to rise in May. The rate of expansion remained marked, having quickened slightly from April’s ten-month low. Growing business requirements at clients were cited as a factor driving temp billings higher. Temp billings growth was fastest in the Midlands, followed by the South. London and the North posted similar robust rates of expansion. An index reading above 50 signals a higher number of placements/billings than the previous month. Readings below 50 signal a decline compared with the previous month. 2 Staff appointments 1998 1999 2000 2001 2002 2003 2004 2005 2006 2007 2008 2009 2010 2011 2012 2013 25 30 35 40 45 50 55 60 65 70 75 Temp/Contract Billings Permanent Placements Increasing rate of decline Increasing rate of growth 50 = no change on previous month Staff Appointments via Recruitment Consultancies 2013 Dec 39.1 34.6 26.4 12.7 56.3 64.6 2014 Jan 49.8 30.3 19.9 29.8 64.9 62.1 Feb 49.8 33.7 16.5 33.2 66.6 65.2 Mar 49.7 32.7 17.6 32.1 66.0 62.6 Apr 50.1 31.3 18.6 31.4 65.7 63.8 May 43.4 38.0 18.6 24.9 62.4 62.8 Higher Same Lower Net Index S.Adj. % % % +/- 50 = no chg Index Permanent Staff Placements Q. Please compare the number of staff placed in permanent positions with the number one month ago. 2013 Dec 38.9 43.8 17.3 21.6 60.8 63.1 2014 Jan 25.1 45.1 29.8 -4.7 47.6 62.8 Feb 42.2 37.8 20.0 22.2 61.1 61.7 Mar 40.8 46.6 12.6 28.2 64.1 59.9 Apr 37.8 41.9 20.3 17.4 58.7 58.9 May 39.2 43.2 17.6 21.6 60.8 59.1 Higher Same Lower Net Index S.Adj. % % % +/- 50 = no chg Index Temporary/Contract Staff Billings Q. Please compare your billings received from the employment of temporary and contract staff with the situation one month ago.
- 4. Report on Jobs | Recruitment Industry Survey 3 Vacancies All Intellectual Property Rights owned by Markit Economics Limited Recruitment consultants are asked to specify whether the demand for staff from employers has changed on the previous month, thereby providing an indicator of the number of job vacancies. The summary indexes shown in this page are derived from the detailed sector data shown on page 5. Growth of demand remains strong, despite easing to five-month low Demand for staff continued to rise at a considerable rate in May. Although slipping from 67.1 in April, to a five-month low of 66.3, the Report on Jobs Vacancy Index continued to signal a substantial rate of growth. Permanent vacancies continued to rise faster than temporary roles. Public & private sector vacancies Private sector demand for staff remained considerably stronger than that in the public sector, according to the latest data. In both sectors, vacancy growth was faster for permanent employees than temporary staff. Other vacancy indicators Data from the Office for National Statistics showed that job vacancies were up 22.7% on an annual basis in the three months to April. Latest available data signalled that internet-based recruitment spending rose by 10.1% on an annual basis in the fourth quarter of 2013, the fastest growth for two years. The Job Vacancies Index monitors the overall demand for staff at recruitment consultancies. An index reading above 50 signals a higher number of vacancies than the previous month. Readings below 50 signal a decline compared with the previous month. 1998 1999 2000 2001 2002 2003 2004 2005 2006 2007 2008 2009 2010 2011 2012 2013 Temp/Contract Vacancies Permanent Vacancies 50 = no change on previous month 25 30 35 40 45 50 55 60 65 70 75 Increasing rate of growth Increasing rate of decline 25 30 35 40 45 50 55 60 65 70 75 Job Vacancies 50 = no change on previous month Vacancy Index Increasing rate of growth Increasing rate of decline Job Vacancy Indicators Jan’14 Feb Mar Apr May Job Vacancy Index (recruitment industry survey) 50 = no change on previous month Other key vacancy data Annual % change Sources: Job centre vacancies provided by Office for National Statistics Internet recruitment spending provided by WARC.com Total 67.4 66.9 67.2 67.1 66.3 Permanent Staff 67.5 67.0 67.3 67.2 66.4 Temporary Staff 65.1 64.9 65.8 64.9 64.4 Public: perm 57.3 56.7 56.0 56.0 57.1 Public: temp 54.8 56.3 59.7 57.8 55.2 Private: perm 72.1 74.9 72.1 72.6 71.4 Private: temp 61.2 66.8 69.9 67.6 69.4 Job centre vacancies 18.0 19.7 22.1 22.7 n/a Internet recruitment 10.1 -- -- -- -- Public & private sector vacancies (not seasonally adjusted)
- 5. Report on Jobs | Recruitment Industry Survey Recruitment consultancies are requested to compare the demand for staff according to sector with the situation one month ago. Permanent Staff Accounting/Financial took over top spot in the demand for staff ‘league table’ in May. Engineering dropped to second place, although continued to register a marked rate of expansion overall. The slowest growth was signalled for Blue Collar workers. 4 Demand for staff by sector 50 = no change on previous month Demand for staff 20 30 40 50 60 70 80 90 Secretarial & Clerical Perm Tem p 2002 2003 2004 2005 2006 2007 2008 2009 2010 2011 2012 2013 20 30 40 50 60 70 80 90 Accounting & Financial Tem p Perm 20022003 20042005200620072008 2009201020112012 2013 2002 2003 2004 2005 2006 2007 2008 2009 2010 2011 2012 2013 20 30 40 50 60 70 80 90 Executive & Professional Perm Tem p 2002 2003 2004 20052006 2007 20082009 2010 20112012 2013 20 30 40 50 60 70 80 90 IT & Computing Tem p Perm 20 30 40 50 60 70 80 90 2002 2003 2004 2005 2006 2007 2008 2009 2010 2011 2012 2013 Tem p Blue Collar Perm 20 30 40 50 60 70 80 90 200220032004200520062007200820092010201120122013 Nursing/Medical/Care Tem p Perm 2002 2003 2004 2005 2006 2007 2008 2009 2010 2011 2012 2013 20 30 40 50 60 70 80 90 Hotel & Catering Tem p Perm Engineering; Construction This year (Last year) Rank May'14 Rank May'13 This year (Last year) Rank May'14 Rank May'13 *Non-seasonally adjusted data. Prior to April 2013 Engineering/Construction was reported as a single category. Data are presented in the form of diffusion indices whereby a reading of 50 indicates no change on the previous month. Readings above 50 signal stronger demand than a month ago. Readings below 50 signal weaker demand than a month ago. Blue Collar 1 67.8 (2) (55.8) Engineering* 2 64.6 (8) (50.0) Secretarial/Clerical 3 64.2 (4) (53.8) Construction* 4 63.3 (9) (49.4) Hotel & Catering 5 63.2 (5) (53.0) Executive/Professional 6 62.9 (7) (52.1) IT & Computing 7 62.9 (3) (55.6) Accounting/Financial 8 61.5 (6) (52.4) Nursing/Medical/Care 9 60.7 (1) (63.7) Accounting/Financial 1 69.3 (4) (54.7) Engineering* 2 69.0 (8) (50.0) Executive/Professional 3 68.3 (3) (57.1) IT & Computing 4 67.8 (2) (57.9) Nursing/Medical/Care 5 65.3 (1) (58.7) Construction* 6 64.8 (8) (50.0) Secretarial/Clerical 7 64.4 (5) (52.0) Hotel & Catering 8 62.4 (7) (50.3) Blue Collar 9 60.5 (6) (52.0) 46 50 54 58 62 66 70 74 78 Engineering Construction Perm Temp Temporary/contract staff Blue Collar workers were the most in-demand type of temporary staff in the latest survey period. Mirroring the trend for permanent employees, Engineering took second place in the table. Nursing/Medical/Care staff saw the slowest rise in demand for their services.
- 6. Report on Jobs | Recruitment Industry Survey Recruitment consultants are asked to report whether availability of permanent and temporary staff has changed on the previous month. An overall indicator of staff availability is also calculated. Availability of permanent staff Permanent staff availability declined further in May. Moreover, the rate of decline accelerated to the sharpest since November 1997. Approximately 41% of panellists reported lower permanent staff availability, compared with just under 8% that signalled a rise. The South posted the sharpest fall in permanent staff availability in May, although rates of decline were marked across all four English regions. Availability of temp/contract staff Although easing slightly from April’s multi-year peak, the rate of decline in temporary/contract staff availability remained substantial in May. Lower temp availability was recorded in each of the four monitored English regions, with the fastest reduction signalled in the Midlands. 5 Staff availability 1998 1999 2000 2001 2002 2003 2004 2005 2006 2007 2008 2009 2010 2011 2012 2013 Temp Availability Permanent Availability 50 = no change on previous month 20 30 40 50 60 70 80 90Improving availability Deteriorating availability 20 30 40 50 60 70 80 90 Staff Availability 50 = no change on previous month Staff Availability Index Improving availability Deteriorating availability 2013 Dec 10.1 50.1 39.8 -29.8 35.1 39.6 2014 Jan 27.3 42.2 30.5 -3.2 48.4 41.1 Feb 16.8 49.4 33.8 -17.0 41.5 39.0 Mar 13.8 47.9 38.3 -24.5 37.8 38.0 Apr 12.2 50.1 37.7 -25.5 37.2 37.6 May 7.8 51.6 40.5 -32.7 33.6 34.9 Key permanent staff skills reported in short supply:* Accountancy/Financial: Accounts, Credit controllers, Finance, Payroll. Blue Collar: Drivers, Manufacturing, Trades. Engineering: Engineers, Rail. Executive/ Professional: HR, Marketing, Operations managers, Senior management, Solicitors. Nursing/Medical/Care: RGNs, RMNs. IT/Computing: Business analysts, Cloud, Digital media, eCommerce, Games technology, Java, Senior dev, PHP, Project managers. Secretarial/Clerical: Legal secretaries. Other: Customer service, Languages, Sales, Teachers, Tour operators, Utilities. Key temp skills reported in short supply:* Accountancy/Financial: Payroll. Blue Collar: Assembly workers, Drivers. Construction: General construction, Plant operators, Surveyors. Engineering: Electronic, Engineers. Executive/Professional: Project managers, Telecommunications. Hotels/Catering: Chefs. IT/ Computing: Business intelligence, Developers, .Net, SQL. Nursing/Medical/Care: RGNs, RMNs. Secretarial/Clerical: Reception. Other: Customer service. Availability of permanent staff Q. Is the availability of candidates for permanent vacancies better, the same or worse than one month ago? Better Same Worse Net Index S.Adj. % % % +/- Index 2013 Dec 16.0 52.8 31.2 -15.2 42.4 43.6 2014 Jan 24.6 53.2 22.3 2.3 51.1 44.6 Feb 17.6 57.1 25.3 -7.7 46.1 43.6 Mar 10.6 60.2 29.1 -18.5 40.8 41.7 Apr 10.3 56.6 33.2 -22.9 38.6 39.8 May 9.8 57.6 32.6 -22.8 38.6 40.1 Availability of temporary/contract staff Q. Is the availability of candidates for temporary vacancies better, the same or worse than one month ago? Better Same Worse Net Index S.Adj. % % % +/- Index All Intellectual Property Rights owned by Markit Economics Limited *consultants are invited to specify any areas in which they have encountered skill shortages during the latest month
- 7. Report on Jobs | Recruitment Industry Survey The recruitment industry survey tracks both the average salaries awarded to people placed in permanent jobs each month, as well as average hourly rates of pay for temp/contract staff. Permanent salaries Average starting salaries for people placed in permanent jobs by recruitment consultancies continued to rise in May. The rate of growth remained marked, despite easing slightly from April’s 81-month high. A combination of strong demand and candidate shortages was reported to have underpinned salary increases. Permanent salary growth was strongest in the South during May, while the North posted the slowest rise. Temp/contract pay rates Hourly rates of pay for staff in temporary/contract employment rose again in May, with the rate of growth accelerating to the sharpest since December 2007. Each of the four English regions saw increases in temp pay, with the Midlands recording the sharpest rise. 6 Pay pressures 1998 1999 2000 2001 2002 2003 2004 2005 2006 2007 2008 2009 2010 2011 2012 2013 35 40 45 50 55 60 65 70 Temp/Contract Hourly Pay Rates Permanent Salaries Increasing rate of decline Increasing rate of growth 50 = no change on previous month Pay Pressures 2013 Nov 22.3 74.3 3.4 19.0 59.5 59.7 Dec 21.7 75.8 2.5 19.2 59.6 60.6 2014 Jan 23.8 70.3 5.8 18.0 59.0 60.5 Feb 25.5 71.7 2.8 22.7 61.4 61.7 Mar 29.0 67.4 3.6 25.3 62.7 62.2 Apr 32.1 65.8 2.1 30.1 65.0 64.7 May 33.3 62.4 4.3 29.0 64.5 63.9 Higher Same Lower Net Index S.Adj. % % % +/- Index Permanent Salaries Q.Areaverage salaries awarded tostaffplaced in permanent positions higher, the same or lower than one month ago? 2013 Nov 15.3 82.2 2.4 12.9 56.4 55.6 Dec 9.0 88.1 2.9 6.2 53.1 54.7 2014 Jan 14.9 81.6 3.5 11.4 55.7 55.0 Feb 15.4 82.1 2.5 13.0 56.5 56.7 Mar 12.9 83.9 3.2 9.7 54.8 54.6 Apr 13.3 85.4 1.3 12.0 56.0 56.5 May 18.6 76.9 4.5 14.2 57.1 57.2 Higher Same Lower Net Index S.Adj. % % % +/- Index Temporary/Contract Pay Rates Q. Are average hourly pay rates for temporary/contract staff higher, the same or lower than one month ago? 2001 2002 2003 2004 2005 2006 2007 2008 2009 2010 2011 2012 2013 -6 -3 0 3 6 9 Public sector Private sector Annual percent change Yr/yr % chg in average weekly earnings (3mma) 2011 2012 2013 Dec'13 Jan'14 Feb Mar Whole economy 2.4 1.4 1.2 1.2 1.4 1.7 1.7 Private sector 2.5 1.5 1.5 1.5 1.6 2.0 1.8 Public sector 2.5 1.3 0.9 0.3 0.5 0.9 0.7 Services 2.8 1.4 1.1 1.0 1.1 1.5 1.5 Manufacturing 1.6 1.8 2.2 2.6 3.2 3.2 2.9 Construction 0.9 0.9 0.0 1.0 2.9 3.2 2.9 UK average weekly earnings Data from the Office for National Statistics signalled that annual growth of employee earnings (including bonuses) held steady at 1.7% in the three months to March. Private sector pay growth remained stronger than that in the public sector.
- 8. Report on Jobs | Recruitment Industry Survey 7 Feature International comparisons KPMG LLP, a UK limited liability partnership, is a subsidiary of KPMG Europe LLP and operates from 22 offices across the UK with over 12,000 partners and staff. The UK firm recorded a turnover of £1.8 billion in the year ended September 2012. KPMG is a global network of professional firms providing Audit, Tax, and Advisory services. We operate in 156 countries and have 152,000 professionals working in member firms around the world. The independent member firms of the KPMG network are affiliated with KPMG International Cooperative (“KPMG International”), a Swiss entity. KPMG International provides no client services. The REC is the professional body representing the UK’s £24.6 billion private recruitment and staffingindustrywithmorethan8,000recruitment agencies and 6,000 recruitment consultants in membership. There are over 1 million temporary workers registered with UK agencies who are deployed in industry, commerce and the public services every day. is a leading global diversified provider of financial information services. We provide productsthatenhancetransparency,reduceriskandimproveoperational efficiency. Our customers include banks, hedge funds, asset managers, central banks, regulators, auditors, fund administrators and insurance companies. Founded in 2003, we employ over 3,000 people in 11 countries. For more information, please see www.markit.com. Recruitment Industry Survey The monthly survey features original research data collected via questionnaire by Markit from a panel of 400 UK recruitment and employment consultancies. In 2010/11, some 1,049,333 people were employed in either temporary or contract work through consultancies and 604,193 people were placed in permanent positions through consultancies. Monthly survey data were first collected in October 1997 and are collected in the end of each month, with respondents asked to specify the direction of change in a number of survey variables. Markit do not revise underlying survey data after first publication, but seasonal adjustment factors may be revised from time to time as appropriate which will affect the seasonally adjusted data series. The intellectual property rights to these data are owned by or licensed to MarkitEconomicsLimited.Anyunauthoriseduse,includingbutnotlimitedto copying, distributing, transmitting or otherwise of any data appearing is not permitted without Markit’s prior consent. The publication or release of any of these data prior to the general release time is an infringement of Markit Economics Limited’s intellectual property rights. Markit shall not have any liability, duty or obligation for or relating to the content or information (“data”) contained herein, any errors, inaccuracies, omissions or delays in the data, or for any actions taken in reliance thereon. In no event shall Markit be liable for any special, incidental, or consequential damages, arising out of the use of the data. Purchasing Managers’ Index® and PMI® are either registered trade marks of Markit Economics Limited or licensed to Markit Economics Limited. Markit is a registered trade mark of Markit Group Limited. UK unemployment rate in context The UK unemployment rate dropped to 6.8% in the first quarter of 2014, according to the latest figures from the Office for National Statistics. This compares favourably with the EU average of 10.5%. Spain continues to register by far the highest unemployment rate, at 25.3%. Unemployment rates in Italy and France remain in double- digits, at 12.7% and 10.4% respectively. The jobless rate in the Netherlands stands at 7.2%. Japan (3.6%), Austria (4.9%), Germany (5.1%) and the United States (6.3%) all have lower unemployment rates than the UK at present. All Intellectual Property Rights owned by Markit Economics Limited Sources: ONS, Eurostat, Bureau of Labor Statistics. Unemployment rates in selected countries 0 5 10 15 20 25 30 Japan Austria Germ any United States United Kingdom Netherlands France Total EU Italy Spain Unem ploym ent Rate %