SlideShare a Scribd company logo
1 of 8
Download to read offline
Slowest rise in permanent placements for
over two-and-a-half years
The Bank of Scotland Report on Jobs is
produced by Markit.
The report is designed to provide the
most up-to-date picture of labour market
trends in Scotland. The report is based on
a monthly questionnaire survey of around
100 recruitment and employment agencies
operating in Scotland.
The report uses an identical methodology to
the highly regarded UK survey of recruitment
consultancies conducted by Markit on behalf
of the REC and KPMG.
For further information please contact:
Bank of Scotland Press Office
The Mound
Edinburgh, EH1 1YZ.
Tel: 0131 655 5405
e-mail: ZoeRedhead@bankofscotland.co.uk
Markit Economics
Henley on Thames
Oxon, RG9 1HG, UK
Tel: +44 1491 461000
Fax: +44 1491 461001
Recruitment consultancies in Scotland recorded
only a marginal rise in permanent placements in
October, the weakest for more than two-and-a-half
years. The latest Bank of Scotland Report on Jobs
also showed the slowest growth in salaries since
August 2013. However, there were some positive
developments in the temporary jobs market, with
demand for contract workers rising at the strongest
rate so far in 2015 and growth in hourly pay rates
at a 20-month high.
Marginal rise in permanent placements
October saw a thirty-second straight monthly rise
in the number of people placed in permanent jobs
in Scotland. However, the latest increase was only
marginal and the slowest in this sequence. That
compared with a rebound in growth at the national
level from a 30-month low in September.
Growth in billings received from the employment
of temporary staff meanwhile eased to a moderate
pace, and one that was the slowest in three months
and below the UK average.
Salary growth eases to 26-month low
Scottish recruiters recorded a further slowdown
in the rate of growth in permanent salaries, the
fourth month running in which that has been the
case. Salary inflation in October was actually the
weakest since August 2013, falling just below the
long-run series average.
In contrast, hourly rates of pay for temporary
workers rose at a faster pace, the sharpest since
February 2014.
Demand for staff rises; candidate
availability falls
Demand for staff among Scottish businesses
continued to strengthen during October. In the case
of temporary staff, growth was in fact the fastest
seen so far in 2015. IT & Computing saw the most
marked increase in demand for permanent staff,
while Nursing/Medical/Care led growth in demand
for temporary workers. However, the number
of Blue Collar vacancies decreased during the
month.
Finally, October’s survey showed a further
deterioration in candidate availability in Scotland,
particularly those seeking permanent employment.
That said, the decline in candidate availability was
much slower than that seen at the UK level.
1	 Employment
2	 Vacancies
3	 Sectoral demand: perm
4	 Sectoral demand: temp
5	 Staff availability
6	 Pay pressures
7	 UK regional summary
The intellectual property rights to the Report on Jobs
for Scotland provided herein is owned by or licensed to
Markit. Any unauthorised use, including but not limited
to copying, distributing, transmitting or otherwise of
any data appearing is not permitted without Markit’s
prior consent. Markit shall not have any liability, duty or
obligation for or relating to the content or information
(“data”) contained herein, any errors, inaccuracies,
omissions or delays in the data, or for any actions taken
in reliance thereon. In no event shall Markit be liable
for any special, incidental, or consequential damages,
arising out of the use of the data. Markit is a registered
trade mark of Markit Group Limited.
Summary of survey indicators
35 40 45 50 55 60 65
Permanent placements
Index, 50 = no change on previous m onth
Decrease Increase
TEMPS
Demand for permanent staff
Permanent salaries
Availability of permanent staff
Temp billings
Demand for temporary staff
Temp pay rates
Availability of temporary staff
PERMANENT
DEMAND FOR PERMANENT STAFF
Types of staff ranked by strength of
demand in Scotland in October 2015
1	 IT & Computing
2	 Accounts & Financial
3	 Nursing/Medical/Care
4	 Hotel & Catering
5	 Engineering & Construction
6	 Secretarial & Clerical
7	 Executive & Professional
8	 Blue Collar
DEMAND FOR TEMP/CONTRACT STAFF
Types of staff ranked by strength of
demand in Scotland in October 2015
1	 Nursing/Medical/Care
2	 Hotel & Catering
3	 Secretarial & Clerical
4	 IT & Computing
5	 Engineering & Construction
6	 Accounts & Financial
7	 Executive & Professional
8	 Blue Collar
Bank of Scotland Report on Jobs
Key findings:
n Permanent appointments up only marginally as growth slows to 32-month low
n Salaries inflation eases to 26-month low; temp wage growth accelerates
n	 Candidate availability remains in decline, albeit falling at slower rate than UK average
November 2015
Latest data showed a slowdown in the
rate of growth in permanent placements
in Scotland. October’s rise in permanent
appointments was in fact the weakest seen
for more than two-and-a-half years and
only marginal overall.
In contrast, the UK as a whole saw a
rebound in growth of permanent placements
at the start of the fourth quarter, up from a
30-month low in September to the fastest
seen since June.
Employment
2003 2004 2005 2006 2007 2008 2009 2010 2011 2012 2013 2014 2015
25
30
35
40
45
50
55
60
65
70
Line: UK
ScotlandBars:
Increasing rate of decline
Increasing rate of growth
50	=	no	change	on	previous	month
2015	May	 38.0	 30.0	 32.0	 6.0	 53.0	 52.5	 55.1	 56.8
	 Jun	 40.0	 38.0	 22.0	 18.0	 59.0	 55.0	 59.1	 56.4
	 Jul	 41.2	 37.3	 21.6	 19.6	 59.8	 57.2	 55.4	 54.5
	 Aug	 26.5	 38.8	 34.7	 -8.2	 45.9	 52.4	 50.9	 54.2
	 Sep	 35.7	 32.1	 32.1	 3.6	 51.8	 52.6	 53.9	 52.3
	 Oct	 35.7	 32.1	 32.1	 3.6	 51.8	 50.4	 56.4	 55.2
	 	 Higher	 Same	 Lower	 Net	 Index	 S.Adj.	 Index	 S. Adj.	
	           	 %	 %	 %	 +/-	 50 = no chg	 Index	 50 = no chg	 Index
Scottish recruitment consultancies
recorded a rise in average weekly billings
from temporary staff in October, as has
been the case every month since February.
The rate of growth was moderate, having
eased further from August’s recent peak to
the slowest in three months.
For the first time since July, Scotland
saw a slower increase in temporary billings
than the UK as whole, for which growth
was at a three-month high during the latest
survey period.
1
2015	May	 28.2	 51.3	 20.5	 7.7	 53.8	 54.4	 59.6	 59.0
	 Jun	 38.5	 46.2	 15.4	 23.1	 61.5	 55.1	 62.4	 58.3
	 Jul	 39.0	 36.6	 24.4	 14.6	 57.3	 52.6	 60.7	 56.6
	 Aug	 44.1	 38.2	 17.6	 26.5	 63.2	 57.7	 53.2	 54.4
	 Sep	 36.4	 36.4	 27.3	 9.1	 54.5	 54.5	 54.1	 51.5
	 Oct	 39.1	 39.1	 21.7	 17.4	 58.7	 53.8	 57.4	 55.6
	 	 Higher	 Same	 Lower	 Net	 Index	 S.Adj.	 Index	 S. Adj.	
	           	 %	 %	 %	 +/-	 50 = no chg	 Index	 50 = no chg	 Index
2003 2004 2005 2006 2007 2008 2009 2010 2011 2012 2013 2014 2015
25
30
35
40
45
50
55
60
65
70
Line: UK
ScotlandBars:
Increasing rate of decline
Increasing rate of growth
50	=	no	change	on	previous	month
Marginal rise
in permanent
appointments.
Moderate growth in
temporary billings.
All Intellectual Property Rights owned by Markit	 	
All UKScotland
Permanent Staff Placements
Q. Is the number of people placed in permanent jobs higher, the same or lower than one month ago?
Temporary/Contract Staff Billings
Q. Are average weekly billings from temporary/contract staff higher, the same or lower than one month ago?
All UKScotland
Bank of Scotland Report on Jobs
The Vacancy Index, shown by the bars
in the chart on the right, is derived from
the sectoral indexes of the demand for
permanentstaffatrecruitmentconsultancies
(shown on page 4). The Permanent Staff
Vacancy Index is a weighted average of the
eight individual sector indexes. The line in
the chart shows the comparable index for
the UK as a whole.
October’s survey showed a further
rise in demand for permanent staff among
businesses north of the border. The rate
of growth eased to a three-month low, but
nevertheless remained strong overall, with
the corresponding seasonally adjusted
index still above its long-run series average
of 56.9.
Across the UK as a whole demand for
permanent staff increased sharply, with
the rate of growth little-changed from the
previous month and again faster than in
Scotland.
Scottish consultancies noted that the
strongest rise permanent job vacancies
was in IT & Computing, while the only
decrease was in Blue Collar.
Vacancies
2003 2004 2005 2006 2007 2008 2009 2010 2011 2012 2013 2014 2015
20
25
30
35
40
45
50
55
60
65
70
Line: UK
ScotlandBars:
Increasing rate of decline
Increasing rate of growth
50	=	no	change	on	previous	month
	 	 Index	 S.Adj.	 Index	 S. Adj.	
	 	 50 = no chg	 Index	 50 = no chg	 Index
2
2003 2004 2005 2006 2007 2008 2009 2010 2011 2012 2013 2014 2015
25
30
35
40
45
50
55
60
65
70
Line: UK
ScotlandBars:
Increasing rate of decline
Increasing rate of growth
50	=	no	change	on	previous	month
Slower, albeit still-
strong, growth in
permanent staff
demand.
Latest rise in temp
vacancies fastest for
ten months.
The Vacancy Index, shown by the bars
in the chart on the right, is derived from
the sectoral indexes of the demand for
temporary and contract staff (shown on
page 5). The Temporary Staff Vacancy Index
is a weighted average of the eight individual
sector indexes. The line in the chart shows
the comparable index for the UK overall.
Demand for temporary staff in Scotland
increased in October, in line with the
trend seen throughout the past six years.
Furthermore, having accelerated for the
fourth time in the past five months, the rate
of growth was strong and the fastest overall
since December 2014.
That said, the latest increase in
temporary vacancies in Scotland was less
marked than that seen at the UK level,
where growth quickened slightly from a 27-
month low in September.
Six of the eight jobs categories
monitored by the survey recorded higher
demand for temporary staff, the strongest
rises being in Nursing/Medical/Care and
Hotel & Catering respectively.
	 	 Index	 S.Adj.	 Index	 S. Adj.	
	 	 50 = no chg	 Index	 50 = no chg	 Index
2015	Apr	 59.2	 58.8	 65.9	 65.5
	 May	 57.8	 58.5	 61.2	 63.6
	 Jun	 60.3	 59.4	 66.3	 64.3
	 Jul	 49.8	 56.1	 64.6	 63.5
	 Aug	 60.7	 59.6	 63.3	 63.3
	 Sep	 63.0	 60.9	 62.5	 62.0
	 Oct	 52.6	 57.7	 62.0	 62.1
2015	Apr	 53.4	 54.3	 61.7	 63.6
	 May	 52.9	 54.3	 59.7	 61.2
	 Jun	 52.3	 55.4	 65.1	 62.2
	 Jul	 60.1	 56.6	 63.9	 61.8
	 Aug	 55.9	 56.2	 61.0	 60.4
	 Sep	 55.0	 56.6	 59.2	 59.1
	 Oct	 61.1	 57.0	 61.1	 59.7
Demand for Permanent Staff at recruitment/employment consultancies
Demand for Temporary/Contract Staff at recruitment/employment consultancies
All UKScotland
All UKScotland
	 November 2015
Sectoral demand – permanent
20
30
40
50
60
70
80
Blue	Collar
Scot
UK
2003 2004 2005 2006 2007 2008 2009 2010 2011 2012 2013 2014 2015
30
40
50
60
70
80
90 Nursing/Medical/Care
50	=		no	change	on	previous	month
UK
Scot
r Text Nov. 3, 2015 2:42:25 PM
20
30
40
50
60
70
80 Hotel	&	Catering
UK
Scot
20
30
40
50
60
70
80 Engineering	&	Construction
Scot
UK
sector was still much stronger than that seen
in the second-highest ranked sector (see
table), Accounts & Financial, where growth
picked up in October.
The only other categories that saw faster
increases in permanent job openings
were Hotel & Catering and Engineering
& Construction (ranked fourth and fifth
respectively), the rates of growth the sharpest
in six months in both cases.
Nursing/Medical/Care recorded a strong
rise in demand for permanent staff, but one
that was the weakest since May.
Modest increases in permanent vacancies
were registered in Secretarial & Clerical and
Executive & Professional. However, Blue
Collar saw a decrease for the fourth month
running.
3 Permanent vacancies	
Data below are derived from the monthly survey of recruitment consultancies in Scotland. Consultants are requested to
compare the demand for staff according to sector with the situation one month ago. Data are presented in the form of
diffusion indices whereby a reading of 50 indicates no change on the previous month. Readings above 50 signal stronger
demand than a month ago. Readings below 50 signal weaker demand than a month ago.
Demand for
permanent staff
grows fastest in IT &
Computing.
Further decrease in
Blue Collar vacancies.
May'15	 73.0	 64.6	 50.1	 66.4	 61.5	 65.3	 57.0	 63.2	 61.0	 67.3	 55.6	 56.0	 55.3	 62.5	 54.8	 57.8
Jun	 68.5	 64.5	 54.0	 65.9	 63.9	 64.7	 58.8	 62.8	 67.3	 70.2	 54.1	 56.5	 54.9	 62.1	 52.3	 59.9
Jul	 64.8	 62.6	 52.2	 65.3	 59.3	 64.5	 52.3	 61.3	 74.6	 69.9	 55.8	 55.4	 52.4	 63.4	 49.2	 58.9
Aug	 71.9	 64.1	 52.3	 64.9	 64.7	 66.4	 56.7	 61.5	 78.7	 70.1	 54.7	 55.8	 55.4	 65.0	 45.5	 58.8
Sep	 74.5	 63.2	 56.4	 63.8	 60.9	 65.7	 59.6	 60.8	 71.2	 64.9	 57.8	 52.9	 56.9	 65.0	 44.2	 54.0
Oct	 71.1	 64.3	 51.4	 62.7	 63.6	 66.4	 52.8	 61.5	 63.3	 63.5	 59.1	 51.8	 57.1	 63.2	 44.1	 54.2
	 IT &	 Executive &	 Accounts &	 Secretarial	 Nursing/	 Hotel &	 Engineering &	 Blue	
	 Computing	 Professional	 Financial	 & Clerical	 Medical/Care	 Catering	 Construction	 Collar	
	 Scot	 UK	 Scot	 UK	 Scot	 UK	 Scot	 UK	 Scot	 UK	 Scot	 UK	 Scot	 UK	 Scot	 UK
20
30
40
50
60
70
80
90 IT	&	Computing	
50	=		no	change	on	previous	month
UK
Scot
20
30
40
50
60
70
80
Executive	&	Professional
UK
Scot
20
30
40
50
60
70
80 Accounting	&	Financial
Scot
UK
20
30
40
50
60
70
80
Secretarial	&	Clerical
Scot
UK
2003 2004 2005 2006 2007 2008 2009 2010 2011 2012 2013 2014 2015
As was the case in the previous survey period,
demand for permanent staff rose in seven of
the eight jobs categories monitored, led by
strong growth in IT & Computing. Although
weaker than in September, the latest rise in
permanent vacancies in the IT & Computing
Sectors ranked by demand for permanent
staff in Scotland in October 2015
Rank	 Sector	 Index
1	 IT & Computing	 71.1
2	 Accounts & Financial	 63.6
3	 Nursing/Medical/Care	 63.3
4	 Hotel & Catering	 59.1
5	 Engineering & Construction	 57.1
6	 Secretarial & Clerical	 52.8
7	 Executive & Professional	 51.4
8	 Blue Collar	 44.1
All Intellectual Property Rights owned by Markit	 	
Demand for permanent staff (Seasonally adjusted, 50 = no change on previous month)	
Bank of Scotland Report on Jobs
Sectoral demand – temporary
20
30
40
50
60
70
80 Blue	Collar
Scot
UK
2003 2004 2005 2006 2007 2008 2009 2010 2011 2012 2013 2014 2015
20
30
40
50
60
70
80
90
100 Nursing/Medical/Care
50	=		no	change	on	previous	month
UK
Scot
30
40
50
60
70
80 Hotel	&	Catering
UK
Scot
20
30
40
50
60
70
80
Engineering	&	Construction
Scot
UK
The sharpest overall rise in demand for
temporary staff was in Nursing/Medical/Care,
where growth accelerated for the fourth month
running to the fastest since March.
Hotel & Catering and Secretarial &
Clerical, ranked second and third respectively
(see table), also recorded strong increases in
temporary vacancies that were faster than in
the previous month.
The rate of growth of temporary job
openings in IT & Computing (ranked fourth)
eased to the slowest since June, but
nevertheless remained marked and slightly
faster than in Engineering & Construction.
Executive & Professional and Blue Collar
were the only two areas that saw falls in temp
staff demand. In the case of the latter, the drop
was the second-fastest since January 2010.
4 Temporary/contract vacancies	
Data below are derived from the monthly survey of recruitment consultancies in Scotland. Consultants are requested to
compare the demand for staff according to sector with the situation one month ago. Data are presented in the form of diffusion
indices whereby a reading of 50 indicates no change on the previous month. Readings above 50 signal stronger demand than
a month ago. Readings below 50 signal weaker demand than a month ago.
Nursing/Medical/Care
sees strongest rise in
temp staff demand.
Solid drop in Blue
Collar temp openings.
May'15	 64.2	 60.4	 46.0	 59.9	 54.1	 60.2	 59.0	 61.9	 57.7	 66.6	 54.4	 58.3	 58.4	 60.9	 45.7	 61.5
Jun	 59.6	 60.3	 46.9	 59.2	 53.5	 60.6	 62.0	 61.8	 53.2	 68.9	 59.7	 58.0	 62.3	 60.8	 47.5	 61.4
Jul	 64.3	 59.4	 50.0	 58.2	 53.5	 60.8	 56.4	 61.1	 55.3	 67.0	 64.6	 57.9	 64.4	 62.7	 50.7	 60.3
Aug	 62.8	 59.1	 46.0	 56.2	 52.0	 61.1	 52.9	 59.8	 56.6	 68.0	 68.3	 61.3	 61.8	 62.8	 54.2	 60.4
Sep	 66.7	 59.1	 53.0	 54.8	 55.3	 59.7	 55.5	 59.4	 61.1	 64.6	 65.0	 58.0	 58.3	 61.0	 50.5	 58.6
Oct	 61.0	 60.3	 48.4	 54.1	 53.3	 59.8	 62.7	 60.3	 67.6	 64.2	 65.1	 60.6	 59.0	 57.8	 46.7	 59.4
	 IT &	 Executive &	 Accounts &	 Secretarial	 Nursing/	 Hotel &	 Engineering &	 Blue	
	 Computing	 Professional	 Financial	 & Clerical	 Medical/Care	 Catering	 Construction	 Collar	
	 Scot	 UK	 Scot	 UK	 Scot	 UK	 Scot	 UK	 Scot	 UK	 Scot	 UK	 Scot	 UK	 Scot	 UK
30
40
50
60
70
80
IT	&	Computing
50	=		no	change	on	previous	month
UK
Scot
20
30
40
50
60
70
Executive	&	Professional
UK
Scot
20
30
40
50
60
70
80 Accounting	&	Financial
Scot
UK
20
30
40
50
60
70
80
Secretarial	&	Clerical
Scot
UK
2003 2004 2005 2006 2007 2008 2009 2010 2011 2012 2013 2014 2015
Trends in temporary staff demand at the sector
level showed great variation in October, with
some categories seeing renewed falls in the
number of vacancies, while others recorded
strong growth, in some cases faster than in
September.
Sectors ranked by demand for temp/contract
staff in Scotland in October 2015
Rank	 Sector	 Index
1	 Nursing/Medical/Care	 67.6
2	 Hotel & Catering	 65.1
3	 Secretarial & Clerical	 62.7
4	 IT & Computing	 61.0
5	 Engineering & Construction	 59.0
6	 Accounts & Financial	 53.3
7	 Executive & Professional	 48.4
8	 Blue Collar	 46.7
Demand for temporary/contract staff (Seasonally adjusted, 50 = no change on previous month)
	 November 2015
October saw a further deterioration in the
availability of candidates for permanent
vacancies in Scotland. The degree to
which numbers decreased was sharp and
slightly more marked than in September.
Around 38% of consultancies recorded a fall
permanent candidate supply, versus 21%
that noted an improvement.
However, the reduction in permanent
candidate availability in Scotland was less
severe than across the UK as a whole, as
has been the case in each of the past five
months.
Staff availability
2003 2004 2005 2006 2007 2008 2009 2010 2011 2012 2013 2014 2015
20
25
30
35
40
45
50
55
60
65
70
75
80
85
90
Line: UK
ScotlandBars:
Deteriorating availability
Improving availability
50	=	no	change	on	previous	month
2015	May	 20.0	 30.0	 50.0	 -30.0	 35.0	 33.5	 34.5	 35.3
	 Jun	 14.3	 36.7	 49.0	 -34.7	 32.7	 36.7	 34.6	 36.4
	 Jul	 19.2	 44.2	 36.5	 -17.3	 41.3	 38.5	 31.5	 34.2
	 Aug	 21.3	 34.0	 44.7	 -23.4	 38.3	 43.9	 28.9	 32.0
	 Sep	 14.5	 52.7	 32.7	 -18.2	 40.9	 42.5	 36.7	 35.8
	 Oct	 21.4	 41.1	 37.5	 -16.1	 42.0	 42.0	 38.1	 37.3
	 	 Higher	 Same	 Lower	 Net	 Index	 S.Adj.	 Index	 S. Adj.	
	           	 %	 %	 %	 +/-	 50 = no chg	 Index	 50 = no chg	 Index
The availability of candidates for temporary
vacancies north of the border decreased
marginally in October. This was highlighted
by the corresponding seasonally adjusted
index registering just below the 50.0 no-
change mark, at its highest level in the
current 30-month sequence of falling
temporary candidate numbers.
At the UK level, the rate of deterioration
in temporary candidate availability was
sharp and slightly faster than that recorded
in the preceding survey period.
5
2015	May	 21.1	 34.2	 44.7	 -23.7	 38.2	 37.1	 38.0	 38.9
	 Jun	 12.2	 48.8	 39.0	 -26.8	 36.6	 37.6	 38.4	 39.4
	 Jul	 16.7	 42.9	 40.5	 -23.8	 38.1	 43.5	 38.7	 41.1
	 Aug	 17.6	 61.8	 20.6	 -2.9	 48.5	 48.5	 34.2	 38.5
	 Sep	 11.6	 58.1	 30.2	 -18.6	 40.7	 46.7	 39.7	 40.7
	 Oct	 26.7	 40.0	 33.3	 -6.7	 46.7	 48.9	 38.1	 40.2
	 	 Higher	 Same	 Lower	 Net	 Index	 S.Adj.	 Index	 S. Adj.	
	           	 %	 %	 %	 +/-	 50 = no chg	 Index	 50 = no chg	 Index
2003 2004 2005 2006 2007 2008 2009 2010 2011 2012 2013 2014 2015
30
35
40
45
50
55
60
65
70
75
80
85
90
Line: UK
ScotlandBars:
Deteriorating availability
Improving availability
50	=	no	change	on	previous	month
Further sharp drop in
permanent candidate
availabilty.
Temp candidate
supply drops only
slightly.
Q. Is the availability of candidates for permanent vacancies better, the same or worse than one month ago?
Q. Is the availability of candidates for temporary vacancies better, the same or worse than one month ago?
All Intellectual Property Rights owned by Markit	 	
Availability of Permanent Staff
Availability of Temporary/Contract Staff
All UKScotland
All UKScotland
Bank of Scotland Report on Jobs
Permanent salary inflation in Scotland
slowed further in October. Adjusted for the
influence of seasonal factors, the Permanent
Salaries Index fell for the fifth time in the past
six months and registered at its lowest level
since August 2013, albeit one that was still
indicative of a solid rate of pay growth.
The rise in permanent salaries north of
the border was much less marked than that
seen across the UK as a whole, where the
rate of inflation picked up slightly and was
comfortably faster than respective the long-
run average.
Pay pressures
2003 2004 2005 2006 2007 2008 2009 2010 2011 2012 2013 2014 2015
35
40
45
50
55
60
65
70
Line: UK
ScotlandBars:
Increasing rate of decline
Increasing rate of growth
50	=	no	change	on	previous	month
2015	May	 32.0	 62.0	 6.0	 26.0	 63.0	 61.4	 64.3	 63.7
	 Jun	 30.0	 64.0	 6.0	 24.0	 62.0	 62.0	 63.2	 62.7
	 Jul	 27.5	 60.8	 11.8	 15.7	 57.8	 58.8	 63.1	 61.4
	 Aug	 27.1	 60.4	 12.5	 14.6	 57.3	 56.8	 62.1	 61.8
	 Sep	 16.1	 76.8	 7.1	 8.9	 54.5	 55.7	 61.3	 60.9
	 Oct	 17.5	 71.9	 10.5	 7.0	 53.5	 55.1	 61.2	 61.5
	 	 Higher	 Same	 Lower	 Net	 Index	 S.Adj.	 Index	 S. Adj.	
	           	 %	 %	 %	 +/-	 50 = no chg	 Index	 50 = no chg	 Index
In contrast to the trend in permanent starting
salaries in Scotland, hourly rates of pay for
temporary staff increased at faster pace
during October. The extent to which temp
wages rose at the start of the fourth quarter
was in fact among the greatest seen since
the survey started in 2003.
Furthermore, the rate of growth was
faster than the UK average, marking the
third month running in which that has been
the case.At the UK level, temp wage inflation
was broadly unchanged from September’s
one-and-a-half year low.
6
2015	May	 31.6	 57.9	 10.5	 21.1	 60.5	 59.3	 55.4	 57.2
	 Jun	 15.0	 80.0	 5.0	 10.0	 55.0	 55.0	 56.2	 56.8
	 Jul	 21.4	 71.4	 7.1	 14.3	 57.1	 54.6	 57.9	 57.9
	 Aug	 30.6	 61.1	 8.3	 22.2	 61.1	 58.1	 56.7	 56.7
	 Sep	 20.5	 75.0	 4.5	 15.9	 58.0	 57.4	 56.6	 55.9
	 Oct	 31.1	 66.7	 2.2	 28.9	 64.4	 60.0	 58.5	 56.1
	 	 Higher	 Same	 Lower	 Net	 Index	 S.Adj.	 Index	 S. Adj.	
	           	 %	 %	 %	 +/-	 50 = no chg	 Index	 50 = no chg	 Index
2003 2004 2005 2006 2007 2008 2009 2010 2011 2012 2013 2014 2015
35
40
45
50
55
60
65
Line: UK
ScotlandBars:
Increasing rate of decline
Increasing rate of growth
50	=	no	change	on	previous	month
Salary inflation
continues to slow.
Temporary wages
surge higher.
Q. Are average salaries for permanent staff higher, the same or lower than one month ago?
Q. Are average hourly rates of pay for temporary and contract staff higher, the same or lower than one month ago?
Permanent Salaries
Temporary/Contract Staff Hourly Pay Rates
All UKScotland
All UKScotland
	 November 2015
7 UK regional summary
Latest figures from the ONS showed back-to-back increases
in the UK claimant count for the first time since June 2012.
September saw the number of people claiming Jobseeker’s
Allowance rise by 4,585, the largest gain in just under three
years. This took the overall claimant count to a three-month
high of 796,263. The claimant count rate* was unchanged at
2.3%, the same rate recorded in each month since March.
Regional breakdowns showed that the lowest claimant
count rate was in the South East of England (1.3%), while
the highest was in Northern Ireland (4.5%).
Scotland was one of only two regions (the other being the
North West) where the claimant count rose in September.
At 2.9%, it was the highest since February. The number of
people claiming Jobseeker’s Allowance north of the border
increased by 3,076, which was the largest monthly rise
since July 2011.
South East	 60	 1.3	 (1)
South West	 40	 1.4	 (2)
East of England	 50	 1.6	 (3)
London	 111	 1.9	 (4)
East Midlands	 49	 2.1	 (5)
West Midlands	 79	 2.7	 (6)
Scotland	 80	 2.9	 (7)
Yorks & Humberside	 81	 3.0	 (8)
NW & Merseyside	 115	 3.1	 (9)
Wales	 45	 3.1	 (9)
North East	 46	 3.8	 (11)
Northern Ireland	 41	 4.5	 (12)
United Kingdom	 796	 2.3	
	 	 	 Unemployment (Sep ’15)
Region	 ‘000s	 Rate (%)*	 Rank
Source: Department for Work & Pensions and National Statistics.
* As a percentage of Claimant Count + Workforce Jobs.
Survey methodology
The Bank of Scotland Survey
The Bank of Scotland survey of recruitment and employment
consultancies is based on information provided by a panel of 105
consultancies operating in Scotland. Data are collected monthly
and converted into a seasonally adjusted series. Markit do not
revise underlying survey data after first publication, but seasonal
adjustment factors may be revised from time to time as appropriate
which will affect the seasonally adjusted data series.
The information from the survey panel is also used in the
compilation of the REC monthly survey for the UK, which appears
in the monthly Report on Jobs and which uses an identical survey
methodology. (The contribution of the Scotland data to the UK data is
weighted to reflect Scotland’s share of the total labour market.)
The KPMG/REC UK Survey
The KPMG/REC monthly UK recruitment survey features original
research data from Markit, collected via questionnaire from a
panel of UK recruitment and employment consultancies. Data for
the monthly survey were first collected in October 1997 and are
collected at the end of each month, with respondents asked to
specify the direction of change in a number of survey variables.
Index numbers
Index numbers shown in the report are calculated from the
percentages of respondents reporting an improvement, no change
or decline. These indices vary between 0 and 100 with readings of
exactly 50.0 signalling no change on the previous month. Readings
above 50.0 signal an increase or improvement; readings below 50.0
signal a decline or deterioration.
Reasons given by survey respondents for any changes are
analysed to provide insight into the causes of movements in the
indices.
Bank of Scotland
Bank of Scotland is part of Lloyds Banking Group, the UK’ s largest
retail bank and Scotland’s largest financial services employer.
Established in 1695, Bank of Scotland is the UK’s oldest surviving
clearing bank.
Our goal is to be the best financial services provider in Scotland.
We believe this means we must build a leadership position not
on the basis of scale but on the foundations of reputation and
recommendation.
The Recruitment and Employment Confederation
The REC is the association for the UK’s £22.5 billion private
recruitment and staffing industry with more than 8,000 recruitment
agencies and 6,000 recruitment consultants in membership. There
are more than 1 million temporary workers registered with UK
agencies who are deployed in industry, commerce and the public
services every day.
Markit
Markit is a leading global diversified provider of financial information
services. We provide products that enhance transparency,
reduce risk and improve operational efficiency. Our customers
include banks, hedge funds, asset managers, central banks,
regulators, auditors, fund administrators and insurance companies.
Founded in 2003, we employ approximately 4,000 people in
11 countries. Markit shares are listed on NASDAQ under the
symbol MRKT. For more information, see www.markit.com.
About PMI
Purchasing Managers’ Index
®
(PMI
®
) surveys are now available for
over 30 countries and also for key regions including the Eurozone.
They are the most closely-watched business surveys in the world,
favoured by central banks, financial markets and business decision
makers for their ability to provide up-to-date, accurate and often
unique monthly indicators of economic trends. For more information
e-mail economics@markit.com.
Bank of Scotland, REC and Markit
All Intellectual Property Rights owned by Markit	 	
Bank of Scotland Report on Jobs

More Related Content

What's hot

Uk job market update - Demand for staff rises at strongest
Uk job market update - Demand for staff rises at strongestUk job market update - Demand for staff rises at strongest
Uk job market update - Demand for staff rises at strongestSteven Jagger
 
December report on Permanent and temporary jobs - Permanent placements rise a...
December report on Permanent and temporary jobs - Permanent placements rise a...December report on Permanent and temporary jobs - Permanent placements rise a...
December report on Permanent and temporary jobs - Permanent placements rise a...Steven Jagger
 
Ulster Bank NI PMI Slide Pack, April 2013
Ulster Bank NI PMI Slide Pack, April 2013Ulster Bank NI PMI Slide Pack, April 2013
Ulster Bank NI PMI Slide Pack, April 2013Richard Ramsey
 
Steven Jagger - June report on jobs
Steven Jagger - June report on jobsSteven Jagger - June report on jobs
Steven Jagger - June report on jobsSteven Jagger
 
Steven Jagger ReThink 0161 819 7545 report on jobs
Steven Jagger ReThink 0161 819 7545 report on jobsSteven Jagger ReThink 0161 819 7545 report on jobs
Steven Jagger ReThink 0161 819 7545 report on jobsSteven Jagger
 
Ulster Bank PMI Slide Pack
Ulster Bank PMI Slide PackUlster Bank PMI Slide Pack
Ulster Bank PMI Slide PackRichard Ramsey
 
Finnish technology industry statistics, August 2015
Finnish technology industry statistics, August 2015Finnish technology industry statistics, August 2015
Finnish technology industry statistics, August 2015TechFinland
 
Ulster Bank Northern Ireland PMI report September 2013
Ulster Bank Northern Ireland PMI report September 2013Ulster Bank Northern Ireland PMI report September 2013
Ulster Bank Northern Ireland PMI report September 2013Richard Ramsey
 
The anatomy of UK labour productivity: lessons from new and existing data sou...
The anatomy of UK labour productivity: lessons from new and existing data sou...The anatomy of UK labour productivity: lessons from new and existing data sou...
The anatomy of UK labour productivity: lessons from new and existing data sou...Office for National Statistics
 
Colliers International - Labour force riddle
Colliers International - Labour force riddleColliers International - Labour force riddle
Colliers International - Labour force riddleJuliane Priesemeister
 
London branches policy meeting presentation
London branches policy meeting presentationLondon branches policy meeting presentation
London branches policy meeting presentationMark Beatson
 
Recent labour market developments and reforms in OECD countries
Recent labour market developments and reforms in OECD countriesRecent labour market developments and reforms in OECD countries
Recent labour market developments and reforms in OECD countriesRockwool Fonden
 
Ulster Bank NI PMI Slidepack
Ulster Bank NI PMI SlidepackUlster Bank NI PMI Slidepack
Ulster Bank NI PMI SlidepackRichard Ramsey
 
Slide pack, Ulster Bank NI PMI, June 2014
Slide pack, Ulster Bank NI PMI, June 2014Slide pack, Ulster Bank NI PMI, June 2014
Slide pack, Ulster Bank NI PMI, June 2014Richard Ramsey
 
Northern Ireland Labour Market Slide Pack - December 2013
Northern Ireland Labour Market Slide Pack - December 2013Northern Ireland Labour Market Slide Pack - December 2013
Northern Ireland Labour Market Slide Pack - December 2013Richard Ramsey
 
Ulster Bank NI PMI report February 2014
Ulster Bank NI PMI report February 2014Ulster Bank NI PMI report February 2014
Ulster Bank NI PMI report February 2014Richard Ramsey
 
Slide pack for the Ulster Bank Northern Ireland PMI, October 2014
Slide pack for the Ulster Bank Northern Ireland PMI, October 2014Slide pack for the Ulster Bank Northern Ireland PMI, October 2014
Slide pack for the Ulster Bank Northern Ireland PMI, October 2014Richard Ramsey
 
Cyclical trend of labor reallocation: transition and structural change
Cyclical trend of labor reallocation:  transition and structural change Cyclical trend of labor reallocation:  transition and structural change
Cyclical trend of labor reallocation: transition and structural change GRAPE
 

What's hot (20)

Uk job market update - Demand for staff rises at strongest
Uk job market update - Demand for staff rises at strongestUk job market update - Demand for staff rises at strongest
Uk job market update - Demand for staff rises at strongest
 
December report on Permanent and temporary jobs - Permanent placements rise a...
December report on Permanent and temporary jobs - Permanent placements rise a...December report on Permanent and temporary jobs - Permanent placements rise a...
December report on Permanent and temporary jobs - Permanent placements rise a...
 
Ulster Bank NI PMI Slide Pack, April 2013
Ulster Bank NI PMI Slide Pack, April 2013Ulster Bank NI PMI Slide Pack, April 2013
Ulster Bank NI PMI Slide Pack, April 2013
 
Steven Jagger - June report on jobs
Steven Jagger - June report on jobsSteven Jagger - June report on jobs
Steven Jagger - June report on jobs
 
Ags Ed7 English
Ags Ed7 EnglishAgs Ed7 English
Ags Ed7 English
 
Steven Jagger ReThink 0161 819 7545 report on jobs
Steven Jagger ReThink 0161 819 7545 report on jobsSteven Jagger ReThink 0161 819 7545 report on jobs
Steven Jagger ReThink 0161 819 7545 report on jobs
 
Ulster Bank PMI Slide Pack
Ulster Bank PMI Slide PackUlster Bank PMI Slide Pack
Ulster Bank PMI Slide Pack
 
Finnish technology industry statistics, August 2015
Finnish technology industry statistics, August 2015Finnish technology industry statistics, August 2015
Finnish technology industry statistics, August 2015
 
Ulster Bank Northern Ireland PMI report September 2013
Ulster Bank Northern Ireland PMI report September 2013Ulster Bank Northern Ireland PMI report September 2013
Ulster Bank Northern Ireland PMI report September 2013
 
The anatomy of UK labour productivity: lessons from new and existing data sou...
The anatomy of UK labour productivity: lessons from new and existing data sou...The anatomy of UK labour productivity: lessons from new and existing data sou...
The anatomy of UK labour productivity: lessons from new and existing data sou...
 
Colliers International - Labour force riddle
Colliers International - Labour force riddleColliers International - Labour force riddle
Colliers International - Labour force riddle
 
London branches policy meeting presentation
London branches policy meeting presentationLondon branches policy meeting presentation
London branches policy meeting presentation
 
Recent labour market developments and reforms in OECD countries
Recent labour market developments and reforms in OECD countriesRecent labour market developments and reforms in OECD countries
Recent labour market developments and reforms in OECD countries
 
Ulster Bank NI PMI Slidepack
Ulster Bank NI PMI SlidepackUlster Bank NI PMI Slidepack
Ulster Bank NI PMI Slidepack
 
Slide pack, Ulster Bank NI PMI, June 2014
Slide pack, Ulster Bank NI PMI, June 2014Slide pack, Ulster Bank NI PMI, June 2014
Slide pack, Ulster Bank NI PMI, June 2014
 
Northern Ireland Labour Market Slide Pack - December 2013
Northern Ireland Labour Market Slide Pack - December 2013Northern Ireland Labour Market Slide Pack - December 2013
Northern Ireland Labour Market Slide Pack - December 2013
 
MEOS Q315
MEOS Q315MEOS Q315
MEOS Q315
 
Ulster Bank NI PMI report February 2014
Ulster Bank NI PMI report February 2014Ulster Bank NI PMI report February 2014
Ulster Bank NI PMI report February 2014
 
Slide pack for the Ulster Bank Northern Ireland PMI, October 2014
Slide pack for the Ulster Bank Northern Ireland PMI, October 2014Slide pack for the Ulster Bank Northern Ireland PMI, October 2014
Slide pack for the Ulster Bank Northern Ireland PMI, October 2014
 
Cyclical trend of labor reallocation: transition and structural change
Cyclical trend of labor reallocation:  transition and structural change Cyclical trend of labor reallocation:  transition and structural change
Cyclical trend of labor reallocation: transition and structural change
 

Viewers also liked

Identificación de epitelio y partes Nº 2
Identificación de epitelio y partes Nº 2Identificación de epitelio y partes Nº 2
Identificación de epitelio y partes Nº 2joshua delgado
 
Assignment 5
Assignment 5Assignment 5
Assignment 5mr_dink
 
Матеріали до уроку №42 з історії України для 8-А і 8-Г
Матеріали до уроку №42 з історії України для 8-А і 8-ГМатеріали до уроку №42 з історії України для 8-А і 8-Г
Матеріали до уроку №42 з історії України для 8-А і 8-ГНадежда Бедикян
 
06.06 2grammaandspellingcorrected
06.06 2grammaandspellingcorrected06.06 2grammaandspellingcorrected
06.06 2grammaandspellingcorrectedDanniManley
 
Front Cover and Contents Page
Front Cover and Contents PageFront Cover and Contents Page
Front Cover and Contents PageAmelliaS
 
Electronica analogica iii contenido
Electronica analogica iii contenidoElectronica analogica iii contenido
Electronica analogica iii contenidoOscar Novodvoretz
 

Viewers also liked (11)

20 Common Ports
20 Common Ports20 Common Ports
20 Common Ports
 
Computing
ComputingComputing
Computing
 
La cultura
La culturaLa cultura
La cultura
 
Identificación de epitelio y partes Nº 2
Identificación de epitelio y partes Nº 2Identificación de epitelio y partes Nº 2
Identificación de epitelio y partes Nº 2
 
Assignment 5
Assignment 5Assignment 5
Assignment 5
 
Матеріали до уроку №42 з історії України для 8-А і 8-Г
Матеріали до уроку №42 з історії України для 8-А і 8-ГМатеріали до уроку №42 з історії України для 8-А і 8-Г
Матеріали до уроку №42 з історії України для 8-А і 8-Г
 
06.06 2grammaandspellingcorrected
06.06 2grammaandspellingcorrected06.06 2grammaandspellingcorrected
06.06 2grammaandspellingcorrected
 
Front Cover and Contents Page
Front Cover and Contents PageFront Cover and Contents Page
Front Cover and Contents Page
 
Friends Journal witness article 5-2011
Friends Journal witness article 5-2011Friends Journal witness article 5-2011
Friends Journal witness article 5-2011
 
Web 10
Web 10Web 10
Web 10
 
Electronica analogica iii contenido
Electronica analogica iii contenidoElectronica analogica iii contenido
Electronica analogica iii contenido
 

Similar to Report on jobs November 6th

Ulster Bank Northern Ireland PMI report, August 2014
Ulster Bank Northern Ireland PMI report, August 2014Ulster Bank Northern Ireland PMI report, August 2014
Ulster Bank Northern Ireland PMI report, August 2014Richard Ramsey
 
Ulster Bank NI PMI Slide pack September 2013
Ulster Bank NI PMI Slide pack September 2013Ulster Bank NI PMI Slide pack September 2013
Ulster Bank NI PMI Slide pack September 2013Richard Ramsey
 
Ulster Bank NI PMI, June 2014
Ulster Bank NI PMI, June 2014Ulster Bank NI PMI, June 2014
Ulster Bank NI PMI, June 2014Richard Ramsey
 
Slide pack re Ulster Bank NI PMI September 2014
Slide pack re Ulster Bank NI PMI September 2014Slide pack re Ulster Bank NI PMI September 2014
Slide pack re Ulster Bank NI PMI September 2014Richard Ramsey
 
Ulster Bank NI PMI - October 2013
Ulster Bank NI PMI - October 2013Ulster Bank NI PMI - October 2013
Ulster Bank NI PMI - October 2013Richard Ramsey
 
PwC’s new Golden Age Index – how well are countries harnessing the power of o...
PwC’s new Golden Age Index – how well are countries harnessing the power of o...PwC’s new Golden Age Index – how well are countries harnessing the power of o...
PwC’s new Golden Age Index – how well are countries harnessing the power of o...PwC
 
Etude PwC Golden Age Index (juin 2015)
Etude PwC Golden Age Index (juin 2015)Etude PwC Golden Age Index (juin 2015)
Etude PwC Golden Age Index (juin 2015)PwC France
 
Ulster Bank Northern Ireland Purchasing Managers Index (PMI) - November 2013
Ulster Bank Northern Ireland Purchasing Managers Index (PMI) - November 2013Ulster Bank Northern Ireland Purchasing Managers Index (PMI) - November 2013
Ulster Bank Northern Ireland Purchasing Managers Index (PMI) - November 2013Richard Ramsey
 
Slide pack, Ulster Bank Northern Ireland PMI, August 2014
Slide pack, Ulster Bank Northern Ireland PMI, August 2014Slide pack, Ulster Bank Northern Ireland PMI, August 2014
Slide pack, Ulster Bank Northern Ireland PMI, August 2014Richard Ramsey
 
Slide pack , Ulster Bank Northern Ireland PMI, March 2015
Slide pack , Ulster Bank Northern Ireland PMI, March 2015Slide pack , Ulster Bank Northern Ireland PMI, March 2015
Slide pack , Ulster Bank Northern Ireland PMI, March 2015Richard Ramsey
 
Presentation to the Causeway Chamber of Commerce
Presentation to the Causeway Chamber of CommercePresentation to the Causeway Chamber of Commerce
Presentation to the Causeway Chamber of CommerceRichard Ramsey
 
Slide pack, Ulster Bank Northern Ireland PMI, December 2013
Slide pack, Ulster Bank Northern Ireland PMI, December 2013Slide pack, Ulster Bank Northern Ireland PMI, December 2013
Slide pack, Ulster Bank Northern Ireland PMI, December 2013Richard Ramsey
 
Slide pack , Ulster Bank Northern Ireland PMI, December 2014
Slide pack , Ulster Bank Northern Ireland PMI, December 2014Slide pack , Ulster Bank Northern Ireland PMI, December 2014
Slide pack , Ulster Bank Northern Ireland PMI, December 2014Richard Ramsey
 
20150714 pmi slide_pack_june_2015
20150714 pmi slide_pack_june_201520150714 pmi slide_pack_june_2015
20150714 pmi slide_pack_june_2015Richard Ramsey
 
Presentation to jelf employee benefits seminar 13 july 2015
Presentation to jelf employee benefits seminar 13 july 2015Presentation to jelf employee benefits seminar 13 july 2015
Presentation to jelf employee benefits seminar 13 july 2015Mark Beatson
 
Ulster Bank Northern Ireland Purchasing Managers Index (PMI) January 2017
Ulster Bank Northern Ireland Purchasing Managers Index (PMI) January 2017Ulster Bank Northern Ireland Purchasing Managers Index (PMI) January 2017
Ulster Bank Northern Ireland Purchasing Managers Index (PMI) January 2017Richard Ramsey
 
Slide pack for the Ulster Bank Northern Ireland PMI, May 2015
Slide pack for the Ulster Bank Northern Ireland PMI, May 2015Slide pack for the Ulster Bank Northern Ireland PMI, May 2015
Slide pack for the Ulster Bank Northern Ireland PMI, May 2015Richard Ramsey
 
Slide Pack, Ulster Bank NI PMI, May 2014
Slide Pack, Ulster Bank NI PMI, May 2014Slide Pack, Ulster Bank NI PMI, May 2014
Slide Pack, Ulster Bank NI PMI, May 2014Richard Ramsey
 
Slide pack, Ulster Bank Northern Ireland PMI, February 2015
Slide pack, Ulster Bank Northern Ireland PMI, February 2015Slide pack, Ulster Bank Northern Ireland PMI, February 2015
Slide pack, Ulster Bank Northern Ireland PMI, February 2015Richard Ramsey
 

Similar to Report on jobs November 6th (20)

Ulster Bank Northern Ireland PMI report, August 2014
Ulster Bank Northern Ireland PMI report, August 2014Ulster Bank Northern Ireland PMI report, August 2014
Ulster Bank Northern Ireland PMI report, August 2014
 
Ulster Bank NI PMI Slide pack September 2013
Ulster Bank NI PMI Slide pack September 2013Ulster Bank NI PMI Slide pack September 2013
Ulster Bank NI PMI Slide pack September 2013
 
Ulster Bank NI PMI, June 2014
Ulster Bank NI PMI, June 2014Ulster Bank NI PMI, June 2014
Ulster Bank NI PMI, June 2014
 
Slide pack re Ulster Bank NI PMI September 2014
Slide pack re Ulster Bank NI PMI September 2014Slide pack re Ulster Bank NI PMI September 2014
Slide pack re Ulster Bank NI PMI September 2014
 
Ulster Bank NI PMI - October 2013
Ulster Bank NI PMI - October 2013Ulster Bank NI PMI - October 2013
Ulster Bank NI PMI - October 2013
 
PwC’s new Golden Age Index – how well are countries harnessing the power of o...
PwC’s new Golden Age Index – how well are countries harnessing the power of o...PwC’s new Golden Age Index – how well are countries harnessing the power of o...
PwC’s new Golden Age Index – how well are countries harnessing the power of o...
 
Etude PwC Golden Age Index (juin 2015)
Etude PwC Golden Age Index (juin 2015)Etude PwC Golden Age Index (juin 2015)
Etude PwC Golden Age Index (juin 2015)
 
Ulster Bank Northern Ireland Purchasing Managers Index (PMI) - November 2013
Ulster Bank Northern Ireland Purchasing Managers Index (PMI) - November 2013Ulster Bank Northern Ireland Purchasing Managers Index (PMI) - November 2013
Ulster Bank Northern Ireland Purchasing Managers Index (PMI) - November 2013
 
Slide pack, Ulster Bank Northern Ireland PMI, August 2014
Slide pack, Ulster Bank Northern Ireland PMI, August 2014Slide pack, Ulster Bank Northern Ireland PMI, August 2014
Slide pack, Ulster Bank Northern Ireland PMI, August 2014
 
Slide pack , Ulster Bank Northern Ireland PMI, March 2015
Slide pack , Ulster Bank Northern Ireland PMI, March 2015Slide pack , Ulster Bank Northern Ireland PMI, March 2015
Slide pack , Ulster Bank Northern Ireland PMI, March 2015
 
Presentation to the Causeway Chamber of Commerce
Presentation to the Causeway Chamber of CommercePresentation to the Causeway Chamber of Commerce
Presentation to the Causeway Chamber of Commerce
 
State of the Economy
State of the EconomyState of the Economy
State of the Economy
 
Slide pack, Ulster Bank Northern Ireland PMI, December 2013
Slide pack, Ulster Bank Northern Ireland PMI, December 2013Slide pack, Ulster Bank Northern Ireland PMI, December 2013
Slide pack, Ulster Bank Northern Ireland PMI, December 2013
 
Slide pack , Ulster Bank Northern Ireland PMI, December 2014
Slide pack , Ulster Bank Northern Ireland PMI, December 2014Slide pack , Ulster Bank Northern Ireland PMI, December 2014
Slide pack , Ulster Bank Northern Ireland PMI, December 2014
 
20150714 pmi slide_pack_june_2015
20150714 pmi slide_pack_june_201520150714 pmi slide_pack_june_2015
20150714 pmi slide_pack_june_2015
 
Presentation to jelf employee benefits seminar 13 july 2015
Presentation to jelf employee benefits seminar 13 july 2015Presentation to jelf employee benefits seminar 13 july 2015
Presentation to jelf employee benefits seminar 13 july 2015
 
Ulster Bank Northern Ireland Purchasing Managers Index (PMI) January 2017
Ulster Bank Northern Ireland Purchasing Managers Index (PMI) January 2017Ulster Bank Northern Ireland Purchasing Managers Index (PMI) January 2017
Ulster Bank Northern Ireland Purchasing Managers Index (PMI) January 2017
 
Slide pack for the Ulster Bank Northern Ireland PMI, May 2015
Slide pack for the Ulster Bank Northern Ireland PMI, May 2015Slide pack for the Ulster Bank Northern Ireland PMI, May 2015
Slide pack for the Ulster Bank Northern Ireland PMI, May 2015
 
Slide Pack, Ulster Bank NI PMI, May 2014
Slide Pack, Ulster Bank NI PMI, May 2014Slide Pack, Ulster Bank NI PMI, May 2014
Slide Pack, Ulster Bank NI PMI, May 2014
 
Slide pack, Ulster Bank Northern Ireland PMI, February 2015
Slide pack, Ulster Bank Northern Ireland PMI, February 2015Slide pack, Ulster Bank Northern Ireland PMI, February 2015
Slide pack, Ulster Bank Northern Ireland PMI, February 2015
 

Recently uploaded

Call Girls In Dwarka 9654467111 Escorts Service
Call Girls In Dwarka 9654467111 Escorts ServiceCall Girls In Dwarka 9654467111 Escorts Service
Call Girls In Dwarka 9654467111 Escorts ServiceSapana Sha
 
Predicting Salary Using Data Science: A Comprehensive Analysis.pdf
Predicting Salary Using Data Science: A Comprehensive Analysis.pdfPredicting Salary Using Data Science: A Comprehensive Analysis.pdf
Predicting Salary Using Data Science: A Comprehensive Analysis.pdfBoston Institute of Analytics
 
Top 5 Best Data Analytics Courses In Queens
Top 5 Best Data Analytics Courses In QueensTop 5 Best Data Analytics Courses In Queens
Top 5 Best Data Analytics Courses In Queensdataanalyticsqueen03
 
Call Us ➥97111√47426🤳Call Girls in Aerocity (Delhi NCR)
Call Us ➥97111√47426🤳Call Girls in Aerocity (Delhi NCR)Call Us ➥97111√47426🤳Call Girls in Aerocity (Delhi NCR)
Call Us ➥97111√47426🤳Call Girls in Aerocity (Delhi NCR)jennyeacort
 
GA4 Without Cookies [Measure Camp AMS]
GA4 Without Cookies [Measure Camp AMS]GA4 Without Cookies [Measure Camp AMS]
GA4 Without Cookies [Measure Camp AMS]📊 Markus Baersch
 
Call Girls in Defence Colony Delhi 💯Call Us 🔝8264348440🔝
Call Girls in Defence Colony Delhi 💯Call Us 🔝8264348440🔝Call Girls in Defence Colony Delhi 💯Call Us 🔝8264348440🔝
Call Girls in Defence Colony Delhi 💯Call Us 🔝8264348440🔝soniya singh
 
Industrialised data - the key to AI success.pdf
Industrialised data - the key to AI success.pdfIndustrialised data - the key to AI success.pdf
Industrialised data - the key to AI success.pdfLars Albertsson
 
NLP Data Science Project Presentation:Predicting Heart Disease with NLP Data ...
NLP Data Science Project Presentation:Predicting Heart Disease with NLP Data ...NLP Data Science Project Presentation:Predicting Heart Disease with NLP Data ...
NLP Data Science Project Presentation:Predicting Heart Disease with NLP Data ...Boston Institute of Analytics
 
Saket, (-DELHI )+91-9654467111-(=)CHEAP Call Girls in Escorts Service Saket C...
Saket, (-DELHI )+91-9654467111-(=)CHEAP Call Girls in Escorts Service Saket C...Saket, (-DELHI )+91-9654467111-(=)CHEAP Call Girls in Escorts Service Saket C...
Saket, (-DELHI )+91-9654467111-(=)CHEAP Call Girls in Escorts Service Saket C...Sapana Sha
 
dokumen.tips_chapter-4-transient-heat-conduction-mehmet-kanoglu.ppt
dokumen.tips_chapter-4-transient-heat-conduction-mehmet-kanoglu.pptdokumen.tips_chapter-4-transient-heat-conduction-mehmet-kanoglu.ppt
dokumen.tips_chapter-4-transient-heat-conduction-mehmet-kanoglu.pptSonatrach
 
DBA Basics: Getting Started with Performance Tuning.pdf
DBA Basics: Getting Started with Performance Tuning.pdfDBA Basics: Getting Started with Performance Tuning.pdf
DBA Basics: Getting Started with Performance Tuning.pdfJohn Sterrett
 
Customer Service Analytics - Make Sense of All Your Data.pptx
Customer Service Analytics - Make Sense of All Your Data.pptxCustomer Service Analytics - Make Sense of All Your Data.pptx
Customer Service Analytics - Make Sense of All Your Data.pptxEmmanuel Dauda
 
9711147426✨Call In girls Gurgaon Sector 31. SCO 25 escort service
9711147426✨Call In girls Gurgaon Sector 31. SCO 25 escort service9711147426✨Call In girls Gurgaon Sector 31. SCO 25 escort service
9711147426✨Call In girls Gurgaon Sector 31. SCO 25 escort servicejennyeacort
 
办理(Vancouver毕业证书)加拿大温哥华岛大学毕业证成绩单原版一比一
办理(Vancouver毕业证书)加拿大温哥华岛大学毕业证成绩单原版一比一办理(Vancouver毕业证书)加拿大温哥华岛大学毕业证成绩单原版一比一
办理(Vancouver毕业证书)加拿大温哥华岛大学毕业证成绩单原版一比一F La
 
Amazon TQM (2) Amazon TQM (2)Amazon TQM (2).pptx
Amazon TQM (2) Amazon TQM (2)Amazon TQM (2).pptxAmazon TQM (2) Amazon TQM (2)Amazon TQM (2).pptx
Amazon TQM (2) Amazon TQM (2)Amazon TQM (2).pptxAbdelrhman abooda
 
Indian Call Girls in Abu Dhabi O5286O24O8 Call Girls in Abu Dhabi By Independ...
Indian Call Girls in Abu Dhabi O5286O24O8 Call Girls in Abu Dhabi By Independ...Indian Call Girls in Abu Dhabi O5286O24O8 Call Girls in Abu Dhabi By Independ...
Indian Call Girls in Abu Dhabi O5286O24O8 Call Girls in Abu Dhabi By Independ...dajasot375
 
办美国阿肯色大学小石城分校毕业证成绩单pdf电子版制作修改#真实留信入库#永久存档#真实可查#diploma#degree
办美国阿肯色大学小石城分校毕业证成绩单pdf电子版制作修改#真实留信入库#永久存档#真实可查#diploma#degree办美国阿肯色大学小石城分校毕业证成绩单pdf电子版制作修改#真实留信入库#永久存档#真实可查#diploma#degree
办美国阿肯色大学小石城分校毕业证成绩单pdf电子版制作修改#真实留信入库#永久存档#真实可查#diploma#degreeyuu sss
 
Beautiful Sapna Vip Call Girls Hauz Khas 9711199012 Call /Whatsapps
Beautiful Sapna Vip  Call Girls Hauz Khas 9711199012 Call /WhatsappsBeautiful Sapna Vip  Call Girls Hauz Khas 9711199012 Call /Whatsapps
Beautiful Sapna Vip Call Girls Hauz Khas 9711199012 Call /Whatsappssapnasaifi408
 

Recently uploaded (20)

Call Girls In Dwarka 9654467111 Escorts Service
Call Girls In Dwarka 9654467111 Escorts ServiceCall Girls In Dwarka 9654467111 Escorts Service
Call Girls In Dwarka 9654467111 Escorts Service
 
Predicting Salary Using Data Science: A Comprehensive Analysis.pdf
Predicting Salary Using Data Science: A Comprehensive Analysis.pdfPredicting Salary Using Data Science: A Comprehensive Analysis.pdf
Predicting Salary Using Data Science: A Comprehensive Analysis.pdf
 
E-Commerce Order PredictionShraddha Kamble.pptx
E-Commerce Order PredictionShraddha Kamble.pptxE-Commerce Order PredictionShraddha Kamble.pptx
E-Commerce Order PredictionShraddha Kamble.pptx
 
Top 5 Best Data Analytics Courses In Queens
Top 5 Best Data Analytics Courses In QueensTop 5 Best Data Analytics Courses In Queens
Top 5 Best Data Analytics Courses In Queens
 
Call Us ➥97111√47426🤳Call Girls in Aerocity (Delhi NCR)
Call Us ➥97111√47426🤳Call Girls in Aerocity (Delhi NCR)Call Us ➥97111√47426🤳Call Girls in Aerocity (Delhi NCR)
Call Us ➥97111√47426🤳Call Girls in Aerocity (Delhi NCR)
 
GA4 Without Cookies [Measure Camp AMS]
GA4 Without Cookies [Measure Camp AMS]GA4 Without Cookies [Measure Camp AMS]
GA4 Without Cookies [Measure Camp AMS]
 
Call Girls in Defence Colony Delhi 💯Call Us 🔝8264348440🔝
Call Girls in Defence Colony Delhi 💯Call Us 🔝8264348440🔝Call Girls in Defence Colony Delhi 💯Call Us 🔝8264348440🔝
Call Girls in Defence Colony Delhi 💯Call Us 🔝8264348440🔝
 
Industrialised data - the key to AI success.pdf
Industrialised data - the key to AI success.pdfIndustrialised data - the key to AI success.pdf
Industrialised data - the key to AI success.pdf
 
NLP Data Science Project Presentation:Predicting Heart Disease with NLP Data ...
NLP Data Science Project Presentation:Predicting Heart Disease with NLP Data ...NLP Data Science Project Presentation:Predicting Heart Disease with NLP Data ...
NLP Data Science Project Presentation:Predicting Heart Disease with NLP Data ...
 
Saket, (-DELHI )+91-9654467111-(=)CHEAP Call Girls in Escorts Service Saket C...
Saket, (-DELHI )+91-9654467111-(=)CHEAP Call Girls in Escorts Service Saket C...Saket, (-DELHI )+91-9654467111-(=)CHEAP Call Girls in Escorts Service Saket C...
Saket, (-DELHI )+91-9654467111-(=)CHEAP Call Girls in Escorts Service Saket C...
 
dokumen.tips_chapter-4-transient-heat-conduction-mehmet-kanoglu.ppt
dokumen.tips_chapter-4-transient-heat-conduction-mehmet-kanoglu.pptdokumen.tips_chapter-4-transient-heat-conduction-mehmet-kanoglu.ppt
dokumen.tips_chapter-4-transient-heat-conduction-mehmet-kanoglu.ppt
 
Deep Generative Learning for All - The Gen AI Hype (Spring 2024)
Deep Generative Learning for All - The Gen AI Hype (Spring 2024)Deep Generative Learning for All - The Gen AI Hype (Spring 2024)
Deep Generative Learning for All - The Gen AI Hype (Spring 2024)
 
DBA Basics: Getting Started with Performance Tuning.pdf
DBA Basics: Getting Started with Performance Tuning.pdfDBA Basics: Getting Started with Performance Tuning.pdf
DBA Basics: Getting Started with Performance Tuning.pdf
 
Customer Service Analytics - Make Sense of All Your Data.pptx
Customer Service Analytics - Make Sense of All Your Data.pptxCustomer Service Analytics - Make Sense of All Your Data.pptx
Customer Service Analytics - Make Sense of All Your Data.pptx
 
9711147426✨Call In girls Gurgaon Sector 31. SCO 25 escort service
9711147426✨Call In girls Gurgaon Sector 31. SCO 25 escort service9711147426✨Call In girls Gurgaon Sector 31. SCO 25 escort service
9711147426✨Call In girls Gurgaon Sector 31. SCO 25 escort service
 
办理(Vancouver毕业证书)加拿大温哥华岛大学毕业证成绩单原版一比一
办理(Vancouver毕业证书)加拿大温哥华岛大学毕业证成绩单原版一比一办理(Vancouver毕业证书)加拿大温哥华岛大学毕业证成绩单原版一比一
办理(Vancouver毕业证书)加拿大温哥华岛大学毕业证成绩单原版一比一
 
Amazon TQM (2) Amazon TQM (2)Amazon TQM (2).pptx
Amazon TQM (2) Amazon TQM (2)Amazon TQM (2).pptxAmazon TQM (2) Amazon TQM (2)Amazon TQM (2).pptx
Amazon TQM (2) Amazon TQM (2)Amazon TQM (2).pptx
 
Indian Call Girls in Abu Dhabi O5286O24O8 Call Girls in Abu Dhabi By Independ...
Indian Call Girls in Abu Dhabi O5286O24O8 Call Girls in Abu Dhabi By Independ...Indian Call Girls in Abu Dhabi O5286O24O8 Call Girls in Abu Dhabi By Independ...
Indian Call Girls in Abu Dhabi O5286O24O8 Call Girls in Abu Dhabi By Independ...
 
办美国阿肯色大学小石城分校毕业证成绩单pdf电子版制作修改#真实留信入库#永久存档#真实可查#diploma#degree
办美国阿肯色大学小石城分校毕业证成绩单pdf电子版制作修改#真实留信入库#永久存档#真实可查#diploma#degree办美国阿肯色大学小石城分校毕业证成绩单pdf电子版制作修改#真实留信入库#永久存档#真实可查#diploma#degree
办美国阿肯色大学小石城分校毕业证成绩单pdf电子版制作修改#真实留信入库#永久存档#真实可查#diploma#degree
 
Beautiful Sapna Vip Call Girls Hauz Khas 9711199012 Call /Whatsapps
Beautiful Sapna Vip  Call Girls Hauz Khas 9711199012 Call /WhatsappsBeautiful Sapna Vip  Call Girls Hauz Khas 9711199012 Call /Whatsapps
Beautiful Sapna Vip Call Girls Hauz Khas 9711199012 Call /Whatsapps
 

Report on jobs November 6th

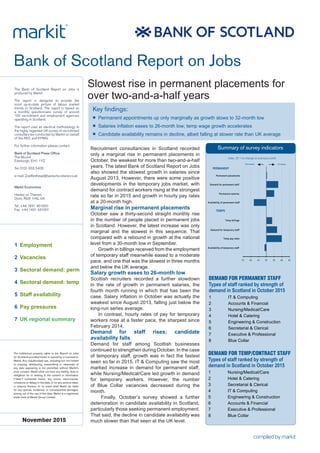
  • 1. Slowest rise in permanent placements for over two-and-a-half years The Bank of Scotland Report on Jobs is produced by Markit. The report is designed to provide the most up-to-date picture of labour market trends in Scotland. The report is based on a monthly questionnaire survey of around 100 recruitment and employment agencies operating in Scotland. The report uses an identical methodology to the highly regarded UK survey of recruitment consultancies conducted by Markit on behalf of the REC and KPMG. For further information please contact: Bank of Scotland Press Office The Mound Edinburgh, EH1 1YZ. Tel: 0131 655 5405 e-mail: ZoeRedhead@bankofscotland.co.uk Markit Economics Henley on Thames Oxon, RG9 1HG, UK Tel: +44 1491 461000 Fax: +44 1491 461001 Recruitment consultancies in Scotland recorded only a marginal rise in permanent placements in October, the weakest for more than two-and-a-half years. The latest Bank of Scotland Report on Jobs also showed the slowest growth in salaries since August 2013. However, there were some positive developments in the temporary jobs market, with demand for contract workers rising at the strongest rate so far in 2015 and growth in hourly pay rates at a 20-month high. Marginal rise in permanent placements October saw a thirty-second straight monthly rise in the number of people placed in permanent jobs in Scotland. However, the latest increase was only marginal and the slowest in this sequence. That compared with a rebound in growth at the national level from a 30-month low in September. Growth in billings received from the employment of temporary staff meanwhile eased to a moderate pace, and one that was the slowest in three months and below the UK average. Salary growth eases to 26-month low Scottish recruiters recorded a further slowdown in the rate of growth in permanent salaries, the fourth month running in which that has been the case. Salary inflation in October was actually the weakest since August 2013, falling just below the long-run series average. In contrast, hourly rates of pay for temporary workers rose at a faster pace, the sharpest since February 2014. Demand for staff rises; candidate availability falls Demand for staff among Scottish businesses continued to strengthen during October. In the case of temporary staff, growth was in fact the fastest seen so far in 2015. IT & Computing saw the most marked increase in demand for permanent staff, while Nursing/Medical/Care led growth in demand for temporary workers. However, the number of Blue Collar vacancies decreased during the month. Finally, October’s survey showed a further deterioration in candidate availability in Scotland, particularly those seeking permanent employment. That said, the decline in candidate availability was much slower than that seen at the UK level. 1 Employment 2 Vacancies 3 Sectoral demand: perm 4 Sectoral demand: temp 5 Staff availability 6 Pay pressures 7 UK regional summary The intellectual property rights to the Report on Jobs for Scotland provided herein is owned by or licensed to Markit. Any unauthorised use, including but not limited to copying, distributing, transmitting or otherwise of any data appearing is not permitted without Markit’s prior consent. Markit shall not have any liability, duty or obligation for or relating to the content or information (“data”) contained herein, any errors, inaccuracies, omissions or delays in the data, or for any actions taken in reliance thereon. In no event shall Markit be liable for any special, incidental, or consequential damages, arising out of the use of the data. Markit is a registered trade mark of Markit Group Limited. Summary of survey indicators 35 40 45 50 55 60 65 Permanent placements Index, 50 = no change on previous m onth Decrease Increase TEMPS Demand for permanent staff Permanent salaries Availability of permanent staff Temp billings Demand for temporary staff Temp pay rates Availability of temporary staff PERMANENT DEMAND FOR PERMANENT STAFF Types of staff ranked by strength of demand in Scotland in October 2015 1 IT & Computing 2 Accounts & Financial 3 Nursing/Medical/Care 4 Hotel & Catering 5 Engineering & Construction 6 Secretarial & Clerical 7 Executive & Professional 8 Blue Collar DEMAND FOR TEMP/CONTRACT STAFF Types of staff ranked by strength of demand in Scotland in October 2015 1 Nursing/Medical/Care 2 Hotel & Catering 3 Secretarial & Clerical 4 IT & Computing 5 Engineering & Construction 6 Accounts & Financial 7 Executive & Professional 8 Blue Collar Bank of Scotland Report on Jobs Key findings: n Permanent appointments up only marginally as growth slows to 32-month low n Salaries inflation eases to 26-month low; temp wage growth accelerates n Candidate availability remains in decline, albeit falling at slower rate than UK average November 2015
  • 2. Latest data showed a slowdown in the rate of growth in permanent placements in Scotland. October’s rise in permanent appointments was in fact the weakest seen for more than two-and-a-half years and only marginal overall. In contrast, the UK as a whole saw a rebound in growth of permanent placements at the start of the fourth quarter, up from a 30-month low in September to the fastest seen since June. Employment 2003 2004 2005 2006 2007 2008 2009 2010 2011 2012 2013 2014 2015 25 30 35 40 45 50 55 60 65 70 Line: UK ScotlandBars: Increasing rate of decline Increasing rate of growth 50 = no change on previous month 2015 May 38.0 30.0 32.0 6.0 53.0 52.5 55.1 56.8 Jun 40.0 38.0 22.0 18.0 59.0 55.0 59.1 56.4 Jul 41.2 37.3 21.6 19.6 59.8 57.2 55.4 54.5 Aug 26.5 38.8 34.7 -8.2 45.9 52.4 50.9 54.2 Sep 35.7 32.1 32.1 3.6 51.8 52.6 53.9 52.3 Oct 35.7 32.1 32.1 3.6 51.8 50.4 56.4 55.2 Higher Same Lower Net Index S.Adj. Index S. Adj. % % % +/- 50 = no chg Index 50 = no chg Index Scottish recruitment consultancies recorded a rise in average weekly billings from temporary staff in October, as has been the case every month since February. The rate of growth was moderate, having eased further from August’s recent peak to the slowest in three months. For the first time since July, Scotland saw a slower increase in temporary billings than the UK as whole, for which growth was at a three-month high during the latest survey period. 1 2015 May 28.2 51.3 20.5 7.7 53.8 54.4 59.6 59.0 Jun 38.5 46.2 15.4 23.1 61.5 55.1 62.4 58.3 Jul 39.0 36.6 24.4 14.6 57.3 52.6 60.7 56.6 Aug 44.1 38.2 17.6 26.5 63.2 57.7 53.2 54.4 Sep 36.4 36.4 27.3 9.1 54.5 54.5 54.1 51.5 Oct 39.1 39.1 21.7 17.4 58.7 53.8 57.4 55.6 Higher Same Lower Net Index S.Adj. Index S. Adj. % % % +/- 50 = no chg Index 50 = no chg Index 2003 2004 2005 2006 2007 2008 2009 2010 2011 2012 2013 2014 2015 25 30 35 40 45 50 55 60 65 70 Line: UK ScotlandBars: Increasing rate of decline Increasing rate of growth 50 = no change on previous month Marginal rise in permanent appointments. Moderate growth in temporary billings. All Intellectual Property Rights owned by Markit All UKScotland Permanent Staff Placements Q. Is the number of people placed in permanent jobs higher, the same or lower than one month ago? Temporary/Contract Staff Billings Q. Are average weekly billings from temporary/contract staff higher, the same or lower than one month ago? All UKScotland Bank of Scotland Report on Jobs
  • 3. The Vacancy Index, shown by the bars in the chart on the right, is derived from the sectoral indexes of the demand for permanentstaffatrecruitmentconsultancies (shown on page 4). The Permanent Staff Vacancy Index is a weighted average of the eight individual sector indexes. The line in the chart shows the comparable index for the UK as a whole. October’s survey showed a further rise in demand for permanent staff among businesses north of the border. The rate of growth eased to a three-month low, but nevertheless remained strong overall, with the corresponding seasonally adjusted index still above its long-run series average of 56.9. Across the UK as a whole demand for permanent staff increased sharply, with the rate of growth little-changed from the previous month and again faster than in Scotland. Scottish consultancies noted that the strongest rise permanent job vacancies was in IT & Computing, while the only decrease was in Blue Collar. Vacancies 2003 2004 2005 2006 2007 2008 2009 2010 2011 2012 2013 2014 2015 20 25 30 35 40 45 50 55 60 65 70 Line: UK ScotlandBars: Increasing rate of decline Increasing rate of growth 50 = no change on previous month Index S.Adj. Index S. Adj. 50 = no chg Index 50 = no chg Index 2 2003 2004 2005 2006 2007 2008 2009 2010 2011 2012 2013 2014 2015 25 30 35 40 45 50 55 60 65 70 Line: UK ScotlandBars: Increasing rate of decline Increasing rate of growth 50 = no change on previous month Slower, albeit still- strong, growth in permanent staff demand. Latest rise in temp vacancies fastest for ten months. The Vacancy Index, shown by the bars in the chart on the right, is derived from the sectoral indexes of the demand for temporary and contract staff (shown on page 5). The Temporary Staff Vacancy Index is a weighted average of the eight individual sector indexes. The line in the chart shows the comparable index for the UK overall. Demand for temporary staff in Scotland increased in October, in line with the trend seen throughout the past six years. Furthermore, having accelerated for the fourth time in the past five months, the rate of growth was strong and the fastest overall since December 2014. That said, the latest increase in temporary vacancies in Scotland was less marked than that seen at the UK level, where growth quickened slightly from a 27- month low in September. Six of the eight jobs categories monitored by the survey recorded higher demand for temporary staff, the strongest rises being in Nursing/Medical/Care and Hotel & Catering respectively. Index S.Adj. Index S. Adj. 50 = no chg Index 50 = no chg Index 2015 Apr 59.2 58.8 65.9 65.5 May 57.8 58.5 61.2 63.6 Jun 60.3 59.4 66.3 64.3 Jul 49.8 56.1 64.6 63.5 Aug 60.7 59.6 63.3 63.3 Sep 63.0 60.9 62.5 62.0 Oct 52.6 57.7 62.0 62.1 2015 Apr 53.4 54.3 61.7 63.6 May 52.9 54.3 59.7 61.2 Jun 52.3 55.4 65.1 62.2 Jul 60.1 56.6 63.9 61.8 Aug 55.9 56.2 61.0 60.4 Sep 55.0 56.6 59.2 59.1 Oct 61.1 57.0 61.1 59.7 Demand for Permanent Staff at recruitment/employment consultancies Demand for Temporary/Contract Staff at recruitment/employment consultancies All UKScotland All UKScotland November 2015
  • 4. Sectoral demand – permanent 20 30 40 50 60 70 80 Blue Collar Scot UK 2003 2004 2005 2006 2007 2008 2009 2010 2011 2012 2013 2014 2015 30 40 50 60 70 80 90 Nursing/Medical/Care 50 = no change on previous month UK Scot r Text Nov. 3, 2015 2:42:25 PM 20 30 40 50 60 70 80 Hotel & Catering UK Scot 20 30 40 50 60 70 80 Engineering & Construction Scot UK sector was still much stronger than that seen in the second-highest ranked sector (see table), Accounts & Financial, where growth picked up in October. The only other categories that saw faster increases in permanent job openings were Hotel & Catering and Engineering & Construction (ranked fourth and fifth respectively), the rates of growth the sharpest in six months in both cases. Nursing/Medical/Care recorded a strong rise in demand for permanent staff, but one that was the weakest since May. Modest increases in permanent vacancies were registered in Secretarial & Clerical and Executive & Professional. However, Blue Collar saw a decrease for the fourth month running. 3 Permanent vacancies Data below are derived from the monthly survey of recruitment consultancies in Scotland. Consultants are requested to compare the demand for staff according to sector with the situation one month ago. Data are presented in the form of diffusion indices whereby a reading of 50 indicates no change on the previous month. Readings above 50 signal stronger demand than a month ago. Readings below 50 signal weaker demand than a month ago. Demand for permanent staff grows fastest in IT & Computing. Further decrease in Blue Collar vacancies. May'15 73.0 64.6 50.1 66.4 61.5 65.3 57.0 63.2 61.0 67.3 55.6 56.0 55.3 62.5 54.8 57.8 Jun 68.5 64.5 54.0 65.9 63.9 64.7 58.8 62.8 67.3 70.2 54.1 56.5 54.9 62.1 52.3 59.9 Jul 64.8 62.6 52.2 65.3 59.3 64.5 52.3 61.3 74.6 69.9 55.8 55.4 52.4 63.4 49.2 58.9 Aug 71.9 64.1 52.3 64.9 64.7 66.4 56.7 61.5 78.7 70.1 54.7 55.8 55.4 65.0 45.5 58.8 Sep 74.5 63.2 56.4 63.8 60.9 65.7 59.6 60.8 71.2 64.9 57.8 52.9 56.9 65.0 44.2 54.0 Oct 71.1 64.3 51.4 62.7 63.6 66.4 52.8 61.5 63.3 63.5 59.1 51.8 57.1 63.2 44.1 54.2 IT & Executive & Accounts & Secretarial Nursing/ Hotel & Engineering & Blue Computing Professional Financial & Clerical Medical/Care Catering Construction Collar Scot UK Scot UK Scot UK Scot UK Scot UK Scot UK Scot UK Scot UK 20 30 40 50 60 70 80 90 IT & Computing 50 = no change on previous month UK Scot 20 30 40 50 60 70 80 Executive & Professional UK Scot 20 30 40 50 60 70 80 Accounting & Financial Scot UK 20 30 40 50 60 70 80 Secretarial & Clerical Scot UK 2003 2004 2005 2006 2007 2008 2009 2010 2011 2012 2013 2014 2015 As was the case in the previous survey period, demand for permanent staff rose in seven of the eight jobs categories monitored, led by strong growth in IT & Computing. Although weaker than in September, the latest rise in permanent vacancies in the IT & Computing Sectors ranked by demand for permanent staff in Scotland in October 2015 Rank Sector Index 1 IT & Computing 71.1 2 Accounts & Financial 63.6 3 Nursing/Medical/Care 63.3 4 Hotel & Catering 59.1 5 Engineering & Construction 57.1 6 Secretarial & Clerical 52.8 7 Executive & Professional 51.4 8 Blue Collar 44.1 All Intellectual Property Rights owned by Markit Demand for permanent staff (Seasonally adjusted, 50 = no change on previous month) Bank of Scotland Report on Jobs
  • 5. Sectoral demand – temporary 20 30 40 50 60 70 80 Blue Collar Scot UK 2003 2004 2005 2006 2007 2008 2009 2010 2011 2012 2013 2014 2015 20 30 40 50 60 70 80 90 100 Nursing/Medical/Care 50 = no change on previous month UK Scot 30 40 50 60 70 80 Hotel & Catering UK Scot 20 30 40 50 60 70 80 Engineering & Construction Scot UK The sharpest overall rise in demand for temporary staff was in Nursing/Medical/Care, where growth accelerated for the fourth month running to the fastest since March. Hotel & Catering and Secretarial & Clerical, ranked second and third respectively (see table), also recorded strong increases in temporary vacancies that were faster than in the previous month. The rate of growth of temporary job openings in IT & Computing (ranked fourth) eased to the slowest since June, but nevertheless remained marked and slightly faster than in Engineering & Construction. Executive & Professional and Blue Collar were the only two areas that saw falls in temp staff demand. In the case of the latter, the drop was the second-fastest since January 2010. 4 Temporary/contract vacancies Data below are derived from the monthly survey of recruitment consultancies in Scotland. Consultants are requested to compare the demand for staff according to sector with the situation one month ago. Data are presented in the form of diffusion indices whereby a reading of 50 indicates no change on the previous month. Readings above 50 signal stronger demand than a month ago. Readings below 50 signal weaker demand than a month ago. Nursing/Medical/Care sees strongest rise in temp staff demand. Solid drop in Blue Collar temp openings. May'15 64.2 60.4 46.0 59.9 54.1 60.2 59.0 61.9 57.7 66.6 54.4 58.3 58.4 60.9 45.7 61.5 Jun 59.6 60.3 46.9 59.2 53.5 60.6 62.0 61.8 53.2 68.9 59.7 58.0 62.3 60.8 47.5 61.4 Jul 64.3 59.4 50.0 58.2 53.5 60.8 56.4 61.1 55.3 67.0 64.6 57.9 64.4 62.7 50.7 60.3 Aug 62.8 59.1 46.0 56.2 52.0 61.1 52.9 59.8 56.6 68.0 68.3 61.3 61.8 62.8 54.2 60.4 Sep 66.7 59.1 53.0 54.8 55.3 59.7 55.5 59.4 61.1 64.6 65.0 58.0 58.3 61.0 50.5 58.6 Oct 61.0 60.3 48.4 54.1 53.3 59.8 62.7 60.3 67.6 64.2 65.1 60.6 59.0 57.8 46.7 59.4 IT & Executive & Accounts & Secretarial Nursing/ Hotel & Engineering & Blue Computing Professional Financial & Clerical Medical/Care Catering Construction Collar Scot UK Scot UK Scot UK Scot UK Scot UK Scot UK Scot UK Scot UK 30 40 50 60 70 80 IT & Computing 50 = no change on previous month UK Scot 20 30 40 50 60 70 Executive & Professional UK Scot 20 30 40 50 60 70 80 Accounting & Financial Scot UK 20 30 40 50 60 70 80 Secretarial & Clerical Scot UK 2003 2004 2005 2006 2007 2008 2009 2010 2011 2012 2013 2014 2015 Trends in temporary staff demand at the sector level showed great variation in October, with some categories seeing renewed falls in the number of vacancies, while others recorded strong growth, in some cases faster than in September. Sectors ranked by demand for temp/contract staff in Scotland in October 2015 Rank Sector Index 1 Nursing/Medical/Care 67.6 2 Hotel & Catering 65.1 3 Secretarial & Clerical 62.7 4 IT & Computing 61.0 5 Engineering & Construction 59.0 6 Accounts & Financial 53.3 7 Executive & Professional 48.4 8 Blue Collar 46.7 Demand for temporary/contract staff (Seasonally adjusted, 50 = no change on previous month) November 2015
  • 6. October saw a further deterioration in the availability of candidates for permanent vacancies in Scotland. The degree to which numbers decreased was sharp and slightly more marked than in September. Around 38% of consultancies recorded a fall permanent candidate supply, versus 21% that noted an improvement. However, the reduction in permanent candidate availability in Scotland was less severe than across the UK as a whole, as has been the case in each of the past five months. Staff availability 2003 2004 2005 2006 2007 2008 2009 2010 2011 2012 2013 2014 2015 20 25 30 35 40 45 50 55 60 65 70 75 80 85 90 Line: UK ScotlandBars: Deteriorating availability Improving availability 50 = no change on previous month 2015 May 20.0 30.0 50.0 -30.0 35.0 33.5 34.5 35.3 Jun 14.3 36.7 49.0 -34.7 32.7 36.7 34.6 36.4 Jul 19.2 44.2 36.5 -17.3 41.3 38.5 31.5 34.2 Aug 21.3 34.0 44.7 -23.4 38.3 43.9 28.9 32.0 Sep 14.5 52.7 32.7 -18.2 40.9 42.5 36.7 35.8 Oct 21.4 41.1 37.5 -16.1 42.0 42.0 38.1 37.3 Higher Same Lower Net Index S.Adj. Index S. Adj. % % % +/- 50 = no chg Index 50 = no chg Index The availability of candidates for temporary vacancies north of the border decreased marginally in October. This was highlighted by the corresponding seasonally adjusted index registering just below the 50.0 no- change mark, at its highest level in the current 30-month sequence of falling temporary candidate numbers. At the UK level, the rate of deterioration in temporary candidate availability was sharp and slightly faster than that recorded in the preceding survey period. 5 2015 May 21.1 34.2 44.7 -23.7 38.2 37.1 38.0 38.9 Jun 12.2 48.8 39.0 -26.8 36.6 37.6 38.4 39.4 Jul 16.7 42.9 40.5 -23.8 38.1 43.5 38.7 41.1 Aug 17.6 61.8 20.6 -2.9 48.5 48.5 34.2 38.5 Sep 11.6 58.1 30.2 -18.6 40.7 46.7 39.7 40.7 Oct 26.7 40.0 33.3 -6.7 46.7 48.9 38.1 40.2 Higher Same Lower Net Index S.Adj. Index S. Adj. % % % +/- 50 = no chg Index 50 = no chg Index 2003 2004 2005 2006 2007 2008 2009 2010 2011 2012 2013 2014 2015 30 35 40 45 50 55 60 65 70 75 80 85 90 Line: UK ScotlandBars: Deteriorating availability Improving availability 50 = no change on previous month Further sharp drop in permanent candidate availabilty. Temp candidate supply drops only slightly. Q. Is the availability of candidates for permanent vacancies better, the same or worse than one month ago? Q. Is the availability of candidates for temporary vacancies better, the same or worse than one month ago? All Intellectual Property Rights owned by Markit Availability of Permanent Staff Availability of Temporary/Contract Staff All UKScotland All UKScotland Bank of Scotland Report on Jobs
  • 7. Permanent salary inflation in Scotland slowed further in October. Adjusted for the influence of seasonal factors, the Permanent Salaries Index fell for the fifth time in the past six months and registered at its lowest level since August 2013, albeit one that was still indicative of a solid rate of pay growth. The rise in permanent salaries north of the border was much less marked than that seen across the UK as a whole, where the rate of inflation picked up slightly and was comfortably faster than respective the long- run average. Pay pressures 2003 2004 2005 2006 2007 2008 2009 2010 2011 2012 2013 2014 2015 35 40 45 50 55 60 65 70 Line: UK ScotlandBars: Increasing rate of decline Increasing rate of growth 50 = no change on previous month 2015 May 32.0 62.0 6.0 26.0 63.0 61.4 64.3 63.7 Jun 30.0 64.0 6.0 24.0 62.0 62.0 63.2 62.7 Jul 27.5 60.8 11.8 15.7 57.8 58.8 63.1 61.4 Aug 27.1 60.4 12.5 14.6 57.3 56.8 62.1 61.8 Sep 16.1 76.8 7.1 8.9 54.5 55.7 61.3 60.9 Oct 17.5 71.9 10.5 7.0 53.5 55.1 61.2 61.5 Higher Same Lower Net Index S.Adj. Index S. Adj. % % % +/- 50 = no chg Index 50 = no chg Index In contrast to the trend in permanent starting salaries in Scotland, hourly rates of pay for temporary staff increased at faster pace during October. The extent to which temp wages rose at the start of the fourth quarter was in fact among the greatest seen since the survey started in 2003. Furthermore, the rate of growth was faster than the UK average, marking the third month running in which that has been the case.At the UK level, temp wage inflation was broadly unchanged from September’s one-and-a-half year low. 6 2015 May 31.6 57.9 10.5 21.1 60.5 59.3 55.4 57.2 Jun 15.0 80.0 5.0 10.0 55.0 55.0 56.2 56.8 Jul 21.4 71.4 7.1 14.3 57.1 54.6 57.9 57.9 Aug 30.6 61.1 8.3 22.2 61.1 58.1 56.7 56.7 Sep 20.5 75.0 4.5 15.9 58.0 57.4 56.6 55.9 Oct 31.1 66.7 2.2 28.9 64.4 60.0 58.5 56.1 Higher Same Lower Net Index S.Adj. Index S. Adj. % % % +/- 50 = no chg Index 50 = no chg Index 2003 2004 2005 2006 2007 2008 2009 2010 2011 2012 2013 2014 2015 35 40 45 50 55 60 65 Line: UK ScotlandBars: Increasing rate of decline Increasing rate of growth 50 = no change on previous month Salary inflation continues to slow. Temporary wages surge higher. Q. Are average salaries for permanent staff higher, the same or lower than one month ago? Q. Are average hourly rates of pay for temporary and contract staff higher, the same or lower than one month ago? Permanent Salaries Temporary/Contract Staff Hourly Pay Rates All UKScotland All UKScotland November 2015
  • 8. 7 UK regional summary Latest figures from the ONS showed back-to-back increases in the UK claimant count for the first time since June 2012. September saw the number of people claiming Jobseeker’s Allowance rise by 4,585, the largest gain in just under three years. This took the overall claimant count to a three-month high of 796,263. The claimant count rate* was unchanged at 2.3%, the same rate recorded in each month since March. Regional breakdowns showed that the lowest claimant count rate was in the South East of England (1.3%), while the highest was in Northern Ireland (4.5%). Scotland was one of only two regions (the other being the North West) where the claimant count rose in September. At 2.9%, it was the highest since February. The number of people claiming Jobseeker’s Allowance north of the border increased by 3,076, which was the largest monthly rise since July 2011. South East 60 1.3 (1) South West 40 1.4 (2) East of England 50 1.6 (3) London 111 1.9 (4) East Midlands 49 2.1 (5) West Midlands 79 2.7 (6) Scotland 80 2.9 (7) Yorks & Humberside 81 3.0 (8) NW & Merseyside 115 3.1 (9) Wales 45 3.1 (9) North East 46 3.8 (11) Northern Ireland 41 4.5 (12) United Kingdom 796 2.3 Unemployment (Sep ’15) Region ‘000s Rate (%)* Rank Source: Department for Work & Pensions and National Statistics. * As a percentage of Claimant Count + Workforce Jobs. Survey methodology The Bank of Scotland Survey The Bank of Scotland survey of recruitment and employment consultancies is based on information provided by a panel of 105 consultancies operating in Scotland. Data are collected monthly and converted into a seasonally adjusted series. Markit do not revise underlying survey data after first publication, but seasonal adjustment factors may be revised from time to time as appropriate which will affect the seasonally adjusted data series. The information from the survey panel is also used in the compilation of the REC monthly survey for the UK, which appears in the monthly Report on Jobs and which uses an identical survey methodology. (The contribution of the Scotland data to the UK data is weighted to reflect Scotland’s share of the total labour market.) The KPMG/REC UK Survey The KPMG/REC monthly UK recruitment survey features original research data from Markit, collected via questionnaire from a panel of UK recruitment and employment consultancies. Data for the monthly survey were first collected in October 1997 and are collected at the end of each month, with respondents asked to specify the direction of change in a number of survey variables. Index numbers Index numbers shown in the report are calculated from the percentages of respondents reporting an improvement, no change or decline. These indices vary between 0 and 100 with readings of exactly 50.0 signalling no change on the previous month. Readings above 50.0 signal an increase or improvement; readings below 50.0 signal a decline or deterioration. Reasons given by survey respondents for any changes are analysed to provide insight into the causes of movements in the indices. Bank of Scotland Bank of Scotland is part of Lloyds Banking Group, the UK’ s largest retail bank and Scotland’s largest financial services employer. Established in 1695, Bank of Scotland is the UK’s oldest surviving clearing bank. Our goal is to be the best financial services provider in Scotland. We believe this means we must build a leadership position not on the basis of scale but on the foundations of reputation and recommendation. The Recruitment and Employment Confederation The REC is the association for the UK’s £22.5 billion private recruitment and staffing industry with more than 8,000 recruitment agencies and 6,000 recruitment consultants in membership. There are more than 1 million temporary workers registered with UK agencies who are deployed in industry, commerce and the public services every day. Markit Markit is a leading global diversified provider of financial information services. We provide products that enhance transparency, reduce risk and improve operational efficiency. Our customers include banks, hedge funds, asset managers, central banks, regulators, auditors, fund administrators and insurance companies. Founded in 2003, we employ approximately 4,000 people in 11 countries. Markit shares are listed on NASDAQ under the symbol MRKT. For more information, see www.markit.com. About PMI Purchasing Managers’ Index ® (PMI ® ) surveys are now available for over 30 countries and also for key regions including the Eurozone. They are the most closely-watched business surveys in the world, favoured by central banks, financial markets and business decision makers for their ability to provide up-to-date, accurate and often unique monthly indicators of economic trends. For more information e-mail economics@markit.com. Bank of Scotland, REC and Markit All Intellectual Property Rights owned by Markit Bank of Scotland Report on Jobs