Property And Facility KPI Dashboard Showing Occupancy Cost Delinquencies And Distributions

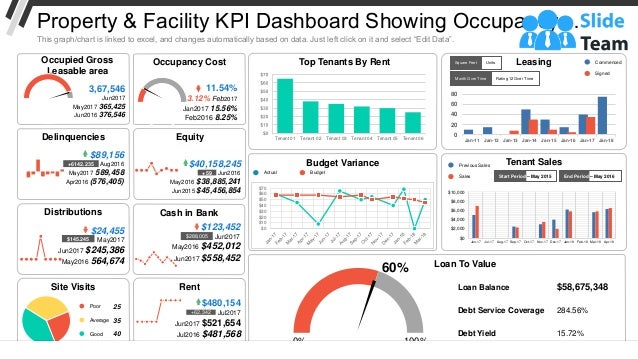
"You can download this product from SlideTeam.net" The KPI Dashboard PowerPoint template is perfect for illustrating the different parameters of property as well as the facility. A user can take help of Property And Facility KPI Dashboard PPT slide to present the Occupied GLA, Delinquencies, Distribution and Site Visit, along with that he can also demonstrate Occupancy Cost, Equity, Cash in Bank, Rent and many more. A user can define all these things in an effective manner as the designing team of SlideTeam has utilized a variety of figures such as meter icon, line chart, rectangular wave graph, pie chart and many other. The presenter can use the Top Tenants by Rent Line Graph template to present the number of tenants along with their respective rent amount. Representing the budget was never so easy earlier when an individual insert the KPI Budget Variance Presentation template in his PPT, it looks more appealing and he can easily explain the variation between actual amount and budget. By taking help of Loan To Value Meter slide, you can explain loan balance, debt service coverage and Debt yield and you can also do changes in the values manually as the KPI Metric PowerPoint Slide gets linked with Excel Spread Sheet. Arrive at comprehensive conclusions with our Property And Facility Kpi Dashboard Showing Occupancy Cost Delinquencies And Distributions. Closely examine all the important information. https://bit.ly/3sJod0O

Recommended
Recommended
More Related Content
Similar to Property And Facility KPI Dashboard Showing Occupancy Cost Delinquencies And Distributions
Similar to Property And Facility KPI Dashboard Showing Occupancy Cost Delinquencies And Distributions (20)
More from SlideTeam
More from SlideTeam (20)
Recently uploaded
Recently uploaded (20)
Property And Facility KPI Dashboard Showing Occupancy Cost Delinquencies And Distributions
- 1. This graph/chart is linked to excel, and changes automatically based on data. Just left click on it and select “Edit Data”. Property & Facility KPI Dashboard Showing Occupancy… Tenant 01 Tenant 02 Tenant 03 Tenant 04 Tenant 05 Tenant 06 Top Tenants By Rent Leasing Units Square Feet Month Over Time Rating 12 Over Time Commenced Signed 0 20 40 60 80 Jan-11 Jan-12 Jan-13 Jan-14 Jan-15 Jan-16 Jan-17 Jan-18 Tenant Sales $0 $2,000 $4,000 $6,000 $8,000 $10,000 Jun-17 Jul-17 Aug-17 Sep-17 Oct-17 Nov-17 Dec-17 Jan-18 Feb-18 Mar-18 Apr-18 Start Period – May 2015 End Period – May 2016 Previous Sales Sales Site Visits Poor Average Good 25 35 40 Delinquencies $89,156 Aug2016 May2017 589,458 Apr2016 (576,405) +6142.235 Distributions $24,455 May2017 Jun2017 $245,386 May2016 564,674 $145.245 Occupied Gross Leasable area 3,67,546 Jun2017 May2017 365,425 Jun2016 376,546 Equity $40,158,245 Jun2016 May2016 $38,885,241 Jun2015 $45,456,854 +59 Cash in Bank $123,452 Jun2017 May2016 $452,012 Jun2017 $558,452 $288,005 Rent $480,154 Jul2017 Jun2017 $521,654 Jul2016 $481,568 +62.342 Occupancy Cost 11.54% 3.12% Feb2017 Jan2017 15.56% Feb2016 8.25% Loan To Value Loan Balance $58,675,348 Debt Service Coverage 284.56% Debt Yield 15.72% $0 $10 $20 $30 $40 $50 $60 $70 Actual Budget Budget Variance 60% 0% 100%
- 2. Instructions To Edit This Slide This slide has been made in PowerPoint using basic PowerPoint shapes, and all graphics are 100% editable in PowerPoint. You can change color, size and orientation of any element to your liking, and add/edit any piece of text anywhere.
- 3. All images are 100% editable in PowerPoint Change color, size and orientation of any icon to your liking”
- 4. 1. Select the Graph and right click -> Select "Edit Data" 2. An excel matrix will automatically show up 3. Enter the values based on your requirements and hit enter 4. The Graph/Chart shape will automatically adjust according to your data, and anytime you can go and change the value again Edit Excel-linked Chart This is a Data Driven Chart/Graph and the shape automatically adjusts according to your data 1 2 3
- 5. Edit Color 1. Select the shape to change the color and Right click the object( click any object which you want to change color) 2. Choose Format Data Series in the dialog box. 3. Choose “Fill” in the Format Shape box then “Solid” or “Gradient” depending on the appearance of the object. Change colour as shown in the picture. 1 2 3
- 6. Select From Thousands Of Editable Icons On Every Topic These icons are available at the Icons section on www.slideteam.net