Downloaded 104 times
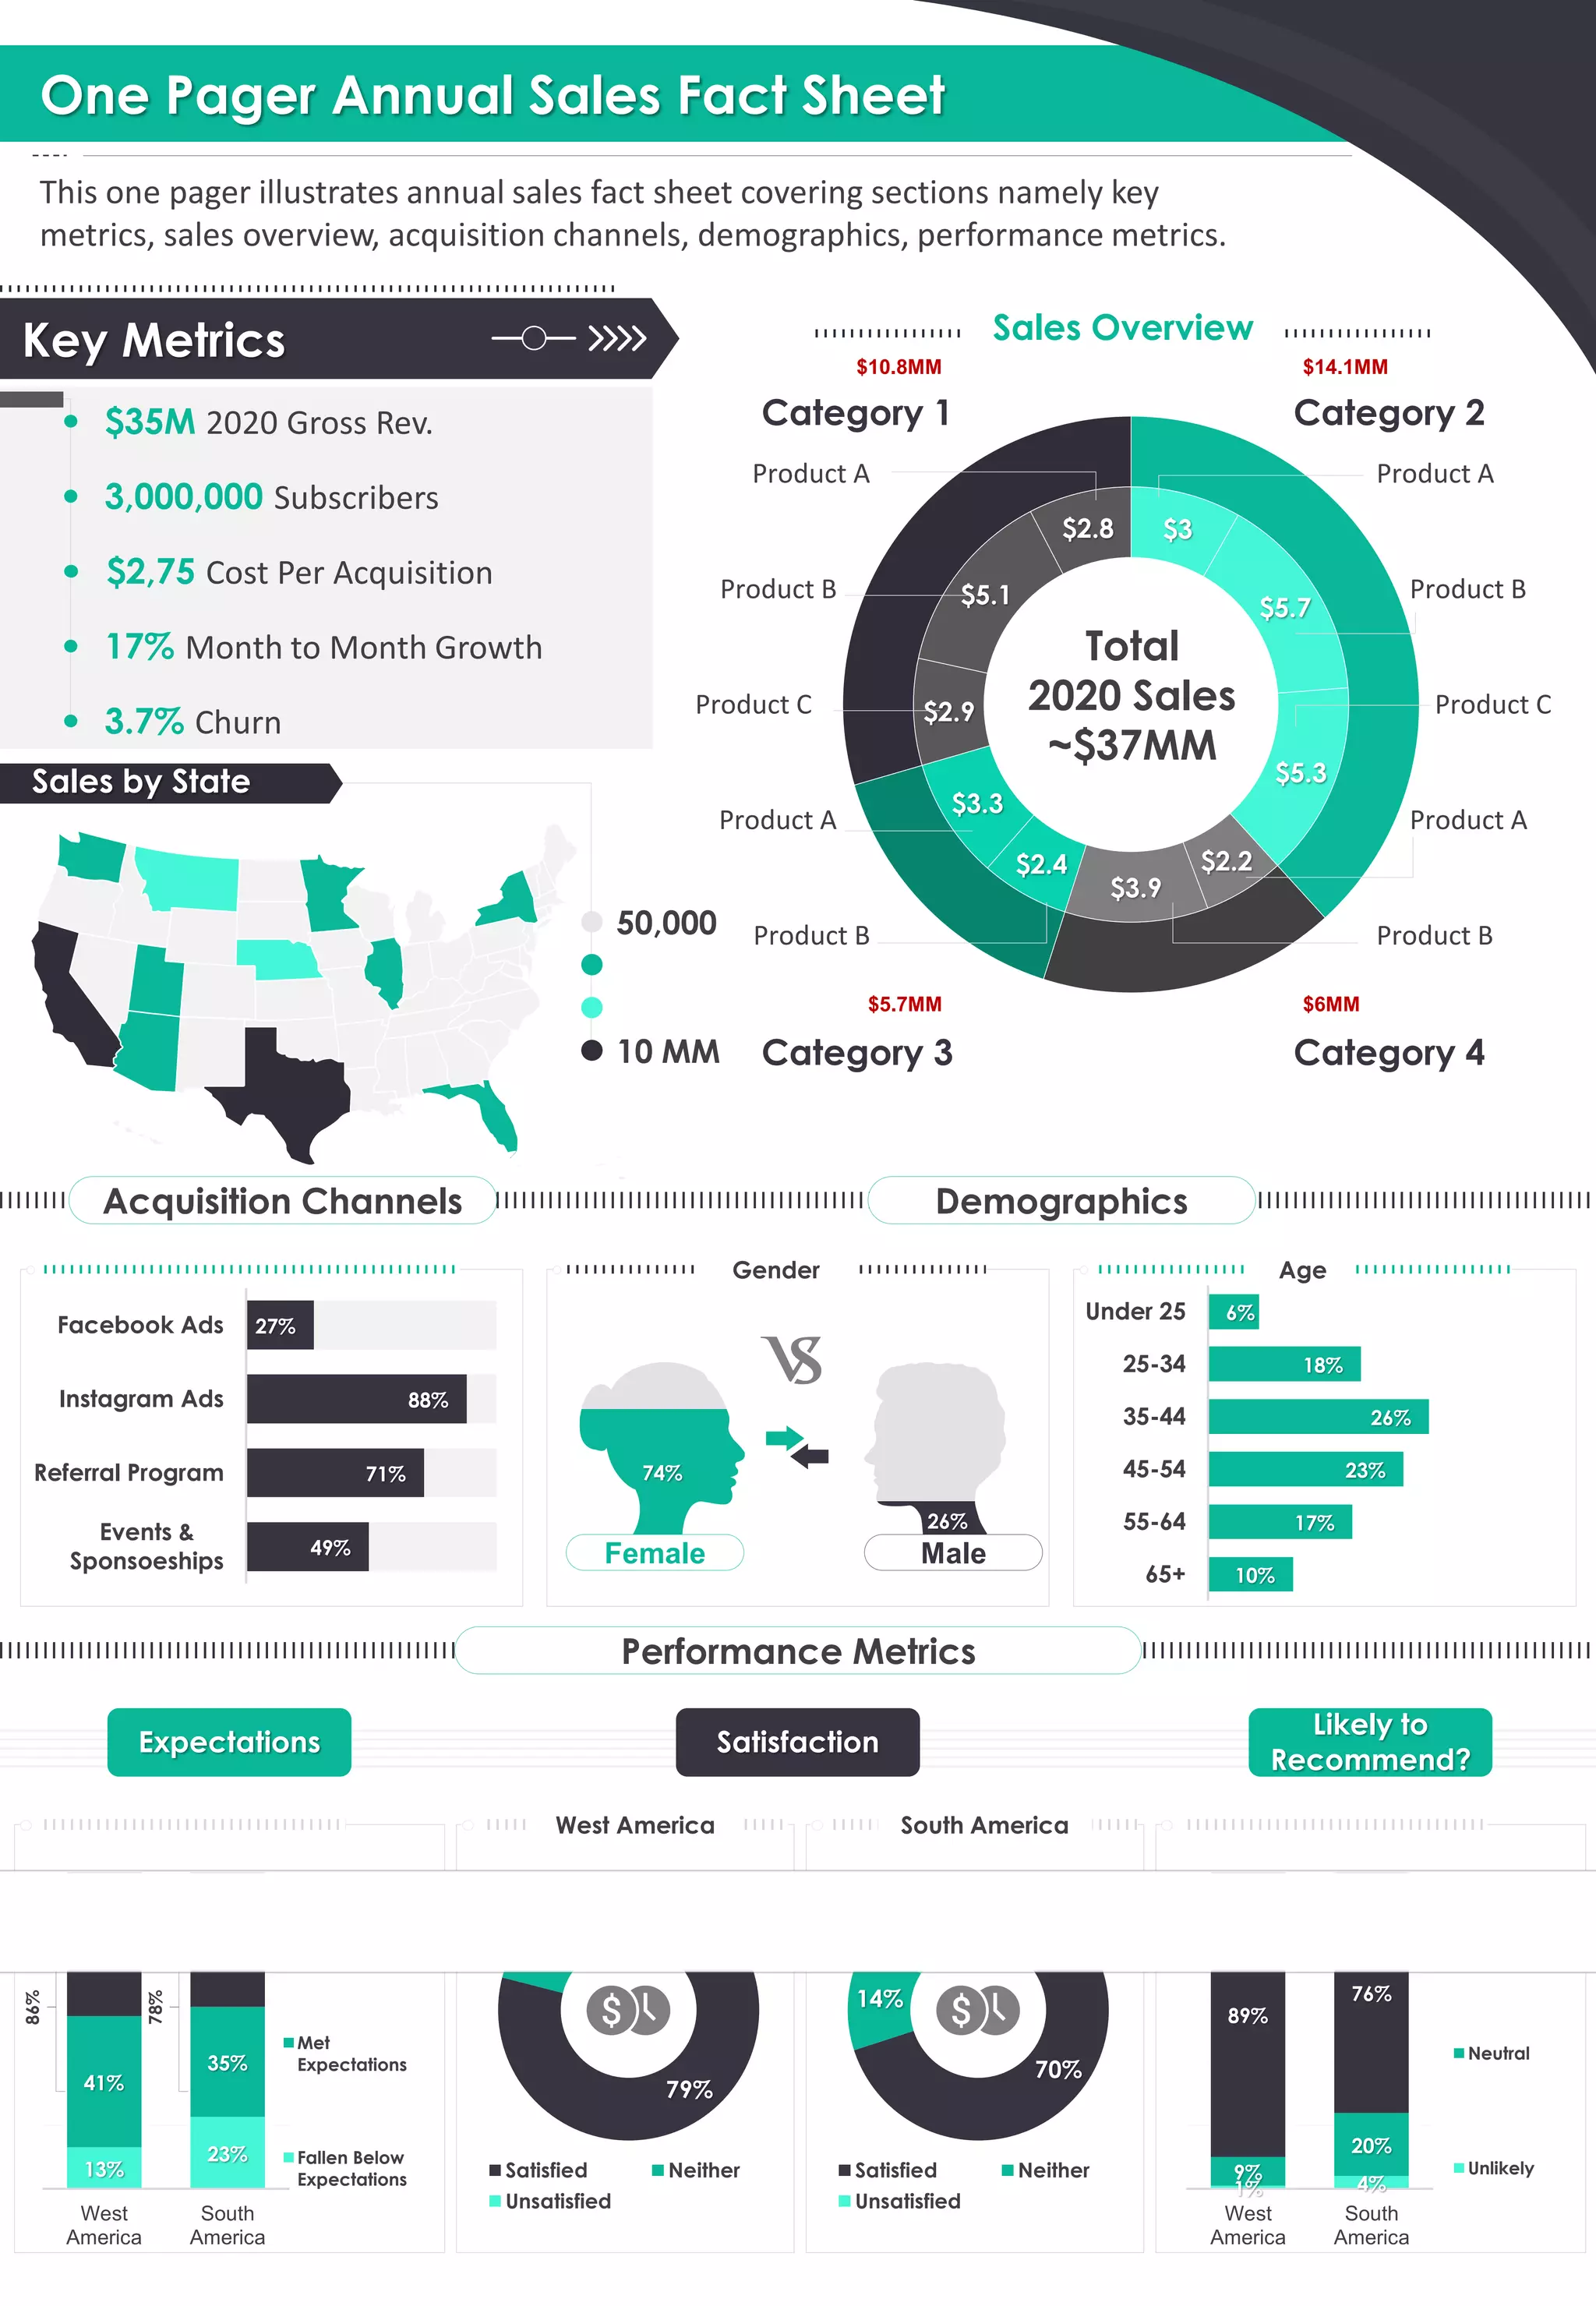

This document provides an annual sales fact sheet for a company with the following key details: - $35 million in gross revenue in 2020, 3 million subscribers, with a $2.75 cost per acquisition and 17% month-over-month growth. The churn rate was 3.7%. - Sales broke down by product, category, and state/region. The largest sources of sales were product A and B, and categories 1 and 2. Most sales came from West and South America. - Customer satisfaction and performance metrics are provided by region. Most customers' experience met or exceeded expectations, and over 75% would recommend. The majority were satisfied customers. - The largest acquisition channels were Facebook ads, Instagram


