1. University of South Florida
Scholar Commons
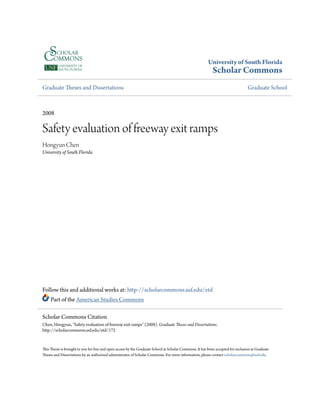
Graduate Theses and Dissertations Graduate School
2008
Safety evaluation of freeway exit ramps
Hongyun Chen
University of South Florida
Follow this and additional works at: http://scholarcommons.usf.edu/etd
Part of the American Studies Commons
This Thesis is brought to you for free and open access by the Graduate School at Scholar Commons. It has been accepted for inclusion in Graduate
Theses and Dissertations by an authorized administrator of Scholar Commons. For more information, please contact scholarcommons@usf.edu.
Scholar Commons Citation
Chen, Hongyun, "Safety evaluation of freeway exit ramps" (2008). Graduate Theses and Dissertations.
http://scholarcommons.usf.edu/etd/172
4. ACKNOWLEDGEMENTS
I would like to thank Dr Pan Liu and Dr Jian Lu, the co-major professors who have
helped me a lot in the completion of the thesis and the academic program. I also wish to
thank Dr Pei-sung Lin and Dr Edward Mierzejewski, who have patiently guided me
through the thesis process. This thesis is part of the research project sponsored by the
Florida Department of Transportation. The statistical offices of FDOT are greatly
appreciated for providing the important data of the project. I would like to thank the
Graduate Research Assistants at the Department of Civil and Environmental Engineering
of the University of South Florida as well for their assistances in field data collections.
5. i
TABLE OF CONTENTS
LIST OF TABLES v
LIST OF FIGURES viii
ABTRACT x
CHAPTER ONE INTRODUCTION 1
1.1 Background 1
1.2 Research Subject 4
1.2.1 Freeway Diverge Areas 4
1.2.2 Entire Exit Ramp Sections 9
1.3 Research Objectives 12
1.4 Research Approach 12
1.5 Research Tasks 13
1.6 Thesis Outline 14
6. ii
CHAPTER TWO LITERATURE REVIEW 16
2.1 General Freeway and Ramp Guidelines 16
2.2 Freeway Diverge Areas 17
2.3 Exit Ramp Section 23
CHAPTER THREE METHODOLOGY 28
3.1 Crash Frequency and Crash Rate 28
3.1.1 Crash Frequency 28
3.1.2 Crash Rate 30
3.2 Crash Type and Crash Severity 31
3.2.1 Crash Type 32
3.2.2 Crash Severity 33
3.3 Cross-Sectional Comparison Approach 33
3.4 The Hypothesis Test 34
3.4.1 Hypothesis Tests on the Equality of Two Means 36
3.4.2 Hypothesis Tests on Proportionality 37
3.5 Statistical Predictive Model 38
CHAPTER FOUR DATA COLLECTION 42
4.1 Site Selection Criteria 42
4.2 Segment Length Definition 44
4.2.1 Freeway Diverge Length 45
4.2.2 Exit Ramp Length 48
7. iii
4.3 Selected Sites Information 52
4.3.1 Freeway Diverge Areas 55
4.3.2 Exit Ramp Sections 56
4.4 Site Selection Procedures 56
4.4.1 Site Selection Procedure 1 56
4.4.2 Site Selection Procedure 2 57
4.4.3 Site Selection Procedure 3 58
4.5 Section Number, Milepost and Site Identification Number 58
4.6 Crash Database 59
4.7 Combination of Crash Data with Site Information 60
CHAPTER FIVE DATA ANALYSIS 61
5.1 Outline of Data Analysis 61
5.2 Freeway Diverge Areas 62
5.2.1 Comparison of Average Crash Frequency and Crash Rate 62
5.2.2 Comparison of Target Crash Types 68
5.2.3 Comparison of Crash Severity 73
5.2.4 Crash Predictive Model 76
5.3 Exit Ramp Sections 82
5.3.1 Comparison of Average Crash Frequency and Crash Rate 82
5.3.2 Comparison of Target Crash Types 87
5.3.3 Comparison of Crash Severity 91
5.3.4 Crash Predictive Model 93
8. iv
CHAPTER SIX SUMMARY, CONCLUSION, AND RECOMMENDATION 100
6.1 Summary 100
6.2 Conclusions 102
6.2.1 Freeway Diverge Areas 102
6.2.2 Freeway Exit Ramp Sections 103
6.3 Applications and Recommendations 104
6.3.1 Applications 104
6.3.2 Recommendations 105
REFERENCES 107
APPENDICES 111
Appendix A: Site Pictures Examples 112
9. v
LIST OF TABLES
Table 1. FDOT Districts Distributions for Selected Sample Sites 54
Table 2. Sites Resource Distributions for Freeway Diverge Areas 55
Table 3. Summary of Average Crash Frequency and Crash Rate
for Four Exit Ramp Types 65
Table 4. Summary Hypotheses Tests of Average Crash Frequency and
Crash Rate for Four Exit Ramp Types 68
Table 5. Summary of Average Crash Numbers by Target Crash Types
for Four Exit Ramp Types 69
Table 6. Summary of Average Crash Rates by Target Crash Types for
Four Exit Ramp Types 70
Table 7. Z Statistics for Proportionality Tests of Three Target Crash Types
for Four Exit Ramp Types 72
Table 8. Summary of Average Crash Numbers by Crash Severity
for Four Exit Ramp Types 73
Table 9. Summary of Average Crash Rates by Crash Severity
for Four Exit Ramp Types 74
10. vi
Table 10. Z Statistics for Proportionality Tests by Crash Severity for
Four Exit Ramp Types 76
Table 11. Description of Initially Considered Independent Variables
on Freeway Diverge Areas 77
Table 12. Regression Results for Crash Prediction Model on Diverge Areas 79
Table 13. Summary of Average Crash Frequency and Crash Rate
for Four Exit Ramp Configurations 84
Table 14. Summary Hypotheses Tests for Average Crash Frequency and
Crash Rate for Four Exit Ramp Types 86
Table 15. Summary of Average Crash Numbers by Target Crash Types
for Four Exit Ramp Configurations 88
Table 16. Summary of Average Crash Rates by Target Crash Types for
Four Exit Ramp Configurations 88
Table 17. Z Statistics for Proportionality Tests of Target Crash Types
for Four Exit Ramp Configurations 90
Table 18. Summary of Average Crash Numbers by Crash Severity
for Four Exit Ramp Configurations 91
Table 19. Summary of Average Crash Rates by Crash Severity for
Four Exit Ramp Configurations 92
Table 20. Z Statistics for Proportionality Tests by Crash Severity for
Four Exit Ramp Configurations 93
Table 21. Description of Initially Considered Independent Variables
on Exit Ramp Sections 95
12. viii
LIST OF FIGURES
Figure 1. Type 1 Exit Ramp: Parallel from a Tangent Single-lane Exit Ramp 6
Figure 2. Type 2 Exit Ramp: Single-lane Exit Ramp without a Taper 7
Figure 3. Type 3 Exit Ramp: Two-lane Exit Ramp with an Optional Lane 7
Figure 4. Type 4 Exit Ramp: Two-lane Exit Ramp without an Optional Lane 8
Figure 5. Typical Four Exit Ramp Configurations 10
Figure 6. Type 1 Exit Ramp Section Length: Parallel from a Tangent
Sing-lane Exit Ramp 46
Figure 7. Type 2 Exit Ramp Section Length: Sing-lane Exit Ramp
without a Taper 46
Figure 8. Type 3 Exit Ramp Section Length: Two-lane Exit Ramp with
an Optional Lane 47
Figure 9. Type 4 Exit Ramp Section Length: Two-lane Exit Ramp
without an Optional Lane 47
Figure 10. Exit Ramp Segment Lengths for Four Ramp Configurations 49
Figure 11. Florida Interstate Highway System 53
Figure 12. Florida District Map 53
Figure 13. SPSS Example Format from FDOT Crash Database 60
13. ix
Figure 14. Example of Combining Database 60
Figure 15. Comparison of Average Crash Frequency among
Four Exit Ramp Types 64
Figure 16. Comparison of Average Crash Rate among Four Exit Ramp Types 64
Figure 17. Site Picture for I-95 Southbound Exit 74 66
Figure 18. Comparison of Percentages by Target Crash Types for
Four Exit Ramp Types 71
Figure 19. Comparison of Percentages by Crash Severity for
Four Exit Ramp Types 75
14. x
SAFETY EVALUATION OF FREEWAY EXIT RAMPS
Hongyun Chen
ABSTRACT
The primary objective of the study is to evaluate safety performances of different
exit ramps used in Florida and nationally. More specific, the research objectives include
the following two parts: (1) to evaluate the impacts of different exit ramp types on safety
performance for freeway diverge areas; and (2) to identify the different factors
contributing to the crashes happening on the exit ramp sections. To achieve the research
objectives, the research team investigated crash history at 424 sites throughout Florida.
The study area includes two parts, the freeway diverge area and the exit ramp sections.
For the freeway diverge areas, exit ramp types were defined based on the number of lanes
used by vehicular traffic to exit freeways. Four exit ramp types were considered here
including single-lane exit ramps (Type 1), sing-lane exit ramps without a taper (Type 2),
two-lane exit ramps with an optional lane (Type 3), and two-lane exit ramps without an
optional lane (Type 4). For the exit ramp sections, four ramp configurations, including
diamond, out connection, free-flow loop and parclo loop, were considered.
Cross-sectional comparisons were conducted to compare crash frequency, crash
rate, crash severity and crash types between different exit ramp groups. Crash predictive
models were also built to quantify the impacts of various contributing factors. On the
15. xi
freeway diverge areas, it shows that Type 1 exit ramp has the best safety performance in
terms of the lowest crash frequency and crash rate. The crash prediction model shows
that for one-lane exit ramp, replacing a Type 1 with a Type 2 will increase crash counts at
freeway diverge areas by 15.57% while replacing a Type 3 with a Type 4 will increase
crash counts by 10.80% for two-lane ramps. On the exit ramp sections, the out
connection ramps appear to have the lowest average crash rate than the other three. The
crash predictive model shows that replacing an out connection exit ramp with a diamond,
free-flow, and parclo loop will increase crashes counts by 26.90%, 68.47% and 48.72%
respectively. The results of this study will help transportation decision makers develop
tailored technical guidelines governing the selection of the optimum design combinations
on freeway diverge areas and exit ramp sections.
16. 1
CHAPTER ONE
INTRODUCTION
1.1 Background
Freeways play important roles in the highway system around the country. In the
United States, the interstate highway system, which composes less than 2% of the total
urban highway mileage, carries more than 20% of the traffic by the end of 2006.
Freeways provide the specific traffic facility which allows the traffic run smoothly in the
roadway network at the highest level. They are constructed according to the highest
highway design standards and regulated public movements by full controls of traffic
elements such as capacity, post speed, geometrics fundamentals, and level of service.
Exit ramps are the only control accesses used for traffic exiting freeways. They
also serve as transitions from freeways to secondary crossroads which could be freeways,
major or minor arterials, or local streets. The design of freeway exit ramps could
significantly impact the safety and operation performances on freeways, exit ramps and
crossroads. The AASHTO Green Book (A Policy on the Design of Geometric Highways
and Streets) (12) mentioned that complex design components make ramps vary from
simple to comprehensive layouts so that each ramp site should be studied and planned
carefully. Freeway diverge areas are the specific segments that divide the freeway traffic
exiting from or continuing on the freeway mainlines. Freeways connect with exit ramps
17. 2
by several different diverge types called exit ramp types in this study. These types cause
different results of safety performances on the freeway diverge areas by different ways.
Exit ramp section is another important concern in this study. Exit ramps provide limit-
accesses from freeways to other freeways, lower-speed arterials or local streets. A few
factors, such as geometrics, traffics, and local conditions, have different relationships
with crashes. These facts include more than deceleration distances, exit ramp lengths,
design speeds, operating speeds, speed differences, exit ramp configurations, or road
conditions. Better understanding the relationships among them would help improve the
safety, efficiency, mobility, accessibility, and accommodation aspects for both freeway
diverge areas and exit ramp sections. “Ramp Management and Control Handbook”(14),
published by U.S. Department of Transportation (DOT) and Federal Highway
Administration (FHWA) in 2004, aims to manage ramp policies, strategies and
technologies as to improve safety on the exit ramp and the influential areas. Ramp
management strategies control the flow vehicles exiting a freeway not only on the exit
ramps, but also on the freeway neighboring areas. A before and after evaluation of ramp
crashes in Minneapolis found that the number of peak period crashes on freeways and
ramps increased 26% when there was no ramp control strategy in 2001. This case
revealed the reality that resolutions to the deficiencies on the freeway diverge areas and
exit ramp sections can help to improve safety.
Successful managements on the two research segments, freeway diverge areas
and exit ramp sections, could obtain benefits on society, economics and cultures and gain
satisfactions on safety improvements. However, the impacts of exit ramp types on the
safety performance of freeway diverge areas have not been well studied or documented
18. 3
until recently. Few have focused on the impacts of the types of exit ramps concerning the
lane balance problems such as the number of lanes used by traffic to exit freeways. The
details of the relationship between the lane balance and safety are not well understood.
Since the limit work that has been performed, a few tentative conclusions might to be
drawn. It can assume that potential improvements will lead to fewer crashes, thus
enhance safety on the freeway diverge areas. On the exit ramp sections, the various
influential factors on the safety performance at entire exit ramp sections need to be
revised and re-conducted since previous studies have a few limitations. For example,
some predictive crash models concerned different ramp configurations and ramp length,
however the control types of ramp terminals did not contain in these models (3). Some
models combined the off ramps and on ramps. The combination might ignore the
dissimilar operating factors between the two different kinds of ramps.
Several types of exit ramps are used for traffic to exit freeways on the diverge
areas. The increasing vehicular crashes in freeway diverge areas lift up the need to select
the best exit ramp designs to improve safety on freeway diverge areas. The problem is
relatively new and highly demanded in today’s highway system. For the exit ramp
sections, little focus has been put on the safety issues in the State of Florida. So this study
would conduct comprehensive crash comparisons and analyses on freeway exit ramp
sections for the whole state. The results of two research parts, freeway diverge areas and
exit ramp sections in this study, will help transportation decision makers develop tailored
technical guidelines governing the selection of the optimum exit ramp types and
combinations of related factors to be used on our freeway diverge areas and exit ramp
sections.
19. 4
1.2 Research Subject
On the freeway diverge areas, the most commonly used freeway exit ramps
include two-lane exit ramps with an optional lane, two-lane exit ramps without optional
lane, single-lane exit ramps with widening to two lanes on the ramp beyond the exit gore,
and three basic number of through lanes changed to two through lanes with one lane
reduced and designated as the exit lane. Drivers exiting a freeway must decrease vehicle
speeds and weave to the deceleration lane toward the entrance of the exit ramp. Different
types of exit ramps require drivers to make distinctive decisions to complete related
maneuvers both for exiting and continuing with the freeway. As a result, different exit
ramp design may impact the safety and operational performance of freeway diverge areas
in different ways. On the exit ramp sections, different ramp configurations such as
diamond, out connection, free flow, and parclo flow and other factors such as widening
lanes, pavement paintings, and terminal controls might confuse drivers as well. These
mixed influential features on the exit ramp cause existing problems and situations more
multifaceted. This study processes to quantitatively evaluate the safety features of two
issues.
1.2.1 Freeway Diverge Areas
None of the studies for the past two decades focused on the lane balance problems on the
freeway diverge area which directly connects the mainline segment to exit ramps.
AASHTO Green book defines the lane balance as the number of approach lanes on the
highway after the exit should equal to the number of lanes on the highway beyond the
exit, plus the number of lanes on the exit, minus one. The fundamental arrangement of a
20. 5
freeway segment is the designation of the basic number of lanes which should be
consistency along the freeway. The basic number of lanes might be added or deleted
where the traffic volumes increase or decreased at some degrees. On the freeway diverge
area, part traffic on the freeways beyond the exits leave the freeway and so that the
volumes change in this segment. The one or two outer lanes may drop to the exit lanes so
that the number of lanes on the freeway mainline sections did not balance ahead of or
after the exits. This would not only cause confusions for the exiting vehicles but also for
the continuing vehicles on the freeways. The lane-balanced and unbalanced exit ramps
require drivers take different maneuvers. Even considering the lane balanced exit ramps
or the unbalanced exit ramps respectively, different numbers of exit lanes on the freeway
segments have different characteristics as well. The study would focus on the lane
balance issues which are innovated and original in the freeway exit ramps studies.
The exit ramp type is defined by the number of lanes used for traffic to exit
freeways. They could be single-lane exit ramps or two-lane exit ramps. After reviewing
the sites in the whole Florida interstate highway systems, expressways, turnpikes and
parkways, four types are used frequently for the state. So four different groups based on
the types of exit ramps are characterized for the study. For convenience, they were set as
Type 1 exit ramps (Type 1), Type 2 exit ramps (Type 2), Type 3 exit ramps (Type 3) and
Type 4 exit ramps (Type 4) respectively. The definitions of each type of exit ramp are
described below and illustrated in Figure 1 through Figure 4 below.
1) Type 1 exit ramp Parallel from a tangent single-lane exit ramp shown in Figure 1:
It is a full width parallel from tangent that leads to either a tangent or flat exiting
curve which includes a decelerating taper. The horizontal and vertical alignment of
21. 6
type 1 exit tamps were based on the selected design speed equal or less than the
intersecting roadways. No direct drop lanes on the mainline sections beyond or after
exits. The outer lane with a tangent would be a drop lane to the exits and become the
though lane on the exit ramp section.
2) Type 2 exit ramp Single-lane exit ramp without a taper shown in Figure 2: This
type is when the outer lane becomes a drop lane at the exit gore forming a lane
reduction. A paved and striped area beyond the theoretical gore were present at this
type of exit ramps to provide a maneuver and recovery area. No additional lane was
added when compared with Type 1.
3) Type 3 exit ramp Two-lane exit with an optional lane shown in Figure 3: This type
includes two exit lanes while a large percentage of traffic volume on the freeway
beyond the painted nose would leave at this particular exit. An auxiliary lane to
develop the full capacity of two lane exit was developed for 1500 feet. The entire
operations in this type of exit ramps took place over a significant length of the
freeway in most cases. The outer one of the two exit lanes directly drops to the exit
ramps. But the inner lane of the two exit lanes, which is an optional lane, has two
alternatives by continuing on the freeway or running off the freeways.
4) Type 4 exit ramp Two-lane exit without an optional lane is shown in Figure 4: It is
used where one of the through lanes, the outer lane, is reduced and another full width
parallel from tangent lane developed with a taper is also forced to exit. It differs as
from Type 3 exit ramps as Type 4 exit ramps do not enclose the optional lane.
22. 7
From the figures, they indicate that Type 1 and Type 3 are lane balanced ones
while Type 2 and Type 4 are lane unbalanced exit ramps. In practice, there is a type 5 exit
ramp which is a two-lane exit ramp without optional lane and without a taper, which is
not widely used in Florida and the samples we found are too small to draw defensible
conclusions.
FIGURE 1. Type 1 Exit Ramp: Parallel from a Tangent Single-lane Exit Ramp
23. 8
FIGURE 2. Type 2 Exit Ramp: Single-lane Exit Ramp without a Taper
FIGURE 3. Type 3 Exit Ramp: Two-lane Exit Ramp with an Optional Lane
24. 9
FIGURE 4. Type 4 Exit Ramp: Two-lane Exit Ramp without an Optional Lane
1.2.2 Entire Exit Ramp Sections
The entire exit ramp section from the beginning of pointed nose, which diverge
the freeways and ramps, to the end of ramp terminal is another research concern. This
study is to acquire an adaptable, practical, and integral transition system from the freeway
to the secondary crossroad. Ramp designing contains many possible influential factors
such as ramp configurations, ramp design speed, lane numbers, ramp terminal control
types, ramp length, or ramp curvatures.
Ramp configurations are usually considered as the ramp types in the previous
studies. Bauer and Harwood’s (3) analyses show that diverse ramp configuration designs
have significantly dissimilar impacts on the safety performance especially for off ramps.
Typically various configurations accommodate to the ramp sites by the features of site
locations. In order to clearly indicate the safety performance with related parameters, the
ramp configuration was considered one of them. Four widely used configurations in
Florida are identified in the study. They were briefly defined as diamond exit ramps, out
25. 10
connection exit ramps, free-flow loop exit ramps and parclo loop exit ramps. From Figure
5-A to Figure-D illustrate the four ramp configurations which describe the shape of
ramps in simplified modes.
Figure 5-A is a diamond exit ramp which is a one-way road with both left and
right turnings at terminals. Figure 5-B is an out connection exit ramp which only supplies
the single turn at the ends of exit ramps.
Figure 5-C and 5-D are two classic loop ramps that make at least 270 degrees of
turning movements to the secondary roads. Free-flow loop ramps are designed as full
cloverleaf ramps with or without collector or distributor roads on the ramp segments. The
parclo loop exit ramp is a partial cloverleaf ramp which has a preference to provide an
arrangement setting the right exiting vehicles. This configuration could give either one or
two turning ways at the exit terminals while the exit ramps’ location meets the
requirements to provide enough design radii, space, curvatures and related geometric
criteria.
27. 12
1.3 Research Objectives
The objective of the study is to evaluate safety performances of different exit
ramps used in Florida and nationals. The research objectives can divide into two parts.
The first one is to evaluate how the impacts of different exit ramp types on the safety
performance of freeway diverge areas. The second one focuses on identifying the
different factors contributing to the crashes happening on the exit ramp sections. This
study developed quantitative evaluations and comparisons on the freeway diverge areas
and exit ramp sections accordingly.
Statistical analyses among four types of exit ramps on the freeway diverge areas,
parallel from a tangent- single-lane exit ramp, single-lane exit ramp without a taper, two-
lane exit ramp with an optional lane and two-lane exit ramp without an optional lane, are
conducted. The four different ramp configurations and other parameters on the entire exit
ramp sections are examined as well to find their effects on the safety features for the
entire exit ramps. Base on the result in this study, it would be a way to judge what kind of
geometric, traffic, and combinations of the correlated conditions have the best safety
performance on the freeway diverge sections and entire exit ramp sections. This is also a
practical step to guide the methods of safety improvements on freeway diverge areas and
exit ramp sections. The results could also be applied in design guidelines, handbooks or
research projects.
1.4 Research Approach
Previous studies were revised and potential safety measurements for this study
were selected. Crash histories at selected freeway segments were investigated and crash
28. 13
data were collected. Cross-sectional comparisons were conducted to compare the safety
impacts the two segments of freeway diverge areas and exit ramp sections respectively.
On the basis of the collected crash data for the diverge areas, statistical analyses were
conducted to quantitatively evaluate the impacts of different types of exit ramps on the
safety performance of freeway diverge areas and different ramp configurations on exit
ramp sections. In addition, crash prediction models were developed to identify the factors
that contribute to crashes at selected sites. The results of this study will help
transportation decision makers develop tailored technical guidelines governing the
selection of the optimum exit ramp to be used on our freeways and recommend the
optimal design characteristics both on the diverge areas and the entire exit ramps.
1.5 Research Tasks
In order to achieve research purposes, following tasks were made to obtain
rational conclusions. Existing methods and technologies were gathered to reach the goals
of two research subjects. Possible applications were identified the in the research fields.
After summarizing these potential measurements, useful method from previous studies
were selected and detailed developments were conducted for this study. These methods
and developments need to be feasible to perform and practice. The analysis process
should be correct and reasonable. The results base on this study can be applied to other
exit ramp managements. In this study, four steps containing ten main tasks were
categorized to well organize the research procedures as following:
1) Step 1:
• Task 1: Literature Search and Review;
• Task 2: Field Observation;
29. 14
• Task 3: Field Operation Plan;
2) Step 2:
• Task 4: Site Selection;
• Task 5: Field Data Collection;
• Task 6: Data Reduction;
3) Step 3:
• Task 7: Data Analysis;
• Task 8: Research Results;
4) Step 4:
• Task 9: Conclusions and discussions;
• Task 10: Final Report.
Step 1, classifying the first three tasks, mainly focused on going over the past
safety performance measurements and methods, discovering the possibility of the
potential applications, viewing sites, building up study purposes and arranging work
plans. Step 2, from task 4 to task 6, gathered the site data and arranged them to do the
further analysis. This step is a very tough and tedious one since the study needs large
sample sizes to get reasonable results and all the related data need to be found at available
methods. The third step applied the main approaches to conduct safety evaluations
procedures. The final step concluded the research findings and summarized the whole
research study in the final report in the thesis. These four steps contained all the needed
tasks for this research study and have been proved successfully in past projects.
1.6 Thesis Outline
This thesis contains six chapters, one reference part and one appendix section at
all. Chapter 1 provides an overview and the research objective for the study. Chapter 2
presents a brief description of previous study and related topics for the research subjects
30. 15
in order to acquire an advanced study. Chapter 3 summarizes the techniques applied in
this project, which included a detailed description of the proposed methods and basic
concepts using in data analysis procedure. Chapter 4 describes the procedures of site data
collection and reduction. Chapter 5 presents the procedures of crash analysis, results of
crash investigation and impacts of selected variables. The final chapter, Chapter 6,
emphasizes the summaries, conclusions and recommendations from this study to assist
other agencies, public works, engineers better understanding the safety issues of the
freeway diverge areas and entire exit ramp sections. The list of references follows the
final chapter and one appendix lists the sample site photos for the research subjects to
illustrate different exit ramps applied in the State of Florida.
31. 16
CHAPTER TWO
LITERATURE REVIEW
This chapter summarizes previous studies and findings related to the project. Two
parts, diverge areas on the freeway mainline sections and entire exit ramp sections,
consist of the study subjects are discussed respectively to describe the integral
evaluations of the previous discoveries in the research field.
2.1 General Freeway Guidelines
Freeways provide the primary transportation networks and roadway systems by
achieving the highest functional hierarchy of highway systems by design purposes. The
grand reliance on the facilities requires safer and more efficient implements on existing
freeways and their related infrastructure systems to improve the safety performances.
The AASHTO Green Book (A Policy on the Design of Geometric Highways and
Streets) (12) designs the key requirements on the highway facilities such as the ramps,
interchanges and frontage roads. In order to accommodate high traffic demands of safety
on freeways, exit ramps and secondary crossroads, designing proper handlings of
freeways and ramps are essential in the highway systems. Many factors impacts safety
performances on freeways and their adjacent facilities. Also, the crash is a direct index on
safety evaluations. The wide variety of site geometric conditions, traffic volumes,
32. 17
highway types, and design layouts could eliminate or increase conflict points at some
degrees while crashes related to conflict points at some levels.
During the past several decades, some design regulations mentioned the
importance of safety performance of freeway diverge areas and exit ramp sections.
Current state and national literature reviews include freeway and ramp management
handbooks, guidelines of optimal geometric designs from Highway Capacity Manual and
AASHTO, reports from National Cooperative Highway Research Program (NCHRP) and
Different State Departments of Transportation, proceedings from Transportation
Symposium, papers from transportation engineering journal, etc. Additionally, useful
books and publications were also collected to do analysis in the project and current rules,
regulations, standards, and practices in Florida were evaluated and summarized for the
two research subjects in the sequent sections.
2.2 Freeway Diverge Areas
During the past several decades, though some studies have mentioned the freeway
exit ramps, none of them focused on the impacts of the number of lanes used by traffic to
exit freeways. Closely reviewed the literature, there is little direct paper or evaluation in
safety performance of diverge areas which has been researched before. In previous
studies, ramp types are usually defined by ramp configurations such as diamond, loop,
directional, outer connector, and other instead of the lane balance issues for the diverge
sections. Though many design handbooks and guidelines focused on the relationships of
geometric elements and collision causes, they did not mention the influence of lane
balances on the freeway diverge areas.
33. 18
In 1969, Cirillo et al. (9) did a purely innovative investigation on the traffic crash
study on the interstate system for that period. They found that the relationship could be
established between fatality crashes and geometric elements. The geometric factor
included several types of interchanges, paved shoulders, sight distance, delineators,
surface types, and other variables. After about thirty years, Garber and Fontaine (7)
developed a guideline given name as “Guidelines for Preliminary Selection of the
Optimum Interchange Type for a Specific Location” to search the operational and safety
characteristics for the optimal ramp design. The newest instruction is the ITE “Freeway
and Interchange Geometric Design Handbook” edited by Joel (17) in 2006. The
handbook focuses on geometric and operational characteristics of freeways and
interchanges. The book recognized that geometric design procedures for freeways and
interchanges may vary. It also provides the evidence that is valued as an accompaniment
of the AASHTO Greenbook (12), the Highway Capacity Manual (HCM) (13), and
Traffic engineering Handbook 5th
Edition (16).
In 1998, Bared et al. (1) developed a generalized regression model known as
Poisson Model to estimate the crash frequency for the deceleration lanes plus the entire
ramps as a function of ramp AADT, mainline freeway AADT, deceleration lane length
and ramp configurations. The ramp configurations considered in that study include
diamond, parclo loop, free-flow loop, and outer connecter. The model showed that the
crash frequency on freeway ramps increased with the ramp and freeway AADT and
decreased with the increase of the deceleration lane length. A 100 ft increase in
deceleration lane length will result in a 4.8% reduction in crash frequency. The
coefficients of the model also indicated that off-ramps suffered from more crashes as
34. 19
comparing to on-ramps. However, this study did not consider the number of lanes using
for traffic leaving freeways. This problem is essential in the driving behavior because the
balanced lanes and unbalanced lanes require drivers to take different operating manners.
Later, Bauer and Harwood (3) built up several regression models to determine the
relationships between traffic accidents, highway geometric design elements and traffic
volumes. The statistical modeling approaches used in the research included Poisson and
Negative Binomial regressions. It was found that the ramp AADT explained most of the
variability in the crash data report at selected sites. Other variables found to be significant
in crash prediction models contained freeway AADT, area type (rural, urban), ramp type
(on, off), ramp configurations, and lengths of ramp and speed-change lane (deceleration
lanes, acceleration lanes). Other models have been built to find out the functions of
different variables in different kind of models. The independent variables are crash
frequencies on the speed –change lanes, entire ramp sections, the selected ramp sections,
and speed change sections plus the entire ramp sections. The best fit model was the one
that combined crash frequency for the entire ramp, together with its adjacent speed-
change lanes. The significant influential factors included area type, ramp type, ramp
configurations (diamond, loop, outer connector, others), length of speed-change lanes,
and length of the entire ramps. Another main finding is that models for the total crashes
achieved much better than those for the only fatal and injury crashes. The models
combined the on ramps and off ramps, and acceleration lanes and decelerations lanes. Off
ramps usually occur more crashes than on ramps as mentioned before; the requirements
for the length, curve, and design guidelines of acceleration length and deceleration lanes
vary; ramp configurations could not be the ramp types on the diverge areas. Without
35. 20
judging these factors, models would decrease the accuracy of the conclusions, narrow the
applications of the results and could not disclose the real situations. But this study
provided reasonable methods such as the regression models which have been proved
strappingly employed in the safety studies (11, 19, 25, 26, 27, 28, and 31).
One main program is called Highway Safety Improvement Program (18) that can
help states decrease the number of crashes and provide optimal ways for arranging,
applying, and estimating safety plans. From side to side of the introduction, all correlated
issues to improve highway safety are recognized, measured, implemented and evaluated
highway planning, designs, constructions, maintenances, and operations. Moreover, past
studies emphasized the safety evaluation based on previous mentioned methods such as
regression models or statistical tests that have been proved as useful methods in the safety
studies. Following paragraph listed the wide applications of these methods.
Sarhan et al. (11) designed the approach to help achieving the optimum predictive
models. The model related to the length of acceleration and deceleration lanes based on
expected collision frequency. Joanne and Sayed (25) undertook the study to quantify the
relationship between the design consistencies on the roadway safety. The generalized
linear regression approach is used for model development as a quantitative tool for
evaluating the impact of design consistency on road safety. Garcia et al. (19) analyzed
different deceleration lengths as functions of exit trajectory types, speeds, and
localization. Munoz and Daganzo (26) predicted the queued length at a wave speed about
13 mph in congested traffic by KW model. This method is widely used in the safety
evaluation of intersections as well as freeway sections. Maze et al. (27) analyzed the
TWSC expressway intersection for crash rates, crash severity rates and fatal crash rates
36. 21
by Poisson regression models. Keller et al. (28) divided crashes by different types as
angle, left-turn, head-on, rear-end and pedestrian/bicycle by linear regression models
while speed limits were found to be important. Bernhard et al. (31) ranked the locations
and the estimated benefits of improvement by assigning fatal, injury and PDO crashes.
Hypothesis tests were conducted with normal distribution with high number of crashes
and Poisson distribution with a low number of crashes. The statistical tests were usually
employed to find crash-prone sites in identifying some sites as hazardous at some a
particular level of confidence. In fact, the level of confidence is that 100% minus the
Type I error. Type I error is the percentage that mistakes the safety sites for hazardous
sites. Another Type II error is the percentage that mistakes the hazardous sites for safety
sites. They concluded that the program would benefit to public traffic to make the
possible efforts in order to improve the safety studies.
Other studies focus on revealing the geometric, traffic, or related influential
values to the mainline sections separately. Rakha and Zhang (20) modeled a total of 34
different weaving sections to estimate the traffic volume at weaving sections including
merge and diverge areas at the appropriate boundaries on freeways. The paper
demonstrated that the volume estimated by the model had a significant effect on drivers’
behavior in the mainline weaving sections. Abdel-Aty et al. (22) tested various speed
limits to evaluate the safety improvement on a section of Interstate 4 in Orlando, FL.
Real-time crash likelihood was calculated based on split models for predicting multi-
vehicle crashes during high-speed and low-speed conditions. The improvement was
proved in the case of rising medium-to-high-speed regimes on the freeway. The paper
recommends that the speed limit changes upstream and downstream should be large in
37. 22
magnitude (15mph) and implemented within short distances (2miles) of the diverge
locations. It makes obvious that speed limit have some specific effects on the collisions
from the upstream to downstream of diverge areas on the freeways. Cassidy et al. (24)
noticed the problem that queuing from the segment's off-ramp spilling over and
occupying its mandatory exit lane comes up frequently. The situation delayed the
mainline vehicles as well and would increase weaving conflicts. Janson (8) examined the
relationship of ramp designs and truck accident rates in Washington State plus a
comparison to limited data from Colorado and California. The paper grouped freeway
truck accidents by ramp type, crash type, and four conflict areas of each diverge ramp.
The crash data were compared for these groups on the basis of number of truck crashes
per location and per truck-mile of travel. The conclusion is slight different from generally
belief that a ramp with a lower accident rate per truck trip due to low truck volumes may
still be a high-risk site. But these results could not represent the real conditions if applied
to all the passenger cars. The higher crashes number might still be constant with high
volume since truck volume is really low and have the specific feats itself.
One research study, concerning on the number of lanes used by traffic exiting
freeways was conducted by Batenhorst (10). The paper, “Operational Analysis of
Terminating Freeway Auxiliary Lanes with One-Lane and Two-Lane Exit Ramps: A
Case Study”, used three simulation software packages, the Highway Capacity Software
(HCS), CORSIM and Simtraffic on the operational analysis of weaving area at twenty
locations by the level-of-service. The range of traffic and geometric conditions among the
twenty sites varied. The findings of the case study suggest that a one-lane exit ramp may
afford the best traffic operations apart from weaving length. The experience gained from
38. 23
the case study is to give support to traffic engineers to design efficient freeway facilities
and to help researchers understanding the operational effects of geometric design. Even
though this study considered exit lane numbers on the freeway diverge areas, the better
level-of- service could not necessarily stand for better safety performance, and these two
might have opposite results in some cases.
Based on the studies mentioned before, the impacts of exit ramp types on the
safety performance of freeway diverge areas have not been well studied or documented
until recently. Several previous studies have evaluated the safety impacts of different
ramp configurations such as diamond, loop, directional, outer connector, and other.
However, these studies have not considered the lane balanced problems on the diverge
areas to regulate the number of lanes that shall be used for traffic to exit freeways.
2.3 Exit Ramp Section
The entire exit ramp section is another concern in this study to provide a
comprehensive evaluation of the safety performance on freeway exits. Ramps are all one-
way roads with one or more legs at terminals to connecting secondary crossroads.
Different involvements of design speeds, configurations, speed differences among
freeway and ramp section, ramp lengths or the direct connection features determine
different exit ramps which have dissimilar safety effects. Some studies have focused on
exit ramp sections and prior conclusions were described below.
Lord and Bonneson (2) calibrated predictive models for different ramp
configurations at 44 selected sites. The ramp design configurations addressed in this
study included diagonal ramps, non-free-flow loop ramps, free-flow loop ramps, and
39. 24
outer connection ramps. The non-free-flow (parclo flow loop) ramp experienced twice as
many accidents as other types of ramps Bauer and Harwood (3) as mentioned before
modeled the Negative Binomial regression model on the entire ramp section as well and
concluded that diamond ramp have slight less crash frequency comparing to other ramp
types when other influential variables remain constant. At the same year, Khorashadi (4)
used another method known as ANOVA test to forecast the relationship among ramp
configurations, geometry parameters and crash frequencies. This study found that the
geometric elements had much weaker impacts than the ramp configurations. McCartt et
al. (6) examined 1,150 crashes occurring on heavily traveled urban interstate ramps in
Northern Virginia. The three major common crash types, run-off-road, rear-end, and
sideswipe, accounted for 95% of total crashes. The countermeasures mentioned in the
study included increasing ramp design speed, increasing curve radii, installing
surveillance systems such as detectors, cameras, and advanced message signs.
Abdel-Aty and Huang (21) explored an origin-destination survey to customers on
the central Florida’s expressway system. The distance traveled to exit a ramp did not
depend only on the spacing between ramps, but also on other factors, such as the trip
purpose, vehicle occupancy, driver’s income level, and E-Pass implementation when the
vehicle was equipped with an electronic toll collection system. A main finding was that
the guide signs beyond the expressway exits had an important impact not only on
unfamiliar travelers but also on the experienced drivers. Though it was a little count-
intuitive, the result shows different design features on diverge areas would have an effect
on familiar drivers as well. Hunter et al. (23) conducted field observations on speed
relationships between ramps and freeways by videotaping. Notable conclusions were
40. 25
drawn that vehicle speeds on exit ramps were much higher than the post speed limit.
Since the big difference between the ramp post speed limit and operating speed, some
unfamiliar drivers might slow down the speed while some familiar drivers might enter the
exit ramp at a high speed relative far above the limit speed. That might be a vital reason
why rear-end crashes account a large percent of crashes in the ramp sections.
Some studies focused on the connections between different influential factors
which could be the ramp volumes, configurations, crashes, curvatures, and so on. These
studies comprised Newell’s (29) “Delays caused by a queue at a freeway exit ramp”,
Shaw and Mcshane’s (30) “Optimal Ramp Control for Incident Response”, and Hunter et
al.’s (34) “Summary Report of Reevaluation of Ramp Design Speed Criteria”. Newell
clarified that the graphical solution is more clearly illustrating practical issues. Shaw and
Mcshane attended to optimize some measurements on the crashes to minimize the crash
disruption. Hunter et al.’s concluded that ramp design speed should larger than 50% of
freeway speed. This conclusion accommodated to Hunter et al.’s (23) result that
operating speed on the exit ramp is higher than the post speed limit.
It is obvious that many studies defined ramp configurations as ramp types. The
conclusions included that free-flow ramps have more crashes than others, increasing
ramp volume might increase crashes, the post speed limit on the ramp has some impacts
on both local/familiar drivers or unfamiliar drivers and the operating speed is usually
much higher than the post speed. Even several useful results are made on the exit ramp
sections, but few consider the following two issues in the safety effects, ramp terminal
treatments and ramp lane changing named widening on the exit ramp segment. Widening
in this study is defined as the number of lanes changing after the pointed nose or in the
41. 26
middle of the entire ramp. The definition of ramp terminal treatments in “Ramp
Management and Control Handbook” is those can be implemented at ramp/arterial
connections as to better manage traffic exiting the ramp facility. They normally solve the
specific problems that occur at the ramps or arterials. Diverse terminal control strategies
have the potentials to affect operations on the exit ramp and adjacent arterials. Ramp
terminal treatments implemented at exit ramps could reduce queue spillback from the
secondary roads, decrease the potential for collisions on the freeway at the back of the
queue, and improve traffic flow and safety on or near ramp facilities. Typically four
strategies are broadly employed, signal timing improvements, ramp channelization,
geometric improvements, and signing or pavement markings improvements.
The advantages of using ramp terminal strategies are to better coordinate with
ramp terminal signal timing, to offer sufficient storage space either for left turn or right
turn vehicles and to accommodate consistently on both exit ramps and secondary
crossroads. The method of signal timing adjustments aims to prevent queue spillback to
the freeway facility beyond exit ramps. Ramp channelization can increase capacity,
supply enough storage space or a separate lane adjacent to the broad-spectrum lane, and
delineate separate traffic movements. Geometric improvements manage sight distances,
horizontal and vertical curves, and any other geometric deficiencies. Signing and
pavement marking improvements deal with guiding motorists of downward conditions
and facilitating vehicle movements. Implementations of ramp terminal treatments
reducing delay and queuing length, decreasing conflict points, enhancing safety and
minimizing impact both on upstream and downstream highways and arterials. The
functions vary by implemented treatments. Alternatively, negative impacts with different
42. 27
terminal treatments varied by the each site. Those might increase trip length, cause
supplementary travel time, or extend queuing and signal delay. Accordingly, different
terminal control designs or different combinations of terminal designs might have various
powers on the safety aspects of entire ramp sections. Retting et al. (32) endeavored to
reduce urban crash rate by building potential countermeasures to the five most common
crash types in fourteen cities. For the vast combinations of the crashes about (69%-81%)
in each type via dissimilar cities, the author suggested that signal timing, sign visibility,
sight distances would be the improvement measure to enhance safety in general solutions.
This study would consider the terminal control methods to expose the impacts of
terminal control types on safety. One study conducted by Bared et al. (5) comparing
crashes between single point and tight diamond ramps related crashes on the cross road
only. Single point diamond interchange is diamond ramp free-connects to the cross roads
No triangle median occurs at the terminals. Tight diamond interchange differs to single
point diamond interchange since there is a triangle median separation at the termination
to split different traffic movements for left turns or right turns. Crash data were
subtracted from 27 tight diamond sites and 13 single point sites in Washington to build a
Negative Binomial model of total crashes on the exit ramp and cross-road flow. However,
the safety comparison did not reveal a significant difference between the two types of
interchanges for total crash. This study only compared one terminal treatment as ramp
channelization; however the sites number here is not sufficient enough to do a regression
model. The lanes widening is another issue as one of the strategies in the exit ramps.
Several ramps from the field observations show that it will wide to two or more lanes
after the pointed noses which separate the freeway mainline sections and ramp sections.
43. 28
CHAPTER THREE
METHODOLOGY
This chapter describes the selected methodologies which would be applied in this
research study. The principles for selecting the main methods concern on how the
functions are, whether they are practical or easily applied to the data base, and what the
potential results are. The research subjects included two parts defining as freeway diverge
areas and entire ramp sections separately. After reviewing prior studies, guidelines,
handbooks and related researches, useful methodologies and important parameters are
identified for the safety analysis. The main approaches used included the cross-sectional
comparison method, hypothesis tests, and generalized regression models.
3.1 Crash Frequency and Crash Rate
Crash frequencies or crash rates are two indicators that are generally used in the
safety studies to compare different treatments or groups. This research project would
calculate both of them for further analysis.
3.1.1Crash Frequency
Crash frequency is the real number of crashes that have happened at a certain
location or segment in a particular time or time interval. It is commonly used for several
44. 29
benefits. Firstly, the crash data are easy to get and simple to calculate. Next, the meaning
behind is straightforward so that governmental officials, engineers, and public could
understand it readily. The third virtue is that it could represent diverse selected places in
one parameter and could change directly while the selected lengths or vicinity of the
segments changed. The resource of the noticed crashes is only from police long form
crash report which describes specific features for each crash. Florida Traffic Crash
Analysis Report (CAR System) provides detailed crashes and updates the database each
year.
The mathematics mean value of crash frequency is labeled as the average number
of crashes. With different groups or managements, the average number of crashes was
calculated based on the number of sample sites. In statistical assumption, the mean value
normally is the most proficient estimator for the population groups. The following
equation defines the average crash number with a specific group, C, as:
N
c
C
n
i
i∑=
= 1
(1)
Where,
C =average number of crashes for the sites with a particular group;
ic = number of crashes at site i in the group;
N = total number of sites within the group.
For the diverge areas, four exit ramp types are classified so that four groups were
chosen to compare the mean values of crash frequency. Besides, three additional values
stand for the accuracy and variations of the mean values. The median value is the middle
rate in a series of data that have been ranked in order to scale and part the sites into two
45. 30
identical fractions. The maximal and minimum values are the largest and smallest crash
number in a specific group. The four additional variables imply the variation of the each
sample and the mean values. If the median value is much larger or smaller than mean
value, the distribution curves of crash number indicate biasness in the judgment. In order
to get reasonable mean value, usually the four values, mean, median, maximum, and
minimal are calculated respectively to represent the distributions of the number of crashes.
3.1.2 Crash Rate
In this study, crash rate is defined as crashes per million vehicles per vehicle
miles traveled for a specific section. Crash rates are used as a criterion for more truthful
for segments under the same geometric and traffic conditions to narrow the impacts of
these important factors. The crash rate, r, for a particular freeway segment can be
calculated in the following formula:
LVT
A
r
×××
×
=
365
000,000,1
(2)
Where,
r = crash rate at a freeway segment (crashes per million vehicles per mile);
A= number of report crashes (crashes per year),
T= number of years;
V= average daily traffic volume (vehicles per day);
L= length of the freeway segment (miles).
It is believed that the crash frequency tends to increase as the average daily traffic
(ADT) goes up even through many other factors affecting the situation. In this study, the
corresponding ADT for each site was obtained from annual Florida traffic information
46. 31
CDs. The time frame is determined for the database in continuous years when site
characters have not been changed in the period. The average crash rates, which are the
arithmetic means of crash rates, were calculated for the four groups in the freeway
diverge areas. The statistical assumption is similar to the average number of crash as
mentioned before. The average crash rate, R, is defined as:
N
r
R
n
i
i∑=
= 1
(3)
Where,
R =average number of crashes rates with a particular group;
ir = number of crashes rates at segment i in the group;
N = total number of sites within the group.
The median, maximal, and minimal values are measured as well to observe the
distributions of crash rates.
3.2 Crash Type and Crash Severity
Since the objectives are to estimate the safety impacts among 4 exit ramps on
diverge area and along the entire exit ramp sections, the total number of crash, crash
severity, and crash types having the highest percentages to the total crashes were chosen
for each group. Crash severity that is widely used in the safety analysis can be classified
to two categories: PDO (Property-damage-only) and injury/fatal crashes.
47. 32
3.2.1 Crash Type
In the crash database maintained by FDOT, crash type is defined by the first
harmful event of at-fault vehicles. The comparison of crash types will help to identify
driver behaviors that are related with the types of exit ramps. A total number of 40 crash
types are concluded in the Florida’s CAR system. The most three highest crash types
occur on diverge areas are rear-end crash, side-swipe crash and angle crashes. Rear-end
crash and side-swipe crash counted for about 60% of total crashes, 46% rear-end crashes
and 16% side-swipe crashes. The target crash types on the exit ramp sections are rear-end
crash, angle crash and side-swipe crash as well.
Rear-end crashes which regularly take place while the first vehicle stopped or
suddenly slowed down and the following vehicle had a collision with the first vehicle in
the rear piece of the vehicle. The severity of these crashes can range from minor to severe
depending on the speed of the following vehicle that hits the first vehicle.
Sideswipe crash is another common crash type in this study and usually happens
when changing lanes, misdirection of exiting freeway, or vehicle weaving. The severity
of this type is also ranged from minor to severe.
The one vehicle crossing the passageway or changing directions in the road might
conflict with another vehicle. They are frequently set as angle crashes. Angle crashes are
also commonly noticed on the misdirected vehicles. The severity of the crashes usually
causes severe crashes than rear-end crashes. Comparing to other types, the three types
mentioned above is the most concerned types in this diverge area and exit ramp sections
48. 33
3.2.2 Crash Severity
Usually, crash severity level is recorded for each police reported crash. Three
major levels of crash severity generally defined in the study can be classified to three
categories:
1) Property-damage-only (PDO) crashes;
2) Injury crashes;
3) Fatal crashes;
In a property-damage-only crash, only properties are damaged but no person is
hurt; in an injury crash, at least one person is lightly hurt because of the crash; in a
fatality crash, at least one person is dead within 90 days after the crash which was the
most concerned problems in many other studies and this study as well.
3.3 Cross-Sectional Comparison Approach
The cross-sectional comparison analysis is satisfactory to provide adequate and
reasonable consequences. It is long believed that cross-sectional approach is a logical and
efficient technique of judging the safety effects. The cross-sectional method has been
proved valuable and has been performed on a number of prior studies that involved
median alternatives, right turns followed by u-turn to direct left turns and truck accidents
at freeway ramps. In transportation fields, traffic engineers have experimental judgments
as long as the most influential factors such as section length, average daily traffic (ADT),
speed, ramp length are well controlled. Cross-sectional analyses to evaluate different
treatments are fairly reliable for the results. Briefly, reliable conclusions could be got
within this measurement. In other words, this method compares the safety of two
49. 34
different groups of sites with and without the treatment under investigation. It is
necessary to select similar geometric conditions in order to get the reliable results in
comparing site histories of different types.
In this study, cross-sectional comparison was conducted to measure freeway
diverge areas with different types of exit ramps and exit ramp sections with four
configurations. This approach involves comparing crash frequency, crash rate, crash type,
and crash severity of a group with a treatment, to that of a group of with other treated
sites. As mentioned before, the selected freeway segments were divided into four groups
based on the types of the exit ramps. On the basis of the collected crash data, statistical
analysis was conducted to quantitatively evaluate the safety impacts of different types of
freeway exit ramps.
The major assumption behind this comparison was that all other characteristics in
the sites remained the same during the study period. The significant geometric and
control factors considered in this study included deceleration length, ramp length,
average daily traffic(ADT), posted speed limit, number of lanes in the freeway, surface
conditions, shoulder conditions and so on. By comparing crash through statistical testing,
conclusions could be reached regarding the relative safe treatment among different
treatments.
3.4 The Hypotheses Test
Hypothesis tests are utilized to test whether the observed differences of the
selected variables such as mean values, variance values, or proportion values between
two or more groups have significantly variation in a statistical term. Assumptions of
50. 35
observing the sample data were calculated in the hypothesis testing to measure the
suppositions whether they have under similar features. If the results did not support the
assumptions, then the assumed suppositions are considered doubtful. The formula of
hypothesis testing includes two competing statistical hypotheses: a null hypothesis (H0)
and an alternative hypothesis (Ha). The null hypothesis is a postulation that one parameter
of a population is true under sufficient statistical terms. The contrast postulation of the
null hypothesis is an alternative hypothesis. It is assumed that all the other situations that
did not covered by the situations under null hypothesis.
The test result is to reject or fail to reject the null hypothesis under the specific
conditions based on the statistical distributions while they reply upon Z, t, F or χ2
distribution. The decision of whether rejecting the null hypothesis is based on the statistic
value range on the statistical distribution mentioned before at a statistical term named as
the significant level α. Typically the level of confidence as 1- α is applied to determine
the statistical confidence instead of α. The procedures of conducting a hypothesis test
including four steps:
1) Step 1: Select Null Hypothesis- H0,
Select an Alternative Hypothesis - Ha;
2) Step 2: Determine the level of confidence (1- α)*100%;
3) Step 3: Calculate the statistical value;
4) Step 4: Compare the statistical value to the critical value on the distribution, and
decide to reject or fail to reject the null hypothesis H0;
The following two parts describe the detailed procedures to conduct hypothesis
tests on the equality of two means and the proportionality analysis.
51. 36
3.4.1 Hypotheses on the Equality of Two Means
Mean values of two different populations were tested to get reasonable
conclusions whether to reject or not reject the null hypothesis. The average crash
numbers and rash rates from one group to another group were examined if they are
significantly different. Assumed that two populations say X1 and X2, where X1 has an
unknown mean µ1 and known variance σ1
2
and X2 has an unknown mean µ2 and known
variance σ2
2
. The purpose is to test whether the two populations have the same mean µ1
and µ2. The first step is to build the null hypothesis H0 and an alternative hypothesis Ha:
210 : µµ =H (4)
21: µµ ≠aH (5)
The procedure is based on the fact that the difference in the sample mean, X1, X2, of two
populations of interest with a sample size of n1 and a sample size of n2 separately,
2
_
1
_
XX − will fit the normal distribution of:
2
_
1
_
XX − ~N (µ1 - µ2, σ1
2
/n1 + σ2
2
/ n2) (6)
The second step is to choose the level of confidence. In this study 90% is used and α
equals 10%. The third step is to calculate the statistical value Z0 (n≥25) or 0t (n<25):
2
2
2
1
2
1
21
0
nn
XX
Z
σσ
+
−
= (7)
)
11
(
21
2
21
0
nn
s
XX
t
p +
−
= (8)
52. 37
The final step is to compare the calculated value with the critical value Zα/2 or 2/∂t . The
null hypothesis could be rejected if:
Z0 > Zα/2 or Z0< Zα/2 (9)
0t > 2/∂t or 0t < 2/∂t (10)
If the variance σ
2
, is unknown, it can be replaced by the square of the standard deviation
of the sample size n which is S2
as following:
n
XX
S
i
n
)(
12
−
≅
∑
(11)
If the sample sizes is less or equal to 25, the populations are approximately t distribution
with a pooled variance, 2
ps , based on sample variance 2
1s and 2
2s . The formula is given by:
2
)1()1(
21
2
22
2
112
−+
−+−
≡
nn
snsn
Sp (12)
3.4.2 Hypotheses Tests on the Proportionality Analysis
On the basis of the collected crash data, statistical analysis was conducted to
quantitatively evaluate the crash type and crash severity on the safety effects. The
proportionality hypothesis test was utilized in this study to comparing target crash types
and crash severity between different freeways diverge sections.
Proportionality test is often used to test the significance of the percentages
between two populations or samples. Let p1 and p2 be the proportions of a particular type
of crashes in two different groups. Assuming that the total crash counts in these two
groups are m and n respectively, for testing the null hypothesis:
53. 38
H0: p1 = p2 (13)
Versus
H1: p1 ≠ p2, (14)
H0 can be rejected if:
2/
1122
12
)1()1(
αZ
n
pp
m
pp
pp
Z ≥
−
+
−
−
= (15)
3.5 Statistical Predictive Model
Crash prediction models were developed for this study at selected freeway
segments and entire ramp sections respectively. The purpose to use regression predictive
models is to identify the factors that contribute to the crashes and quantify the effects on
crashes at selected sites. This research project would draw on the generalized linear
regression models to mold crash number.
Generalized linear models have been widely used for modeling crashes at safety
studies (1, 3, 11, 19, 25, 26, 27, 28, and 31) at intersections, roadways or freeways.
Generalized linear models are the expansion forms of the classical linear regression
models. The classical linear regression model assumes that the dependent variable is
continuous and normally distributed with a constant variance. The assumption is not
appropriate for crash data which are approximately Poisson distributed and are generally
non-negative, random and discrete in nature. Numerous previous studies have suggested
the use of Poisson models or Negative-Binomial (NB) Models for modeling crash data (1,
3). The Poisson model assumes that the dependent variable is Poisson distributed. Using
54. 39
a Poisson model, the probability that a particular freeway segment i or an exit ramp
section experiences yi crashes during a fixed time period is given by:
!
)()(
i
y
i
iii
y
e
ypyYp
i µ
µ −
=== , i =1, 2, 3,……, n (16)
Where,
µi = the expected number of crashes for segment i;
yi = the probability that a particular segment i.
A logarithm link function connects µ to a linear predictor η. The link function and
the linear predictor determine the functional forms of the crash prediction model. If the
linear predictor is a linear function of the explanatory variables, the fitted crash prediction
model takes the functional form as below:
)...exp( 22110 ikkiii xxx ββββµ ++++= (17)
Where,
β0, β1,…βk = coefficients of explanatory variables;
xi1, xi2, … …xik = explanatory variables.
If the linear predictor is a linear function of the logarithm of the explanatory variables,
the functional form is given below:
k
ikiii xxx βββ
βµ ...21
210= (18)
The Poisson model assumes that the mean of the crash counts equals the variance.
The assumption is usually too stringent considering the fact that the variance is often
greater than the mean. In this condition, overdispersion will be observed and the
estimated coefficients of the Poisson model are biased. An alternative to deal with the
over dispersed data is to use the negative binomial model. The negative binomial model
55. 40
assumes that the crash counts are Poisson-gamma distributed. The probability density
function of Poisson-gamma structure is given by:
1
1
1
1)(!
)(
)( 1
1
−
+
+Γ
+Γ
== −
− a
i
y
i
ii
ii
aa
a
ay
ay
yYp
i
µµ
µ , i =1, 2, 3… n (19)
Where
yi = the crash count at segment i,
µi = the expected number of crashes for segment i,
α = the dispersion parameter.
The dispersion parameter determines the variance of the Poisson-gamma distribution.
Usually α can be estimated either by the Moment Method or by the Maximum Likelihood
Method.
Two parameters are often used for evaluating the goodness-of-fit of a generalized
linear model. These two parameters are the scaled deviance (SD) and the Pearson’s χ2
statistic. For an adequate model, the two statistics should be chi-square distributed with
(N-p) degrees of freedom, where N is the number of observations and p is the number of
parameters in the model. The scaled deviance equals twice the difference between the
log-likelihood under the maximum model and the log-likelihood under the reduced model.
The scaled deviance can be calculated as:
))log()(log(2 sLLSD −−= β (20)
Where
Ls = the likelihood under the maximum model;
Lβ = the likelihood under the reduced model.
The Pearson’s χ2
statistic can be calculated as:
56. 41
2
1
2
' ∑=
−
=
n
i i
iiy
sPearson
σ
µ
χ (21)
where
yi = the crash count at segment i,
µi = the expected number of crashes for segment i;
σi = the estimation error for segment i.
It is usually assumed that the crash data are approximately normally distributed.
Thus, the scaled deviance SD and Pearson’s χ2
statistic for an adequate model should be
approximately chi-square distributed with (N-p) degrees of freedom, where N is the
number of observations and p is the number of parameters in the model.
57. 42
CHPATER FOUR
DATA COLLECTION
This chapter focuses on illustrating the data collection procedures that include the
selected sites and relative sites information. Both freeway diverge areas and entire exit
ramp sections are reviewed and the criteria for classifying the site segments and segment
lengths are explained. Detailed methods of identifying road sections in FDOT‘s system,
subtracting specific site database, and tackling with the crash data for each site were
depicted in this chapter as well.
4.1 Site Selection Criteria
The study focuses on the safety effects of the freeway diverge areas and entire
exit ramp sections. In order to obtain reasonable results, criteria to identify the site
segments are really important in order to narrow the unstable and unrelated factors. The
criteria were listed below for both freeway diverge areas and freeway exit ramp sections:
1) All the objects are on the freeway diverge areas or exit ramps;
2) Freeways defined here are the highway segments with the highest level of service and
full control of accesses;
3) Only right exit ramps are considered in the sites which means all exits should be at
the right hand of the directions on freeways;
58. 43
4) The impacts of left exit ramps are not incorporated in this study as they have
significant different features to right exits;
5) A sufficient and significant curb, bar, or other facilities in the median separates two
directions;
6) The right-shoulder of freeways and exit ramps should be clear, no sight obstruction,
and no dangerous facilities;
7) The grade variations are smallest so that no grade varieties are considered in both
sections;
8) The freeway segments should be homogeneous segments without large horizontal or
vertical curves distinctions since this research would narrow the other parameters that
not compared;
9) All sites are in Florida States from District one to District seven plus an additional
Florida Turnpikes generally named as District eight.
Two dissimilar sections are selected so that they both have special requirements
for the segments. The following items list the special site requirements at the freeway
diverge areas:
10) The minimal posted speed limit on the freeway mainline section should be larger than
50 mph;
11) The upstream and downstream distances from the deceleration lanes are long enough
so that influential factors up or down from the deceleration lanes are minimal;
12) Deceleration lanes are calculated from the beginning of the taper or widening points
to the painted nose;
59. 44
13) Four different ramp types on the diverge areas have different number of lanes at
freeways, but the research segments remain same.
The exit ramp sections that connect the diverge areas and continue until the
beginning of secondary roads should meet subsequent extra criteria:
14) The exit amp lengths begin from the painted nose and end at the last part of terminals;
15) All exit ramp suggested or post speed limits is larger is 25 than mph no matter the
ramp configurations or ramp length.
Following these criteria ensures that the candidate list of field study sites could be
obtained without low speed limits in the freeway diverge areas and large difference of
speed limits on entire ramp sections. This would make the same characters except the
concentration variables to do the statistical analysis. The lane width is an interesting
parameter in this study so that the lane widths are not necessarily synchronized in the
sites selection procedures. From the field studies, all the preferred segments would go for
the interstate highway systems, expressways, turnpikes, and parkways in Florida.
4.2 Segment Length Definition
Two research sections are defined in this section, the freeway diverge areas and
the entire exit ramp sections. The segment length of diverge areas include the
deceleration areas and the adjacent vicinities that have related effects for traffic exiting or
continuing on freeways. The decision is based on both previous studies and site
observation experiences. The exit ramp length includes the entire ramp sections no matter
the ramp configurations, ramp terminal control types or other factors. No more regions
are taken into concerns as the ramp sections are continuous to the diverge areas.
60. 45
4.2.1 Freeway Diverge Area Length
The freeway diverge segment in this study is a section of freeway which contains
a deceleration lane and its adjacent section. The segment length for the freeway diverge
area consists of two continuous sections, including (1) a 1500 ft section located in the
upstream of the painted nose and (2) a 1000 ft section located in the downstream of the
pained nose. Thus, the length of the freeway diverge segment in this study equals 2500 ft
for each site. The definition of the freeway diverge segment for each type of exit ramp is
also given in Figure 6 through Figure 9. They illustrate the whole study section that
combines the declaration areas and their surrounding areas.
Using different influential distances in the upstream of painted nose could result
in different safety analysis results. If the selected distance is too long, crashes reported for
selected freeway segments may include some mainline crashes which are not directly
related to exit ramps. If the selected distance is too short, however, the selected freeway
segment is not long enough to cover the entire influential area of exit ramps. In previous
studies, the selected influential distance located upstream of the painted nose ranged from
1000 ft to 2000 ft (1, 11, 12). The HCM (13) suggests 1500 ft beyond the painted nose in
the simulation software including Corsim and Highway Capacity Software (HCS). In
addition, the length of deceleration lane at selected diverge sites varies from 26 ft to 918
ft. Our field observations show that, when the distance to painted nose is greater than
1500 ft, the exit ramp type does not impact behaviors of mainline drivers in an obvious
way. Due to these reasons, a 1500 ft section was selected as the influential area located
upstream of pained nose and 1000 ft downstream the painted nose on the freeway
mainline sections.
61. 46
FIGURE 6. Type 1 Exit Ramp Length: Parallel from
a Tangent Single-lane Exit Ramp
FIGURE 7. Type 2 Exit Ramp Length: Single-lane Exit Ramp without a Taper
62. 47
FIGURE 8. Type 3 Exit Ramp: Two-lane Exit Ramp with an Optional Lane
FIGURE 9. Type 4 Exit Ramp: Two-lane Exit Ramp without an Optional Lane
63. 48
4.2.2 Exit Ramp Section Length
The crash frequency is related to the segment length since different distances
might have different effects on the number of crashes when other situations are equal.
Usually, longer distances might have more crash potentials than shorter distances.
Resende and Benekohal (35) did a comprehensive study on the influence of segment
lengths and the geometric variables on crash rates. The paper proved the essences of
different segment lengths.
The entire ramp section is the length of the exit ramp itself. The definition means
that the painted nose is the beginning of exit ramp and the end of terminals is the closing
stages for the exit ramp. It varies slightly from past studies conducted by Lord and
Bonneson (2), Bauer and Harwood (3), Khorashadi (4), McCart et al. (6), and Janson et al.
(8). Some studies excluded the terminal sections from the entire exit ramps. However,
different termination styles would influence the beyond sections as well as the adjacent
sections. Some adjusted the exit ramp sections plus the upstream deceleration lanes. This
study would separate these two continuous sections because the diverge areas and ramp
sections have dissimilar crash features and prominent influential factors. The mixed of
these two might get incorrect results. Even Bauer and Harwood (3) did consider the entire
ramp sections, they ruled out the all the rear-end crashes for the ramps. It might
misrepresent the crash distribution and lead to misunderstand of the other factors to the
rear-end crashes which are generally highly occurred in the exit ramps. As a result, the
clarity of ramp length here uses the definition described before. The following Figure 10
from A to D present the ramp segment lengths for four ramp configurations as mentioned
above.
67. 52
From the four figures, four bold lines added to each one illustrate the study field
for exit ramp sections. Even they have special design patterns as they appear, the
principles are unique. This is intended to obtain useful results and raise the accuracy of
the analysis.
4.3 Selected Sites Information
In this study, crash data were collected at research segments in the State of
Florida. After checking the available sites, the site resources are limited. In this reason,
all the freeways are examined in order to get reasonable sample sites. Following the sites
criteria before, a total of 12 Interstate Highways, 10 expressways, 1 turnpike and 1
parkway are overviewed and sites are collected on these freeways. These freeways
provide high service level with high design standards. Figure 11 below lists the most
important four interstate highways. Interstate Highway 75 (I-75) and Interstate Highway
95 (I-95) are both north-south directions while Interstate 4 (I-4) and Interstate Highway
10 (I-10) are east-west directions. Other highways connect intra-region or inter-regions as
to provide better traffic operations at limited accesses.
Florida divided eight districts for the whole state, from District One to District
Eight. District One through District Seven have their local offices to manage each district
respectively. District eight is the toll roads that are built, managed and maintained by all
Florida areas. FIGURE 12, the District Map, gives an idea about the seven districts
allocation in the Florida. The figure is original from FDOT Community Traffic Safety
Teams (CTST). These selected freeways are dispensed in all the eight districts and Table
1 lists the detailed information of each district.
69. 54
Table 1. FDOT Districts Distributions for Selected Sample Sites
District Number Freeways
One I-75, I-4;
Two I-295, I-10, I-75, I-95;
Three I-10, I-110;
Four I-595, I-75, I-95;
Five
I-4, I-75, I-95,
Bee Line Exp,
East-West Expressway,
Central Florida Greenway Expressway;
Six
I-395, I-75, I-95, I-195,
Dolphin Expressway,
826 State Highway,
Palmetto Expressway,
Florida Turnpike,
Don Shula Expressway;
Seven
I-375, I-75, I-275, I-175,I-4,
Veterans Expressway,
S Crosstown Expressway,
N Memorial Expressway;
Eight
Florida Turnpike,
Polk Parkway;
70. 55
4.3.1 Freeway Diverge Areas
The task of site collection is the most time-consuming and tedious work in this
study. Hundreds of sites are available and each site needs to check patiently and review
carefully to make sure all the related data are correct. Area photos for each site were
pulled together. However, some sites are under reconstructions or have been closed for
some time during the study period. Some sites did not have detailed site information such
as AADT, especially at some expressways. Since some sites did not have full information,
they did not meet the sites requirements as mentioned before. These sites might be large
curvatures, low post speed limit as 45 mph, grade variation much higher than the expect
one and so on. After reviewing the area photos for freeway diverge areas in the State of
Florida. 424 sites were selected for the freeway diverge segments. Among these sites, 220
sites are Type 1 exit ramps-parallel from a tangent single-lane exit; 96 sites are Type 2
exit ramps-single lane exit ramp without a taper; 77 sites are Type 3 exit ramps-two lane
exit ramp with an optional lane; and 31 sites are Type 4 exit ramps-two lane exit ramp
without an optional lane. Table 2 lists the site resources for each type.
Table 2. Sites Resource Distributions for Freeway Diverge Areas
Resource
Exit Ramp
Type
Total Size
Interstate
Highways
Expressways Turnpikes Parkways
1 220 220 0 0 0
2 96 96 0 0 0
3 77 59 16 2 0
4 31 17 11 2 1
71. 56
4.3.2 Exit Ramp Segments
The work of sites gathering on the ramp sections is labor intensive as well. Since
the exit ramp sections are sequential to the diverge areas, the sample size basically equals
to freeway diverge sites with available data. However several sites did not have ramp
ADT because there are no detectors there. These sites are excluded from the exit ramp
sites. So a total of 389 sites are determined as the sample size for the entire exit ramp
segments.
4.4 Site Selection Procedures
The processes of site selection can be explained in three steps, field study, site
information collection, and site review. Field study is the first step to collect raw data as
geometric data, site notification data and other related factors. Based on these data, the
sites ID could be obtained from Florida road identification systems: Straight-Line
Diagram (SLD) and Florida Traffic Information CDs. Finally, all the selected sites are
checked again to acquire available sites.
4.4.1 Site Selection Procedure 1
Step 1 - Field Study: Field study collects site location and geometric conditions
which match the requirements and criteria. The photograph maps were obtained from
each district traffic information CD. For each site, simple sketches with geometric
information were checked to find the following information:
1) Major freeway names;
2) Freeway directions;
72. 57
3) Ramp types;
4) Deceleration lane lengths;
5) Number of lanes in freeways;
6) Post Speed Limits on freeways;
7) Upstream 1500 ft distances measurements from the painted nose;
8) Downstream 1000 ft distances measurements from the painted nose;
9) Exit ramp directions;
10) Ramp lengths;
11) Number of lanes in the ramp;
12) Ramp suggested or post speed limit;
13) Number of lanes changing on the ramp sections;
14) Ramp terminal control types;
15) Secondary road name;
16) Distances from the first upstream intersection on the secondary road;
17) Distances from the first downstream intersection on the secondary road;
18) Number of lanes on the secondary roads.
4.4.2 Site Selection Procedure 2
Step 2 - Extracting Road ID: SLD and Florida Traffic Information (FTI) annual
CDs were obtained from corresponding FDOT district offices. The road mileposts and
road identification numbers for each site were gathered from SLD and ADT each year
were subtracted from traffic information CDs. These kinds of information are listed
below:
73. 58
19) Section and subsection number of the freeways;
20) Section and subsection number of exit ramp sections;
21) Milepost on the beginning and end of the segment length for diverge areas;
22) Milepost on the beginning and end of the segment length for exit ramps;
23) Site number for freeways;
24) Site number for exit ramps.
4.4.3 Site Selection Procedure 3
Step 3 - Site Review: Each site and the related information were checked again to
prove that all the data are correct and confirm that no significant reconstruction had taken
place at the selected study sites during the study period.
4.5 Section Number, Milepost and Site Identification Number
The section number and milepost for each selected freeway segment was obtained
from the SLD provided by the Florida Department of Transportation. The purpose of
using section numbers and mileposts is to consist with FDOT crash database. Each
section number contains eight digital codes which were used to identify one specific road.
The first two digital codes are the county number for each district. The subsequent three
digital numbers are section numbers and the last three digits are the subsection numbers.
While looking for a location in a site, section number is not enough. The milepost was
additional information to recognize the position on the roadway segment. Mileposts are
made from the beginning of a road way from south to north or from west to east. For
example, I-75 in Hillsborough County (section number ‘10’ ‘075’ ‘000’) begins at the
74. 59
Manatee/Hillsborough county line as milepost 0.000 and ends as milepost 36.25 at
Pasco/Hillsborough County.
Site ID is another index in the annual FTI CDs which contained several essential
parameters including AADT, peak hour factor, and other volume related data. Six
numbers are combined. The first two are the county number and the rest four digits are
the sites recognized ID. The site ID for I-75 at Bruce B. Down’s exits is ‘10’ ‘0153’. The
AADT for this section could be obtained from AADT annual report through site ID.
4.6 Crash Database
Based on the range in mileposts of each segment, crash data reported was
obtained from the crash database maintained by the State of Florida. In 2003, the FDOT
renamed all the freeways exit ramps for the whole state. Accordingly, the crash database
updated the exit ramp numbers for the entire database. Due to this reason, crash data for
freeway exit ramps before 2004 include a lot of missing information and, as a result,
cannot be used in this study. A three-year time frame, from 2004 through 2006, was
selected to obtain crash data. Eighty-six variables are enclosed in the FDOT crash
database including site identification, time of crashes, traffic conditions, geometric
conditions, crash detailed information as location, direction, crash type, severity and so
on. The software SPSS would be used to examine the crash data. Figure 13 shows the
SPSS format from FDOT crash database for one site.
75. 60
Figure 13. SPSS Example format from FDOT crash database
4.7 Combination of Crash Data with Site Information
Each site has a specific database consisted of geometric variables, traffic data and
relative crash information. The Excel file will be used to arrange the format of each
location for useful variables. The following Figure 14 shows part data from the
combining database for some sites.
FIGURE 14. Example of Combining Database
76. 61
CHAPTER FIVE
DATA ANALYSIS
Detailed procedures and results of crash data analyses were performed in this
chapter. As mentioned before, freeway diverge areas and entire exit ramp sections are
two separate research subjects in the study. Quantitative investigations were conducted to
find out crash characteristics and the contributing factors in order to evaluate safety
performances both on the freeway diverge areas and exit ramp sections.
5.1 Outline of Data Analysis
Crash data for freeway diverge areas and exit ramps are analyzed independently
as to evaluate the safety performances on the two research sections in this study. As
mentioned previously, the cross-sectional comparisons were conducted to compare the
effects of the four exit ramp types on the safety performance of freeway diverge areas
and effects of ramp configurations on the safety performance of the exit ramp sections
respectively. On the freeway diverge areas, a total of 424 sample sites were collected.
The sample size was divided into four groups according to the four different exit ramp
types as mentioned before. Group 1 has 220 sites for Type 1 exit ramps, Group 2 has 96
sites for Type 2 exit ramps, Group 3 has 77 sites for Type 3 exit ramps and Group 4 has
31 sites for Type 4 exit ramps. On the exit ramp sections, a total of 389 sites with 247
77. 62
sites for diamond ramps, 93 sites for out collection ramps, 26 sites for free-flow loop
ramps, and 23 sites for parco loop ramps were categorized. Two crash predictive models
were developed for the two research subjects to find the contributing factors to the
crashes occurring at diverge areas and exit ramp sections.
First, average crash frequency and crash rate for each group on the two research
subjects were calculated. Statistical tests were conducted to compare each section at a
90% confidence level one by one. Second, each group had the sample sites classified by
target crash types that have three most crash frequencies among all the crash types. Then
the average crash number and crash rates by target crash types were calculated by using
crash data from 2004 to 2006 and the corresponding statistical tests were performed.
Third, crash severity categories such as PDO (property-damage-only), injury and fatality
were compared with corresponding average crash number and crash rate by each ramp
configuration. The comparisons were followed by statistical significance tests at 90%
confidence level which is believable and commonly used in crash analysis. Finally, two
predict models were built to find the predictive crash number under some definite
conditions according to the independent variables.
5.2 Freeway Diverge Areas
5.2.1 Comparison of Average Crash Frequency and Crash Rate
A total of 13968 crashes were reported at selected freeway diverge segments for
three years from 2004 to 2006. The crash frequency at selected sites varies from 0 to 60
with a mean of 11.01 crashes per year. Summary statistical analyses of crash frequency
and crash rate for four exit ramp groups were illustrated in Table 3. The average crash
78. 63
frequency and crash rate for different exit ramp groups were compared in Figure 15 and
16. Average crash frequency is the mean value of all the crashes in one group each year.
In this study, crash rate is defined in the methodology chapter, set as crashes per million
vehicles per mile. The average daily traffic for each site was collected and the segment
length was identified equally for each site. For example, if site I has 10 crashes for the
three years from 2004 to 2006, segment length is 0.47 miles (2500 ft), and the ADT is
10,000 vehicles per day, the crash rate for this site I could be calculated as following:
Crash Rate for the Site I = 94.1
47.0000,103365
10000,000,1
=
×××
×
milesvpdyearsdays
crashes
The average crash rate for a particular group is calculated by the mean value of crash
rates for all sites. As shown in Figure 15 and 16, the type 1 exit ramp group has the best
safety performance in terms of the lowest average crash frequency and crash rate
comparing to other exit ramp types. The figures also show that the type 2 exit ramp group
has the highest average crash frequency and crash rate. The trends of average crash
frequency and crash rate among the four types showing in the figures are sequent. Type 1
and Type 2 have the lowest and highest average crash frequency and crash rate among
the 4 groups while the average crash frequency and crash rate for Type 3 and Type 4 is a
little higher than Type 1 and a little lower than Type 2. Table 3 listed the detailed analysis
such as mean, median, max and min values for each group. On average, the sites in type 2
exit ramps group report the most average crash frequency as 15.4 crashes per year in
freeway diverge segments. As compared those in Type 1 exit ramp group, sites in Type 2
exit ramp group reports 75% more crashes per year for one lane exit ramp. The average
crash rate at sites with Type 2 is also 35.6% higher when comparing those with Type 1
79. 64
0
2
4
6
8
10
12
14
16
Type 1 Type 2 Type 3 Type 4
Exit Ramp Type
AverageCrashFrequency(crashes/year)
per year. For two lane exits, Type 3 appears 20% and 14% less average crash frequency
and crash rate than Type 4.
Figure 15. Comparison of Average Crash Frequency among Four Exit Ramp Types
Figure 16. Comparison of average Crash Rate among Four Exit Ramp Types
0
0.1
0.2
0.3
0.4
0.5
0.6
0.7
Type 1 Type 2 Type 3 Type 4
Exit Ramp Type
CrashRate(crashes/mvm)
80. 65
Table 3. Summary of Average Crash Frequency and Crash Rate for
Four Exit Ramp Types
Crash Frequency
(No. of crashes per year)
Crash Rate
(No. of crashes per million
vehicles per mile)
Type 1 2 3 4 1 2 3 4
No. of Sites 220 96 77 31 220 96 77 31
Total No.
of Crashes
per year
1934 1481 824 417 1934 1481 824 417
Average No.
of Crashes
8.8 15.4 10.7 13.45 0.45 0.61 0.48 0.61
St. Deviation 6.23 13.8 8.14 11.3 0.36 0.45 0.32 0.37
Median 4.7 13.2 8.67 12.3 0.36 0.48 0.42 0.55
Max 54 30 31 60 1.36 1.98 1.18 1.24
Min 0 0 1 0 0 0 0.061 0
The site with the highest crash frequency is located on Interstate Highway 95 (I-95)
in District 4 along the southbound. Figure 17 below showed the site picture. During the
three-year time period, 179 crashes were reported at selected freeway segments. 101 are
injury plus fatal crashes and the others are PDO crashes. Field observation was made to
the particular site to identify the undesirable driving behaviors contributing to the high
crash frequency. The segment is located on a five-lane freeway with a posted speed limit
of 55 mph. The exit ramp is found to be a type 4 exit ramp which is a two-lane exit ramp
without an optional lane. The annual daily traffic volume (ADT) on the freeway is
224,000 vehicles per day. The reasons that had most crashes might be the traffic volume
81. 66
was higher than usual, and the exit ramp type in the site caused more weaving maneuvers
in diverge areas. Drivers who mistakenly entered the exit lane need to merge back into
through lanes to continue on the freeway; while vehicles exiting freeways may need to
change up to four lanes to weave to the outer exit lane. Some severe weaving conflicts
have been observed at the site that indicates a high potential crash prone area.
FIGURE 17. Site Picture for I-95 Southbound Exit 74
In order to compare whether the average crash frequencies and crash rates for the
four exit ramp types have significant different from each other, hypothesis tests were
applied to evaluate the samples. For example, the statistical Z test to compare the average
crash frequency for Type 1 exit ramp and Type 2 exit ramp was performed as following:
1) The mean values for two populations Type 1 exit ramp and Type 2 exit ramp are µ1
and µ2;
2) Mean value and standard deviation of the two samples for Type 1 exit ramp are 8.8
and 6.73 respectively, while those for Type 2 exit ramp are 15.4 and 13.8;
82. 67
3) The sample numbers for Type 1 exit ramp and Type 2 exit ramp are 220 and 96
accordingly;
4) The null hypothesis is H0 : µ1 = µ2, the alternative hypothesis is Ha: µ1 ≠ µ2;
5) Assuming the difference in the sample means of the two population fit the normal
distribution and 90% confidence level was chosen for this study;
6) 06.3
96
8.13
220
23.6
4.158.8
22
0 =
+
−
=Z ;
7) The critical value for 2/αZ is 1.645 which is smaller than 3.06 so that the null
hypothesis is rejected;
8) The conclusion could be get as the average crash number for Type 1 and Type 2 exit
ramp is significant different at a 90% confidence level.
The average crash frequency and crash rate for each population were tested at a
90% confidence level. Table 4 listed all the results for the hypothesis tests. The
comparison of the average number of crashes for Type 1 and Type 2 exit ramp showing
“1:2” is significantly different at a 90% confidence level meaning “YES” in the table. For
average crash frequency, Type 1 shows significant different from the other three types
while Type 2 has significantly different average crash frequency with Type 3 but not with
Type 4 exit ramps. The results were consistent for average crash frequency and crash rate
except comparing Type 1 and Type 3 exit ramps. This might be the cause that crash rate
has limited the traffic volume impacts. For one lane exit ramp, Type 1 exit ramp is much
safer than Type 2 exit ramp. For two-lane exit ramp, Type 3 group did appear significant
difference with Type 4 exit ramp on average crash rate.