
Recommended
Recommended
More Related Content
What's hot
What's hot (20)
Viewers also liked
Viewers also liked (12)
Similar to Development of Speed Profile Model for Two-Lane Rural Road
Similar to Development of Speed Profile Model for Two-Lane Rural Road (20)
Recently uploaded
Recently uploaded (20)
Development of Speed Profile Model for Two-Lane Rural Road
- 1. International Journal of Engineering Science Invention ISSN (Online): 2319 – 6734, ISSN (Print): 2319 – 6726 www.ijesi.org ||Volume 5 Issue 11|| November 2016 || PP.95-104 www.ijesi.org 95 | Page Development of Speed Profile Model for Two-Lane Rural Road Wonbum Cho Senior Researcher, Korea Institute of Civil Engineering and Building Technology, Korea Ph.D. Student, Department of Transportation Engineering, University of Seoul, Korea Abstract: It's desirable to make road design match with driver's expectation and consistency of road design implies harmonized connection among road design elements. A road alignment safety evaluation based on road design consistency which has been accelerated recently is designed to calculate the variation of driving speed depending on geometric structure based on operating speed profile and the result is used as the index in evaluating the design consistency. Instead of the safety of individual road design elements (tangent or curve), consistency of continuous design elements is rather stressed. Under such background, driving speed prediction model at horizontal curve/tangent and acceleration/deceleration model at entry and exit of horizontal curve were developed in this study in a bid to evaluate the alignment safety of a 2-lane rural road, which will be used to supplement current road design standard to operating speed-based standard so as to make commitment to designing the road from driver's standpoint, not the viewpoint of road designer or policy-maker. Keywords: road design, alignment safety, linear connection, driving speed, speed profile model I. Introduction 1.1. Background and Objective of Study Development of rational road safety evaluation method and establishment of safety measure are required for rural road including national road and highway where the vehicles run at high speed and accordingly the fatality rate by traffic accident is high. Design consistency concept in road safety evaluation has been under review in many advanced nations including Germany, Switzerland, USA, Canada and Australia. Consistency in road design indicates the harmonized connection among road design elements and is defined as the coincidence between driver's expectation and road alignment change. A road alignment safety evaluation based on road design consistency rather focuses on consistency in continuous design elements than the safety of individual road design element (tangent or curve) and particularly, evaluating the road design consistency using the difference in running speed of continuous design elements is considered the general tendency. HSDM (Interactive Highway Safety Design Module) which is the road safety module in USA is at the stage of commercialization, but the road design consistency concept has yet to be developed to put it to practical use. This study thus is intended to develop the elements of driving speed profile model for evaluating the alignment safety of a 2-lane rural road, thereby making commitment to establishing the road safety evaluation method and safety measure. 1.2. Scope of the study and method To evaluate the road design consistency using the difference in running speed of continuous design elements, running speed profile model that represents driver's driving pattern on continuous alignment needs to be developed. To that end, running speed data on alignment linking the tangentsection and curve section within the spatial range of a 2-lane rural road was collected and analyzed in this study and particularly tangent section was determined with a sufficient length ("critical tangent")to reach to the speed desired by the driver. A critical tangentis not absolute which however varies depending on curve radius of horizontal curve at upstream and downstream. To determine whether or not the critical tangent, the data on running speed on tangent and curve section and acceleration at entrance/exit on vertical curve is needed. In this study, prediction model for running speed on vertical curve proposed by Lamm and Choueiri(1987), acceleration at entrance/exit on plane alignment and desired speed on tangent section were used to determine the critical tangent. Finally, desired speed on tangent section, acceleration at entrance/exit on plane alignment and prediction model for running speed on vertical curve were developed and specific utilization procedure for evaluating alignment safety of a 2-lane rural road was proposed as research outcome, making use of the road alignment evaluation standard and method which provides more specific procedure by Lamm, Psarianos and Mailanede(1999)
- 2. Development of Speed Profile Model for Two-Lane Rural Road www.ijesi.org 96 | Page II. Document Research 2.1 Evaluation of road design consistency The study on road alignment safety evaluation has been conducted focusing on relationship between varying running speed and high road traffic accident rate. Consistency in road design indicates the harmonized connection among road design elements and is defined as the coincidence between driver's expectation and road alignment change. A road alignment safety evaluation based on road design consistency rather focuses on consistency in continuous design elements than the safety of individual road design element (tangent or curve) and particularly, evaluating the road design consistency using the difference in running speed of continuous design elements is considered the general tendency. Running speed is defined as "the maximum speed that the driver can run on a given section under the good weather condition without exceeding the safety speed determined by design speed by road section" It's the speed monitored at free flow state and 85% is the scale used most commonly (AASHTO(1994, 2001)). Lamm et al.(1999) proposed three road design consistency evaluation criteria as follows. (1) Road design consistency evaluation using the difference between running speed and design speed by design element It's the standard to evaluate the road alignment safety using the difference between running speed and design speed at same point(Table 1). When running speed differs from design speed, road design elements according to design speed fails to meet driver's expectation, resulting in high probability of the accident. Table 1.road design consistency evaluation criteriaⅠ Standard Category Design consistency of a single road design element Excellent │V85i – Vd│≤ 10km/h Good 10km/h<│V85i – Vd│≤20km/h Poor │V85i – Vd│> 20km/h Note) Vd : Design speed V85i : 85% of running speed on i-th design element (2) Road design consistency evaluation using the difference between continuous design elements The method to evaluate the alignment safety based on difference in running speed between continuous design elements (tangent and curve, curve and tangent) which is the evaluation standard closely related with this study (Table 2). Table 2.road design consistency evaluation criteria Ⅱ Standard Category Running speed consistency between continuous alignment Excellent │V85i – V85i+1│≤ 10km/h Good 10km/h<│V85i – V85i+1│≤ 20km/h Poor │V85i – V85i+1│> 20km/h Note) V85i : 85% of running speed on i-th design element V85i+1: 85% of running speed on (i+1)th design element (3) Road design consistency evaluation using the difference between demand lateral sliding friction coefficient and supply lateral sliding friction coefficient It's the road alignment safety evaluation standard based on difference in supply lateral sliding friction coefficient (fRA) determined by design speed and demand lateral sliding friction coefficient (fRD) determined by running speed of the road user (Table 3). It's similar with the method using the difference between running speed and design speed by design element from the viewpoint of evaluating the safety of individual design element but what is different is that it's based on dynamic safety of running.
- 3. Development of Speed Profile Model for Two-Lane Rural Road www.ijesi.org 97 | Page Table 3.road design consistency evaluation criteria Ⅲ Standard Category Running dynamic consistency of a single road design element Excellent fRA - fRD≥+0.01 Good -0.04 ≤fRA - fRD≤+0.01 Poor - fRA - fRD<-0.04 Note) fRD : demand lateral sliding friction coefficient fRA : supply lateral sliding friction coefficient 2.2 Running speed profile model (1) Components of running speed profile model To evaluate the design consistency using the difference in running speed of continuous design elements in Table 2, running speed profile model that can represent driver's pattern continuous alignment is required. A running speed profile model comprises of three elements including desired speed on tangent, acceleration at entrance/exit on horizontal curve and running speed prediction model on horizontal curve. Existing study on desired speed on tangent, acceleration at entrance/exit on horizontal curve and running speed prediction model on horizontal curve is outlined as follows. 1) Prediction model for running speed on horizontal curve The study on prediction model for running speed on horizontal curve is mostly for the relations between CCR(Curvature change rate)/Degree of Curvature(DC) and running speed. As foreign study, Lamm, Guenther and Choueiri(1995) proposed the speed prediction model considering the degree of curvature among the speed- influencing factors after collecting 261 samples in NY, USA in 1986. Given the fact that domestic road design is based on horizontal curve radius than DC, running speed prediction model using DC in foreign countries was modified to reciprocal form of horizontal curve radius (1/R) as Equation (1). V85 = 93.87 – 3171/R(R2 =0.787) (1) where, R : Horizontal curve radius (m) R2 : Determination coefficient Krammes et al.(1994) proposed the modes using 1/R and the model including horizontal curve length and pier as Equation (2) and (3) after collecting 138 samples from 5 states in USA in 1993. V85 = 103.66 – 3405/R(R2 =0.84) (2) V85 = 102.45 – 2741/R+ 0.0037L – 0.10Θ (3) where, R : horizontal curve radius (m) L :horizontal curve length (m) Θ : angle of intersection (˚) R2 :coefficient of determination To compare the speed prediction models, prediction models for running speed on horizontal curve proposed in previous studies are summarized as Fig 1. It's noteworthy that the speed was measured on a 2-lane rural road where the speed limit is 90~100km/h, but when it comes to domestic case, speed limit is mostly 60km/h and thus it's not rational to apply foreign speed prediction model to domestic case.
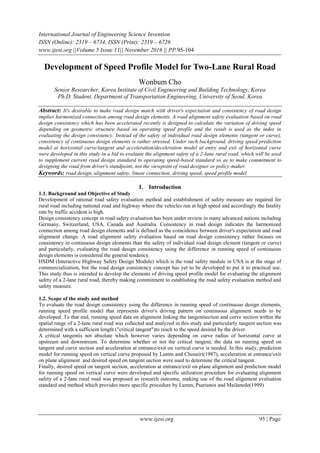
- 4. Development of Speed Profile Model for Two-Lane Rural Road www.ijesi.org 98 | Page Fig. 1.degree of curvature and relationship between CCR and V85 2) Desired speed on tangent Lamm et al (1999) measured the speed on assumption that desired speed on tangent is not affected by geometric structure of the road in prediction model for running speed on curve. 90~105km/h is suggested as desired speed on tangent in most of countries, but is 120km/h in Germany (see Fig.1) and Lamm et al(1995) proposed it as 93.87km/h (see Eq. (1)) 3) Acceleration at entry / exit on horizontal curve Lamm et al.(1999) suggested 0.85m/s2 as acceleration/deceleration equally, while Collins and Krammes(1996) obtained the acceleration at entry on curve similarly based on site investigation data but the acceleration at exit was all lower than 0.85m/s2 . (2) Application measure of running speed profile model Running speed profile model comprises of desired speed on tangent, acceleration at entry/exit on horizontal curve and prediction model for running speed on horizontal curve. After these three elements are determined, change in running speed depending on length of tangent in alignment element where the tangent and curve continue can be theoretically calculated through Fig. 2. But it shall be in accordance with basic assumption of running speed profile model as follows. ∙The driver has desired speed to be maintained ∙The driver accelerates or decelerates at start and end point of horizontal curve. ∙The driver maintains a certain speed on horizontal curve. Fig. 2.conceptual scheme for developing running speed profile Case 1Case 2 Case 3
- 5. Development of Speed Profile Model for Two-Lane Rural Road www.ijesi.org 99 | Page ․V85C1 : Running speed on horizontal curve at upper stream (km/h) ․V85C2 : Running speed on horizontal curve at downstream (km/h) ․V85Tmax : Desired speed on tangent(km/h) ․S1 : Acceleration distance to reach V85Tmax for the vehicle going out at V85C1(m) ․S2 : Deceleration distance to reach V85C2 for the vehicle running at V85Tmax (m) ․TL : Length of tangent(m) ․TLmin : Minimum tangentlength to reach the speed on horizontal curve at downstream after accelerating /decelerating till following horizontal curve by the vehicle coming out from horizontal curve (m) ․TLmax : Critical tangentlength. Minimum tangentlength to reach the speed on horizontal curve at down stream after reaching V85Tmaxon tangent and deceleration (m), S1+S2 I. . Depending on relationship between tangent length in section and minimum tangentlength(TLmin) and critical tangentlength(TLmax), it's classified into three kinds as Table 4. Table 4.running speed profile classification standard Case 1 TL≥TLmax As tangent is long enough, the vehicle coming out at V85C1 from horizontal curve at upper stream decelerates after reaching V85Tmax on tangent and decelerates again and entering to horizontal curve at downstream at V85C2 Case 2 TL≤TLmin As tangent is short, the vehicle coming out at V85C1 from horizontal curve at upper stream decelerates or accelerates before entering to horizontal curve at downstream at V85C2 or enters at higher or lower than V85C2 Case 3 TLmin<TL<TLmax The vehicle coming out from horizontal curve at upper stream at V85C1 accelerates to reach V85Tmax on tangent but fails and decelerates to enter horizontal curve at downstream at V85C2 Each case may be expressed as Fig. 3 depending on relationship between tangent length (TL), minimum tangent length (TLmin) and critical tangent length (TLmax) Fig. 3. Running speed profile
- 6. Development of Speed Profile Model for Two-Lane Rural Road www.ijesi.org 100 | Page In case of a) and c) in Fig. 3 in road design consistency evaluation, tangent is included in evaluation considering the tangent as Independent Tangent (IT), but in case of b), it's excluded considering it as Dependent Tangent (DT). The length of tangent that determines whether independent or dependent is not absolute but varies depending on curve radius of horizontal curve at upper and downstream. In a) and c) in Fig. 3, it's expected to run at V85C2 from the start of the curve at downstream, while V85C2 may not appear at any point on curve at downstream in b). III. Site Investigation 3.1 Designation of section for site investigation (1) Designation method Among three running speed profiles that depend on horizontal curve radius at upper stream, tangentlength and horizontal curve radius at downstream (see Fig.3), case 2 may not have own running speed determined depending on curve radius at any point on horizontal curve at downstream. And in case of 3, it may also have similar pattern as case 2. Thus, the a) of 3 cases in Fig 3 was selected as the site for investigation. To identify the case 1 in terms of geometric condition, driver's pattern was assumed using prediction model for running speed on horizontal curve suggested by Lamm et al (1987), acceleration at entrance /exit on horizontal curve (a) and desired speed on tangent (V85Tmax) which was measured on assumption that no effect of horizontal curve radius exists in prediction model for running speed on horizontal curve. Driver's pattern assumed is as Table 5. Table 5.driver's pattern (Lamm et al (1987)) Running speed on horizontal curve (km/h) V85=93.85-3171/R Desired speed on tangent (km/h) 94 Acceleration at entrance/exit on curve (m/s2 ) 0.85 In applying the result from Lamm et al (1987) study, driver's behavior was based on road with speed limit 90km/h which is different from domestic case. In this study, case 2 was excluded to minimize the potential error from different environment. (2) Selection result Based on a 2-lane rural road corresponding to case 1, 15 sections were finally selected which were distributed at the region with relatively less traffic. Horizontal curve radius at upper stream is 130~1,000m, tangent length at upper stream is 190~800m and horizontal curve radius at downstream is 80~300m and to exclude the driver's pattern by vertical slope, the alignment with vertical slope less than 3% was selected. Geometric structure of the section for investigation is as Table 6. Table 6.geometric structure of the section for investigation Section Horizontal curve at upper stream Tangent at upper stream Horizontal curve at down stream curve radius (R, m) curve length (CL, m) length (m) curve radius (R, m) curve length (CL, m) 1 800 40 340 80 40 2 130 150 410 120 80 3 180 130 400 120 100 4 1,000 100 640 120 100 5 1,000 90 600 120 190 6 200 20 420 150 60 7 250 90 280 180 90 8 240 70 450 180 90 9 800 40 480 180 90 10 120 100 400 180 130 11 450 130 370 180 130 12 1,000 130 250 200 60
- 7. Development of Speed Profile Model for Two-Lane Rural Road www.ijesi.org 101 | Page 13 200 80 800 200 140 14 1,000 45 230 250 90 15 400 60 190 300 80 3.2. Investigation method Speed data was collected at non-peak hour using NC-97 from nu-metrics in USA to minimize the impact of vehicle interference on running speed. The detector was 16cm wide, 14cm long and 2cm high which is not easily identified by the driver. The detector detects the vehicle passing above the magnetic field and the micro computer in detector predicts the spot speed. The data from the detector includes vehicle speed, detection time, headway and vehicle length which are stored at the detector and then transferred to PC through RS232 port after investigation. The detector is placed at 100m interval from 500m to 100m in front of curve at downstream, beginning of curve (BC) at downstream, from BC to 1/2 point (1/2L), end of curve (EC) and 100m rear of curve and additionally depending on tangent length at upper stream. Fig. 4.location of detectors In case of headway 6 seconds or less, it's excluded from the data on assumption of being influenced by other vehicles and passenger car only was included for analysis. 3.3. Investigation result and analysis 1) Prediction model for running speed on curve Table 7 shows the road geometric structure of horizontal curve at downstream and running speed at 1/2L. Table 7.road geometric structure of horizontal curve at downstream and running speed Section tangentlength (TL) curve radius (R) curve length (CL) lane width (LW) shoulder width (SW) Superelevation (e) 85% of running speed (V85) 1 340 80 40 3.4 2.0 6.0 69.0 2 410 120 80 3.5 0.7 7.2 64.0 3 400 120 100 3.2 1.4 5.8 69.5 4 640 120 100 3.2 0.9 6.8 64.0 5 600 120 190 3.4 0.8 5.3 55.0 6 420 150 60 3.7 0.7 6.6 72.0 7 280 180 90 3.6 1.0 8.1 66.1 8 450 180 90 3.3 0.7 5.9 64.6 location of detector
- 8. Development of Speed Profile Model for Two-Lane Rural Road www.ijesi.org 102 | Page 9 480 180 90 3.4 0.8 6.9 69.0 10 400 180 130 3.3 1.0 5.3 80.0 11 370 180 130 3.4 1.1 6.7 79.9 12 250 200 60 3.2 0.7 7.1 82.0 13 800 200 140 3.3 2.0 5.2 68.0 14 230 250 90 3.4 0.8 4.7 76.0 15 190 300 80 3.3 0.7 6.8 76.0 A primary regress model with V85 as dependent variable and the elements relating to tangent at upper stream and horizontal alignment of the curve at upper stream as independent variable was developed and then independent variables failed to meet the standard (F=0.10)are excluded one by one. But independent variables with higher correlation with V85 and significance were considered first. Optimal regression model was determined among the primary regression models considering the sign of independent variable, correlation between independent variables, significance of model and independent variable (F testing hypothesis, t testing hypothesis) independence between error terms (Durbin-Watson), multicollinearity (tolerance limit VIF, state index), outlier (standardized residuals) . When it comes to coefficient of determination indicating the explanation power of regression equation, modified coefficient of determination(adj R2 ) was applied to minimize the effect of increasing coefficient of determination by increase in number of independent variables. Finally regression equation with V85 as neutral variable and 1/R and TL2 , SW as independent variable was developed. All dependent variables have significance probability at 0.10 and F value at 0.05. Table 8.prediction model for running speed on horizontal curve Model non-standardized coefficient t significance probability adj R2 B standard error (constant) 80.662 4.645 17.366 .000 0.471 1/R -1960.281 695.686 -2.818 .017 TL2 -0.00002874 0.000 -2.927 .014 SW 8.003 3.950 2.026 .068 V85=80.662 - 1960.281×(1/R) - 0.00002874×TL2 + 8.003×SW 2) Desired speed on tangent Desired speed on tangent was estimated using speed data of the section predicted to reach V85Tmax in running speed profile model by Lamm et al (1987). Table 9 shows the sections that maintain V85Tmax and V85Tmax by section. Table 9.desired speed on tangent (V85Tmax) Section V85Tmax start point (based on BC at downstream, m) V85Tmax end point ((based on BC at downstream, m) V85Tmax 1 -306 -268 87.0 2 -228 -195 - 3 -263 -195 - 4 -612 -195 93.0 5 -572 -195 84.9 6 -295 -161 - 7 -178 -137 - 8 -344 -137 - 9 -446 -137 76.8 10 -205 -137 - 11 -311 -137 - 12 -222 -125 85.5 13 -675 -125 84.0
- 9. Development of Speed Profile Model for Two-Lane Rural Road www.ijesi.org 103 | Page 14 -202 -102 79.0 15 -124 -86 81.9 Average 84.0 3) Acceleration at entrance/exit on curve Acceleration to enter the curve was estimated using the speed data of the section where deceleration is expected to begin and start point of curve in running speed profile model by Lamm et al (1987). Table 10.acceleration to enter the curve Section V85 at beginning of deceleration V85(BC) Acceleration to enter the curve 1 75.1 69.9 -1.0 2 71.0 69.0 -0.4 3 85.0 76.0 -2.0 4 82.3 74.0 -1.8 5 72.6 64.0 -1.6 6 79.0 79.0 0.0 7 79.9 74.1 -1.2 8 80.3 69.8 -2.2 9 80.0 77.0 -0.7 10 81.9 76.6 -1.2 11 84.3 80.4 -0.9 12 84.0 79.0 -1.1 13 80.0 69.3 -2.2 14 81.1* 79.0 0.2 15 79.7* 82.0 0.5 Average -1.0 * : using -50m speed data (-100m for remaining sections) Acceleration to enter the curve was estimated using the speed data of the section where deceleration is expected to begin and start point of curve in running speed profile model by Lamm et al (1987). Table 11.acceleration to exit the curve Section V85(EC) V85(+100 or +50) Acceleration to exit the curve 1 72.7 78.1 1.1 2 - - - 3 69.0 82.0 2.7 4 71.0 77.0* 2.5 5 63.0 71.0 1.5 6 - - - 7 - - - 8 - - - 9 76.3 76.4 0.0 10 77.0 86.5 2.2 11 82.8 82.0 -0.2 12 83.9 83.6 -0.1 13 73.2 77.0 0.8 14 77.0 77.0 0.0 15 83.3 82.0 -0.3 Average 0.9 * : using +50m speed data (+100m for remaining sections)
- 10. Development of Speed Profile Model for Two-Lane Rural Road www.ijesi.org 104 | Page IV. Conclusion This study was conducted on a 2-lane rural road and prediction model for running speed on horizontal curve and tangent and acceleration/deceleration model at the entrance/exit on horizontal curve which are necessary to evaluate the running speed profile-based design consistency. The outcome is as follows. 85% of running speed on horizontal curve (V85) is dependent on curve radius, tangent length at upper stream and should width. Desired speed on tangent (V85Tmax)was 84km/h which is higher than usual speed limit on a 2-lane road by 40%. Deceleration when entering the curve was 0~2.2 m/s2 and acceleration to exit the curve was 0~2.7 m/s2 , where mean acceleration/deceleration was 1.0m/s2 and 0.9m/s2 , respectively which was slightly higher than those proposed by Lamm et al (1987). The method to investigate the running speed and alignment classification used in this study would enhance the reliability of the data for running speed prediction model as well as allow to analyze and evaluate the continuous speed variation flow so as to make commitment to analyzing the acceleration/deceleration pattern in efficient way and furthermore, supplementing the current design speed-based road design to running speed-based design and accomplishing the road design from the viewpoint of road users, instead of policy-maker. Acknowledgements This research was supported by a grant from a Strategy Research Project (Development of Enhancement and Evaluation Technologies for Driver’s Visibility on Nighttime – 1st research field: Development of Enhancement Technology for Driver’s Visibility on Nighttime) funded by the Korea Institute of Civil Engineering and Building Technology. References [1] AASHTO, "A Policy on Geometric Design of Highway and Street," 1994. [2] AASHTO, "A Policy on Geometric Design of Highway and Street," 2001. [3] Gutierrez, N.I., “A Model for Estimating Operating Speeds on Combined Horizontal and Vertical Alignments on Rural Two-Lane Highways,”Ph D Thesis, Texas A&M University, 1997. [4] Krammes, R. A. and M. A. Garnham, "Review of Alignment Design Policies Worldwide", Presented at the First International Symposium on Highway Geometric Design Practices, Boston, 1995. [5] Lamm, R., J. C. Hayward, and J. G. Cargin, Comparison of Different Procedures for Evaluating Speed Consistency, Transportation Research Record 1100, Transportation Research Board, Washington, D. C., 1986. [6] Lamm, R., Psarianos, B. and Mailaender T., Highway Design and Traffic Safety Engineering Handbook, McGraw-Hill, 1999. [7] Leisch, J. E. and J. P. Leisch, "New Concepts in Design Speed Application," Transportation Research Record 631, Transportation Research Board, Washington, D. C., 1977. [8] McLean, J., "Driver Speed Behaviour and Rural Road Alignment Design," Traffic Engineering & Control, Vol. 22, Printerhall Limited, London, England, 1981, pp. 208-211. [9] Ministry of Land, Transport and Maritime Affairs(2009), Manual and Guideline of Rule on the Standard of Highway Structure and Facility. [10] Swiss Norm 640 080b, "Geschwindigkeitalsprojektierungselement," Zurich, Switzerland: In Gutierrez, N. I., "A Model for Estimating Operating Speeds on Combined Horizontal and Vertical Alignments on Rural Two-Lane Highways," Ph. D. Thesis, Texas A&M University, USA, 1997.