QSE Daily Technical Report Summary
•
0 likes•408 views

The document summarizes the daily performance of the Qatar stock market and various stocks traded on it. It provides closing prices and percentages changes for indexes like the QSE Index and individual stocks. It also analyzes movements in the indexes and identifies support and resistance levels. Key stocks like QIBK and GISS are discussed in more detail, highlighting factors like moving averages, indicators and patterns that may signal future price direction. Contact details are provided at the end for the research analysts.

Recommended
More Related Content
What's hot
What's hot (20)
Viewers also liked
Viewers also liked (20)
Similar to QSE Daily Technical Report Summary
Similar to QSE Daily Technical Report Summary (20)
More from QNB Group
More from QNB Group (20)
Recently uploaded
Recently uploaded (20)
QSE Daily Technical Report Summary
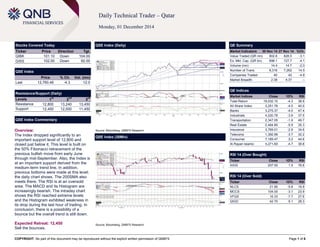
- 1. COPYRIGHT: No part of this document may be reproduced without the explicit written permission of QNBFS Page 1 of 6 Daily Technical Trader – Qatar Monday, 01 December 2014 Stocks Covered Today Ticker Price Direction Tgt. QIBK 101.10 Down 104.00 GISS 102.00 Down 92.00 QSE Index Price % Ch. Vol. (mn) Last 12,760.46 -4.3 12.0 Resistance/Support (Daily) Levels 1st 2nd 3rd Resistance 12,800 13,240 13,450 Support 12,450 12,000 11,450 QSE Index Commentary Overview: The Index dropped significantly to an important support level of 12,800 and closed just below it. This level is built on the 50% Fibonacci retracement of the previous bullish move from early June through mid-September. Also, the Index is at an important support derived from the medium-term trend line. In addition, previous bottoms were made at this level; the daily chart shows. The 200SMA also meets there. The RSI is at an oversold area. The MACD and its Histogram are increasingly bearish. The intraday chart shows the RSI reached extreme levels and the Histogram exhibited weakness in its drop during the last hour of trading. In conclusion, there is a possibility of a bounce but the overall trend is still down. Expected Retreat: 12,450 Sell the bounces. QSE Index (Daily) Source: Bloomberg, QNBFS Research QE Summary Market Indicators 30 Nov 14 27 Nov 14 %Ch. Value Traded (QR mn) 802.6 828.5 -3.1 Ex. Mkt. Cap. (QR bn) 698.1 727.7 -4.1 Volume (mn) 14.4 14.7 -2.0 Number of Trans. 8,316 7,262 14.5 Companies Traded 40 42 -4.8 Market Breadth 2:38 4:37 – QE Indices Market Indices Close 1D% RSI Total Return 19,032.10 -4.3 38.9 All Share Index 3,251.76 -4.0 40.0 Banks 3,275.37 -4.0 47.4 Industrials 4,220.78 -3.9 37.5 Transportation 2,347.05 -1.9 49.7 Real Estate 2,484.85 -5.9 35.3 Insurance 3,769.01 -2.9 34.6 Telecoms 1,392.99 -3.7 32.2 Consumer 7,189.47 -3.2 44.6 Al Rayan Islamic 4,271.60 -4.7 38.8 RSI 14 (Over Bought) Ticker Close 1D% RSI IHGS 207.00 1.5 76.6 RSI 14 (Over Sold) Ticker Close 1D% RSI NLCS 21.90 -5.8 19.9 MCCS 104.00 -3.1 23.9 VFQS 16.33 -7.7 27.6 QIGD 42.70 -5.1 28.3 QSE Index (30Min) Source: Bloomberg, QNBFS Research
- 2. COPYRIGHT: No part of this document may be reproduced without the explicit written permission of QNBFS Page 2 of 6 QIBK Price % Ch. Volume Last 101.10 -4.26 125,369 Resistance/Support Levels (QR) 1st 2nd 3rd Resistance 108.00 111.00 115.00 Support 100.00 95.00 90.00 Commentary Overview: The bank is at an important support level of QR100.00. Indicators show that the name may still be in a bearish leg. On the daily chart, price closed below the 50 and the 100SMAs, yet still just above the 200SMA (a strong supportive SMA). Moreover, the RSI is at the oversold area. On the hourly chart, the name is also at the RSI’s oversold area and the MACD is at an extreme level below the zero line. The good news is that the name created a long-legged doji candlestick. This candle indicates market participants’ indecision at the last hour of the session. That may indicate a possible bounce. Expected Target: QR104.00 – QR105.00 Trading above the QR102.00 for at least an hour will indicate bullish attitude and a possible bounce in the making. This expected bounce should be used for a quick trade and also to exit other long positions. Suggested Stop-Loss: QR99.00 A drop below the level will drag the name to the QR95.00 level. (Daily) Source: Bloomberg, QNBFS Research (Hourly) Source: Bloomberg, QNBFS Research
- 3. COPYRIGHT: No part of this document may be reproduced without the explicit written permission of QNBFS Page 3 of 6 GISS Price % Ch. Volume Last 102.00 -6.42 763,524 Resistance/Support Levels (QR) 1st 2nd 3rd Resistance 104.00 109.00 114.40 Support 102.00 96.00 87.50 Commentary Overview: GISS just made a double top price formation. This is a significant reversal pattern to the bearish side. The pattern has been created over the past 5 months. Thus, it is of importance over the medium term to realize that the name may be going through a rough correction and this correction is likely to continue. The MACD is also turning downward, and the RSI is showing bearish momentum. While the trend is down, we expect increased volatility in the name as GISS is still above its SMAs on the weekly chart. On the daily chart, the RSI is at an oversold area. However, the MACD is showing further weakness. Any bounce should be treated as a throwback and should be construed as a chance to offload previous long positions. Expected Price Retreat: QR92.00 Based on our analysis of the double top formation, the expected first target is QR92.00, which should be confirmed with a break below the QR100.00 level. (Weekly) Source: Bloomberg, QNBFS Research (Daily) Source: Bloomberg, QNBFS Research
- 4. COPYRIGHT: No part of this document may be reproduced without the explicit written permission of QNBFS Page 4 of 6 Intra-day Fibonacci Support and Resistance Levels Daily Moving Averages* Support Levels Resistance Levels Ticker Close 3rd 2nd 1st Pivot 1st 2nd 3rd 50 SMA 100 SMA 200 SMA QSE Index 12,760.46 12,426.44 12,590.15 12,691.30 12,855.01 13,018.72 13,119.87 13,283.58 13,730.04 13,273.09 12,635.70 Total Return 19,032.10 18,533.91 18,778.09 18,928.95 19,173.12 19,417.30 19,568.16 19,812.33 20,478.22 19,796.22 18,704.59 All Share 3,251.76 3,168.87 3,209.66 3,234.87 3,275.67 3,316.46 3,341.67 3,382.47 3,470.45 3,357.11 3,195.69 Al Rayan Islamic 4,271.60 4,145.49 4,202.86 4,238.30 4,295.68 4,353.05 4,388.49 4,445.87 4,661.11 4,483.63 4,096.10 Banks & Financial Services MARK 45.95 44.05 44.70 45.10 45.75 46.40 46.80 47.45 54.98 54.21 48.32 CBQK 71.00 69.13 69.67 70.00 70.53 71.07 71.40 71.93 71.37 69.05 66.85 QIBK 101.10 96.63 98.47 99.60 101.43 103.27 104.40 106.23 115.97 107.64 94.39 QIIK 81.30 78.43 79.58 80.29 81.43 82.58 83.29 84.43 88.56 85.96 81.50 Insurance QATI 87.30 83.70 85.34 86.36 88.00 89.64 90.66 92.30 98.45 91.44 79.90 Consumer Goods & Services MCGS 125.50 111.10 115.23 117.77 121.90 126.03 128.57 132.70 129.47 111.71 91.13 Industrials IQCD 182.90 176.50 179.06 180.64 183.20 185.76 187.34 189.90 189.77 183.34 183.55 QEWS 189.80 183.67 185.42 186.51 188.27 190.02 191.11 192.87 187.81 186.50 181.17 GISS 102.00 95.33 98.01 99.66 102.33 105.01 106.66 109.33 120.98 111.94 95.19 QIGD 42.70 39.90 40.86 41.45 42.40 43.36 43.95 44.90 56.91 57.11 56.10 Real Estate BRES 44.85 42.68 43.71 44.35 45.38 46.41 47.05 48.08 41.10 40.79 37.99 UDCD 24.80 24.07 24.37 24.56 24.87 25.17 25.36 25.67 28.81 27.53 25.13 ERES 16.99 16.14 16.58 16.85 17.28 17.72 17.99 18.42 19.50 20.59 21.27 MRDS 20.55 19.45 19.87 20.13 20.55 20.97 21.23 21.65 23.99 21.43 18.54 Telecommunication ORDS 114.20 108.87 110.74 111.89 113.77 115.64 116.79 118.67 129.14 131.94 139.07 VFQS 16.33 15.47 15.84 16.08 16.45 16.82 17.06 17.43 21.16 20.27 17.20 Transportation QGTS 23.74 22.39 22.81 23.07 23.48 23.90 24.16 24.57 24.32 23.80 22.91 QNNS 98.90 93.77 95.45 96.49 98.17 99.85 100.89 102.57 95.55 94.35 94.18 Source: Bloomberg, QNBFS Research; Note: Numbers in Italics denote moving averages that are above the given index level/stock price
- 5. COPYRIGHT: No part of this document may be reproduced without the explicit written permission of QNBFS Page 5 of 6 Definitions: Candlestick: A chart that displays the high, low, opening and closing prices for a security in a single period. The body of the candle is made up by the opening and the closing prices, i.e., the taller the body the greater the range between these two prices and vice versa. A colored candle denotes a closing price that is lower than the opening price, while a white candle shows the opposite. The candlestick's shadows or wicks show the period's high and low prices and how they compare to the opening and closing price. In general, the shape of the candle will vary upon the positions of the period's high, low, opening and closing prices. Support: A level that could cause more buyers to step in in order to prevent the security from falling or causing the security price to head higher. Resistance: An inverse of a support level. A resistance area or level could cause more sellers to step in in order to prevent the security from rising or causing the security price to head lower. SMA (Simple Moving Average): Is an arithmetic average, which calculates the average price of a security over a defined number of periods and is thus considered a lagging indicator. SMAs used in our analysis refer to closing prices. In general, SMAs serve many purposes, such as a smoothing tool, an indicative price direction and potential support/resistance levels. Market Breadth: Breadth indicates the number of securities that have closed higher vs. the number of decliners in a particular exchange. MACD (Moving Average Convergence/Divergence): Is a trading indicator, which shows changes in the strength, direction, momentum and duration of a trend in a stock's price through a collection of three time series calculated from historical closing price data. RSI (Relative Strength Index): Is a momentum indicator that compares a security’s price gains to its losses for a predetermined number of periods (we generally use 14 periods). The RSI attempts to point out how a security, in relative terms, is in the overbought/oversold zone. Securities with a RSI above 70 could be considered as overbought, and below 30 could be considered as oversold. Pattern/Formation: Is a graphical presentation of a security’s price activity over a certain period of time. Formations come in different shapes (such as, head & shoulders, triangles, flags, and so on). They can be used to identify potential trends, reversal of trends, price targets, entry and exit points, etc. Fibonacci Retracements: Are horizontal lines that indicate expected areas of support/resistance for a security based on a predetermined price movement. These levels are usually indicated by Fibonacci ratios of 23.6%, 38.2%, 50.0%, 61.8% and 100% from that particular movement. Fibonacci Pivot and Intra-day Support/Resistance: A Pivot Point is generally used to formulate expected future support/resistance levels. From the base Pivot Point, Fibonacci multiples of the high-low differential are added to form resistance levels and subtracted to form support levels.
- 6. COPYRIGHT: No part of this document may be reproduced without the explicit written permission of QNBFS Page 6 of 6 Contacts Saugata Sarkar Abdullah Amin, CFA Shahan Keushgerian Head of Research Senior Research Analyst Senior Research Analyst Tel: (+974) 4476 6534 Tel: (+974) 4476 6569 Tel: (+974) 4476 6509 saugata.sarkar@qnbfs.com.qa abdullah.amin@qnbfs.com.qa shahan.keushgerian@qnbfs.com.qa Sahbi Kasraoui Ahmed Al-Khoudary QNB Financial Services SPC Manager – HNWI Head of Sales Trading – Institutional Contact Center: (+974) 4476 6666 Tel: (+974) 4476 6544 Tel: (+974) 4476 6548 PO Box 24025 sahbi.alkasraoui@qnbfs.com.qa ahmed.alkhoudary@qnbfs.com.qa Doha, Qatar Disclaimer and Copyright Notice: This publication has been prepared by QNB Financial Services SPC (“QNBFS”) a wholly-owned subsidiary of QNB SAQ (“QNB”). QNBFS is regulated by the Qatar Financial Markets Authority and the Qatar Exchange QNB SAQ is regulated by the Qatar Central Bank. This publication expresses the views and opinions of QNBFS at a given time only. It is not an offer, promotion or recommendation to buy or sell securities or other investments, nor is it intended to constitute legal, tax, accounting, or financial advice. QNBFS accepts no liability whatsoever for any direct or indirect losses arising from use of this report. Any investment decision should depend on the individual circumstances of the investor and be based on specifically engaged investment advice. We therefore strongly advise potential investors to seek independent professional advice before making any investment decision. Although the information in this report has been obtained from sources that QNBFS believes to be reliable, we have not independently verified such information and it may not be accurate or complete. QNBFS does not make any representations or warranties as to the accuracy and completeness of the information it may contain, and declines any liability in that respect. For reports dealing with Technical Analysis, expressed opinions and/or recommendations may be different or contrary to the opinions/recommendations of QNBFS Fundamental Research as a result of depending solely on the historical technical data (price and volume). QNBFS reserves the right to amend the views and opinions expressed in this publication at any time. It may also express viewpoints or make investment decisions that differ significantly from, or even contradict, the views and opinions included in this report. This report may not be reproduced in whole or in part without permission from QNBFS.