Streaming VS Watching TV
•
1 like•4,185 views

JAKPAT conducted a survey to 429 respondents from users of JAKPAT Mobile Apps randomly, from 17 to 45 age ranges, and all provinces in Indonesia. The purpose of this survey are to know people's reasons for streaming and the difference between people's streaming habit and watching tv. Even if this survey does not represent the whole population, but by figuring this survey result hopefully people can figure out people's habits, attention and intention for streaming.

Recommended
More Related Content
Viewers also liked
Viewers also liked (20)
Similar to Streaming VS Watching TV
Similar to Streaming VS Watching TV (20)
More from Shabrina Rina
More from Shabrina Rina (14)
Recently uploaded
Recently uploaded (6)
Streaming VS Watching TV
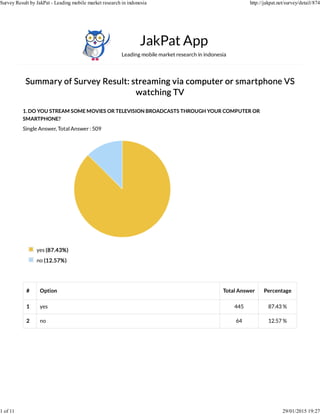
- 1. Summary of Survey Result:Summary of Survey Result:Summary of Survey Result:Summary of Survey Result: streaming via computer or smartphone VSstreaming via computer or smartphone VSstreaming via computer or smartphone VSstreaming via computer or smartphone VS watching TVwatching TVwatching TVwatching TV 1. DO YOU STREAM SOME MOVIES OR TELEVISION BROADCASTS THROUGH YOUR COMPUTER OR SMARTPHONE? Single Answer, Total Answer : 509 JakPat App Leading mobile market research in indonesia # Option Total Answer Percentage 1 yes 445 87.43 % 2 no 64 12.57 % yes (87.43%)(87.43%)(87.43%)(87.43%) no (12.57%)(12.57%)(12.57%)(12.57%) Survey Result by JakPat - Leading mobile market research in indonesia http://jakpat.net/survey/detail/874 1 of 11 29/01/2015 19:27
- 2. 2. DO YOU HAVE TV IN YOUR HOME? Single Answer, Total Answer : 445 # Option Total Answer Percentage 1 yes 434 97.53 % 2 no 11 2.47 % yes (97.53%)(97.53%)(97.53%)(97.53%) no (2.47%)(2.47%)(2.47%)(2.47%) Survey Result by JakPat - Leading mobile market research in indonesia http://jakpat.net/survey/detail/874 2 of 11 29/01/2015 19:27
- 3. 3. HOW MUCH TIME DO YOU SPEND FOR WATCHING TV? Single Answer, Total Answer : 434 # Option Total Answer Percentage 1 1-3 hours a day 234 53.92 % 2 3-6 hours a day 138 31.8 % 3 more than 6 hours a day 37 8.53 % 4 never 25 5.76 % 1-3 hours a day (53.92%)(53.92%)(53.92%)(53.92%) 3-6 hours a day (31.8%)(31.8%)(31.8%)(31.8%) more than 6 hours a day (8.53%)(8.53%)(8.53%)(8.53%) never (5.76%)(5.76%)(5.76%)(5.76%) Survey Result by JakPat - Leading mobile market research in indonesia http://jakpat.net/survey/detail/874 3 of 11 29/01/2015 19:27
- 4. 4. HOW MUCH TIME DO YOU SPEND FOR STREAMING? Single Answer, Total Answer : 434 # Option Total Answer Percentage 1 1-3 hours a day 344 79.26 % 2 3-6 hours a day 53 12.21 % 3 never 22 5.07 % 4 more than 6 hours a day 15 3.46 % 1-3 hours a day (79.26%)(79.26%)(79.26%)(79.26%) 3-6 hours a day (12.21%)(12.21%)(12.21%)(12.21%) never (5.07%)(5.07%)(5.07%)(5.07%) more than 6 hours a day (3.46%)(3.46%)(3.46%)(3.46%) Survey Result by JakPat - Leading mobile market research in indonesia http://jakpat.net/survey/detail/874 4 of 11 29/01/2015 19:27
- 5. 5. WHICH ONE OF THIS FOLLOWING DESCRIBES YOU MOST? Single Answer, Total Answer : 434 # Option Total Answer Percentage 1 i prefer watching TV than streaming 227 52.3 % 2 i prefer streaming some movies or TV broadcast than watching TV 207 47.7 % i prefer watching TV than streaming (52.3%)(52.3%)(52.3%)(52.3%) i prefer streaming some movies or TV broadcast than watching TV (47.7%)(47.7%)(47.7%)(47.7%) Survey Result by JakPat - Leading mobile market research in indonesia http://jakpat.net/survey/detail/874 5 of 11 29/01/2015 19:27
- 6. 6. WHICH ONE OF THIS FOLLOWING DESCRIBES YOU MOST? Single Answer, Total Answer : 228 i prefer watching TV because i can spend my time with my family or friends (28.07%)(28.07%)(28.07%)(28.07%) i prefer watching TV because it is simpler and easier (27.19%)(27.19%)(27.19%)(27.19%) i prefer watching TV because i don't have to use my internet connection (25.88%)(25.88%)(25.88%)(25.88%) i prefer watching TV because i can change the channels as my wish (17.11%)(17.11%)(17.11%)(17.11%) Other option (1.32%)(1.32%)(1.32%)(1.32%) i prefer watching TV because i want to see the ads in TV (0.44%)(0.44%)(0.44%)(0.44%) Survey Result by JakPat - Leading mobile market research in indonesia http://jakpat.net/survey/detail/874 6 of 11 29/01/2015 19:27
- 7. 7. WHICH ONE OF THIS FOLLOWING DESCRIBES YOU MOST? Single Answer, Total Answer : 207 # Option Total Answer Percentage 1 i prefer watching TV because i can spend my time with my family or friends 64 28.07 % 2 i prefer watching TV because it is simpler and easier 62 27.19 % 3 i prefer watching TV because i don't have to use my internet connection 59 25.88 % 4 i prefer watching TV because i can change the channels as my wish 39 17.11 % 5 Other option 3 1.32 % 6 i prefer watching TV because i want to see the ads in TV 1 0.44 % i prefer streaming because i can do other tasks without being worried of missing the story of the movie (33.33%)(33.33%)(33.33%)(33.33%) i prefer streaming because i can watch the previous episodes (31.88%)(31.88%)(31.88%)(31.88%) i prefer streaming because it is more private (15.46%)(15.46%)(15.46%)(15.46%) i prefer streaming because it is simpler and easier (12.56%)(12.56%)(12.56%)(12.56%) Other option (4.35%)(4.35%)(4.35%)(4.35%) i prefer streaming because my internet connection is really good (2.42%)(2.42%)(2.42%)(2.42%) Survey Result by JakPat - Leading mobile market research in indonesia http://jakpat.net/survey/detail/874 7 of 11 29/01/2015 19:27
- 8. 8. WHICH ONE OF THIS FOLLOWING THAT YOU PREFER TO ACCESS FOR STREAMING? Single Answer, Total Answer : 434 # Option Total Answer Percentage 1 i prefer streaming because i can do other tasks without being worried of missing the story of the movie 69 33.33 % 2 i prefer streaming because i can watch the previous episodes 66 31.88 % 3 i prefer streaming because it is more private 32 15.46 % 4 i prefer streaming because it is simpler and easier 26 12.56 % 5 Other option 9 4.35 % 6 i prefer streaming because my internet connection is really good 5 2.42 % YouTube (82.26%)(82.26%)(82.26%)(82.26%) Anime Indonesia (5.53%)(5.53%)(5.53%)(5.53%) UseeTV (3.92%)(3.92%)(3.92%)(3.92%) Mivo (3.92%)(3.92%)(3.92%)(3.92%) Other option (2.07%)(2.07%)(2.07%)(2.07%) Indo Streamix TV (1.38%)(1.38%)(1.38%)(1.38%) Survey Result by JakPat - Leading mobile market research in indonesia http://jakpat.net/survey/detail/874 8 of 11 29/01/2015 19:27
- 9. Viki (0.92%)(0.92%)(0.92%)(0.92%) Survey Result by JakPat - Leading mobile market research in indonesia http://jakpat.net/survey/detail/874 9 of 11 29/01/2015 19:27
- 10. # Option Total Answer Percentage 1 YouTube 357 82.26 % 2 Anime Indonesia 24 5.53 % 3 UseeTV 17 3.92 % 4 Mivo 17 3.92 % 5 Other option 9 2.07 % 6 Indo Streamix TV 6 1.38 % 7 Viki 4 0.92 % Survey Result by JakPat - Leading mobile market research in indonesia http://jakpat.net/survey/detail/874 10 of 11 29/01/2015 19:27
- 11. Survey Result by JakPat - Leading mobile market research in indonesia http://jakpat.net/survey/detail/874 11 of 11 29/01/2015 19:27